The non-ballistic superluminal motion in the plane of the sky
Abstract
Faster-than-light or superluminal motion was originally predicted as a relativistic illusion of ballistic moving ejecta, and confirmed in a few tens of sources observationally. However, the recent results of the long-term multi-epoch observations of quasars, active galaxies, tracing the structure further along the jets and following the motion of individual features for longer time, rise questions that are difficult to understand by the standard ballistic model. I.e., the ejecta are aligned with the local jet direction, instead of the core; and within individual jets apparently inward-moving features are observed. Here we show that these unexpected phenomena, although only a small fraction among large samples, indicate the existence of non-ballistic jet motion, in which a continuous jet produces a discrete hot spot. And the precession of such a hot spot in the plane of the sky appears superluminal. Therefore, an unified and simple interpretation to the new results is obtained, which can be further tested through its predictions on the evolution of ejecta. The study is of importance in the understanding of the nature of superluminal motion, the interaction of jets and surrounding materials, as well as the common physics underlying quasars and microquasars.
keywords:
(galaxies:) quasars:general–(stars):binaries:generalAccepted. Received
1 Introduction
The appearance on the sky of relativistically moving out flow, which expands at speed greater than the speed of light, has been predicted by Rees (1966), five years in advance of the discovery of superluminal motion (Rees, 1966; Whitney et al., 1971; Cohen et al., 1971). In units of the speed of light, , the apparent speed of separation is the ratio of the difference in observed positions to the observed time-interval. With the blob travelling at angle with respect to the line of sight (LOS), is given by
| (1) |
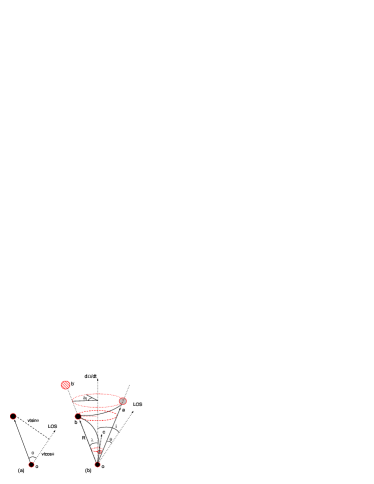
When , and at certain range, the apparent speed, , can be larger than the speed of light. In fact Eq. (1) and Fig. 1a correspond to a simple ballistic motion of ejecta, with a fixed jet axis, which has been applied to the superluminal motion of quasar like 3C279.
To interpret the S-shape pattern of SS433, a modified ballistic model has been proposed Abell & Margon (1979), in which the direction of the jet axis is variable, and denoted by , , and in Fig. 1b. In this model, features and in Fig. 1b, are the same ejection evolving at different times, which should always move along the jet axis . As the jet axis precesses to another direction, i.e., , another feature ejects out. Similarly, the trajectory of it should always be fixed at that direction. Assuming that only one feature is ejected at each direction, then the connection of these features ejected at different directions like , and forms a one sided spiral pattern, as in Fig. 1b. And considering the receding features at opposite direction to and a S-shape pattern, like SS433, is explained.
Generally, the ballistic model, with jet axis fixed or not, implies that each individual feature must move along the jet axis away from the core. Thus, the observed inward motion of features can be interpreted by newly emerging jet features ejecting from the core at the right position and time, which mimics the decrease of the apparent separation of the core and other features.
Therefore, the ballistic model implies that the whole curved pattern would move further away from the core at the next step of evolution due to that each individual feature evolves linearly as in Eq. (1). However, this is not consistent with the observation that the jet flow apparently occurs along preexisting bent channels Kellermann et al. (2004), instead of away from the core as a whole. Therefore, it is conceivable to consider other possibilities of jet motion.
2 The non-ballistic model
Theoretically, a hot spot can be generated by the interaction of a continuous jet with the surrounding material. The process of continuous ejection producing “discrete hot spots” can be simply extracted from Dermer (1999). The energy of the injected nonthermal particles comes at the expense of the directed bulk kinetic energy of the fluid. Assuming that the system produces an outflow with total energy and initial bulk Lorentz factor . Since most of the energy of the flow is bound up in the kinetic energy of baryons, assumed to be protons, then , with the total number of protons (Dermer, 1999).
Through the dynamics of the blast wave, which decelerates by sweeping up material from the surrounding medium, the deceleration radius, which can be considered as the distance of a hot spot to the core, is obtained as (Dermer, 1999),
| (2) |
where the density of external medium can be parameterized by the expression . In the simplest case, one finds that for , and for , where and in the adiabatic and radiative regimes, respectively. The term represents the fraction of the full sky into which the explosion energy is ejected. The deceleration radius, , occurs at the observing time (Dermer, 1999),
| (3) |
where and is the redshift and is the misalignment angle between the jet and LOS. At a given frequency and , there is a peak in flux density at the time of Eq. (3), in other words, the brightest emission region during its whole evolution time appears at and distance to the core.
The light curves for the model synchrotron flare at X, gamma, and radio frequencies, both along the jet axis (thick curves), and at deg to the jet axis (thin curves) are shown in Fig. 2 of Dermer (1999). Obviously, each peak in the light-curve corresponds to a hot spot during its whole evolution time.
The radial size of such a hot spot can be defined as: the length corresponding to the decline of the flux density from the peak for one order of magnitude (for X-ray emission), or for a factor of five below the peak (for radio emission). Thus, the radial length of a hot spot compared with its distance to the core is , which is between to in Fig. 2 of Dermer (1999).
When the jet axis precesses to another direction, the process of ejection and deceleration repeats. Hence another hot spot is produced, and its distance to the core is still in the case of an isotropic distribution of the material. Thus different hot spots are generated by the same continuous jet, interacting with matter at different directions, which mimics one hot spot moving in space continuously.
Contrarily, for the ballistic model hot spots or features are produced by discrete ejection events. The distance of each feature to the core is determined by Eq. (1), which varies with time. Thus simply replacing the radial velocity of a feature, , of the ballistic model of SS433 Abell & Margon (1979); Hjellming & Johnston (1981), by the distance of it to the core, , the precession of a hot spot under the non-ballistic model is obtained as,
| (4) |
where , , and are the components of in the coordinate system . The -axis is towards the observer, rotating around the -axis for angle , so that the new -axis () will point north, and the new -axis () will point east. As shown in Fig. 1, is the opening angle of the precession cone, is the inclination angle between the jet rotation axis and LOS, and the precession phase is ( is the initial phase). The displacement of a feature to the core can be described with respect to and as,
| (5) |
Differentiating Eq. (2), the velocity projected to the plane of the sky is given by,
| (6) |
The time taken by a spot to precess for tangent distance of the size of a hot spot, , is , where . The cooling time of a hot spot, , corresponding to, i.e., the time taken for the radio peak to decline for a factor of five, can be inferred from Fig. 2 of Dermer (1999). If , then the hot spot appears as a filament, otherwise, it appears as a hot spot. Obviously the precession can make a filament bent or twisted.
3 The apparent luminosity
With the intrinsic luminosity is , the apparent luminosity of a jet feature is given by,
| (7) |
where , and is the Lorentz factor, given by . And depends on the geometry and spectral index, which is typically in the range between 2 and 3. The angle , denoting the misalignment angle between the LOS and the jet axis, changes as the precession of the jet axis,
| (8) |
As varies, a feature appears moving away from the core or close to the core at different precession phase, as shown in Fig. 1. Hence, the apparent luminosity varies with the precession. Obviously, the maximum luminosity occurs when .
Whether a feature is detectable or not is dependent of the misalignment angle between the jet axis (corresponding to the hot spot) and the LOS, , as given by Eq. (8). The larger the angle, , the weaker the Doppler boosting effect. The jet emission becomes undetectable when exceeds certain limit. This explains the disappearance of features at large angular displacement, i.e., for GRS 1915+105 Miller-Jones et al. (2007).
By the new model the apparent velocity of a hot spot, , can be represented as,
| (9) |
which is dependent of parameters such as: , , , , and . Thus, the corresponding pattern speed, , if inferred from Eq. (1), is not directly related with the bulk speed, . This explains the observation of both the slow quasars with and the fast quasars with Cohen et al. (2007).
4 Inward motion and bent trajectory
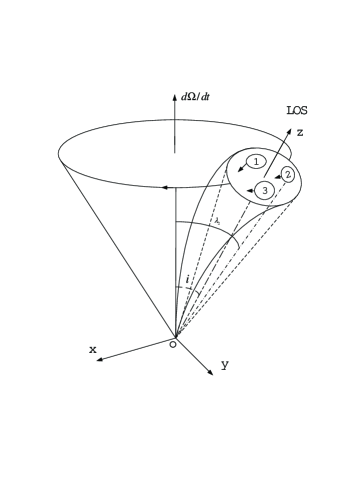
The apparent inward motion for quasars Kellermann et al. (2004) can be explained in the context of non-ballistic model. For some samples, the LOS is as the left side of Fig. 2, denoted by , in which ejecta are moving out of the core ( and are projected to 1 and 2, respectively); for other ones, the observer’s view is as , at the right side of Fig. 2, where the ejecta are moving towards the core ( and are projected to 3 and 4, respectively). Under such a circumstance, spot would precess to , which appears moving toward to the core, by projecting to on the plane of sky.
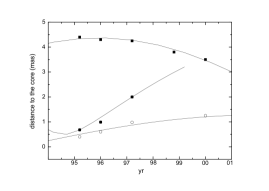
Beside a qualitative interpretation of apparently inward motion, as in Fig. 3, the observation of quasar 0119+041 can also be fitted by the new model. Assuming the parameters deg/yr, mas, deg, deg, deg, and deg, and putting them into Eq. (2), Fig. 3 can be obtained. Obviously, the curve given by the new model fits the observations (dots) better than the dashed line of the ballistic model, shown in Fig. 3. The precession velocity of the jet axis, , can originate from either the Lense-Thirring effect, or the torque exerted by the companion object in a binary system Katz (1997).

The observed bent trajectories Kellermann et al. (2004) can also be explained by the new model. According to Eq. (2), the whole trajectory of a hot spot on the plane of the sky in one precession period is an ellipse. And part of this elliptic trajectory appears as a bent trajectory, which should be nonlinear and non-radial. This explains why the ejecta are aligned with the local jet direction (as 1-2, or 3-4), instead of the core (-2, or 3-), as shown in Fig. 2.
5 Multi-ejection
The creation of multi-components in pulse profiles of a pulsar may result in a nested cone structure Gil et al. (1993), or a patchy beam structure Lyne & Manchester (1988). If the continuous jet producing hot spots in quasars and microquasars has a similar clumps beam, then the interaction of such a beam (or structured jet) with the interstellar material can reproduce multi-components either. In such case, each component can have its own misalignment angle with the axis of the precession cone, and its distance to the core can also be different.
It is conceivable that each component has approximately the same precession velocity around the axis of precession cone. So that the precession period of the major beam around the axis of precession cone and the pattern of the major beam are unchanged during jet precession. The precession of such a jet mimics a multi-component (or sub-spot) moving in space as in Fig. 4.
By assuming the parameters of Table 1, the multi-ejection of microquasar GRS 1915+105, can be fitted as in Fig. 5.

As the beam precesses through LOS, only these sub-hot spots, with the opening angle of precession cone, , equal the inclination angle, , correspond to a zero angular displacement to the core, which appear to be ejected from the core. Those with , precess through LOS with nonzero angular displacement and hence don’t appear to be ejected from the core, which explains the phenomena i.e., on 0736+017, 0735+178 and 1219+285 Kellermann et al. (2004).
| 0.283 | 52.9 | 285.0 | 52.9 | 52.9 | 52.9 |
| 0.0 | -1.2 | -2.6 | 5350.0 | 5350.0 | 6500.0 |
is in unit deg/day. , , and are the distances of the three sub-hot spots to the core in unit of mas. All other parameters are in unit of degree. The receding feature of GRS 1915+105 is obtained by assuming mas, and deg.
6 Precession of a bent jet
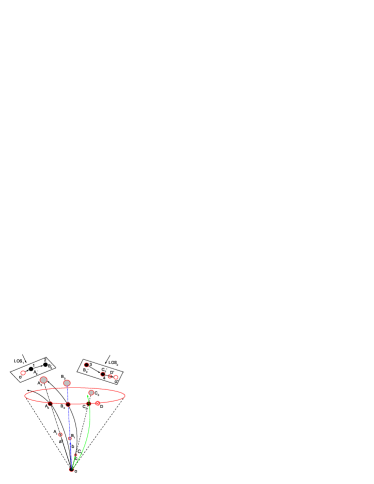
The source 0735+178 is a bizarre object, since all strange phenomena occur on it: inward motion (square dots), not from the core (all dots) and ejecta aligning with the local jet direction, instead of the core (all dots), as shown in Fig. 6. Moreover, it contains both outward motion (dots in filled and hollow circles) and inward motion (square dots).
Under the new model, the jet motion of 0735+178 results in the precession of a bent jet, which has three hot spots instead of one in 0119+041. The three hot spots can be seen as , , and in Fig. 2, locating at different radial distances, , , and respectively. The hot spots corresponding to and are not bent much, when the bulk velocities (radial), and are much larger than the precession induced tangent velocities, and , given by Eq. (9). As the distance of the plasmoid to the core becomes greater than , its velocity drops considerably, so that is less (or much less) than that of precession induced velocity, say, . Thus the hot spot , appears bent significantly. The image of 0548+165 may provide an example of such significantly bent jet Mantovani et al. (1998).
Under the condition of an isotropic distribution of material, and a continuous precessing jet (period of precession is constant), a bent jet would precess in space with an unchanged shape, as shown in the three curves through , and respectively in Fig. 2.
Consequently, the strange morphology of 0735+178 can be explained. The three hot spots along the bent jet can be treated as three individual straight jets, with different misalignment angles to the axis of precession cone, and initial precession phases, as the dashed lines in Fig. 2. In such case the jet motion of 0735+178 can be fitted as Fig. 6 through the parameters in Table 2.
| 19.6 | 12.6 | 50.9 | 9.2 | 15.5 | 6.9 |
| -154.7 | -166.2 | -17.2 | 4.0 | 8.4 | 13.1 |
is in unit of deg/yr. is in unit of mas, and others are in unit of degree.
Obviously the motion of ejecta of 0735+178 is more complicated than that of 0119+041, because the former contains three hot spots along a bent jet, whereas the latter contains one.
From the context of the non-ballistic model, there are two main discrepancies between GRS 1915+105 and 0735+178, firstly the former satisfies, , whereas the latter satisfies ; secondly can only be observed in a small range (a few degrees) in the former, whereas it is observed in much larger range in the latter.
The first discrepancy explains why the features of GRS 1915+105 appear ejecting out from the core, whereas that of 0735+178 don’t. And the second discrepancy explains why the trajectories of GRS 1915+105 appear linear and that of 0735+178 appear non-linear. In fact a curved trajectory in GRS 1915+105 is inevitable, if the ejecta of it could be observed at large .
Notice that the fitting parameters of 0119+041 and that of Table 1 and Table 2 for GRS 1915+105 and 0735+178 respectively are not unique. Other numerical solutions to them cannot be excluded.
7 Outward vs inward
The new model can account for the very large numbers of observed outward motions, as opposed to the inward ones.
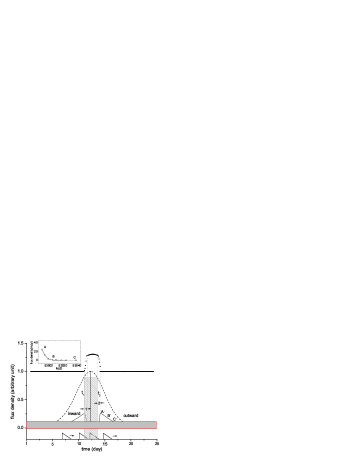
As shown in Fig. 7, the dash profile corresponds to the apparent luminosity, , obtained by putting of Eq. (8) into Eq. (7). Since is a function of time (due to ), is dependent of either. In fact the profile of , or the light-curve (L-C), can only be obtained in the case that an emission beam with negligible opening angle precesses through LOS, in other words, the convolution of with a function.
Generally, the L-C appears as the convolution of with the emission beam, , which has certain opening angle. In such case, the L-C is given by the convolution,
| (10) |
where can be both homogeneous or nonhomogeneous. Here its shape is assumed to be a rapid rise and slow decrease, which can be denoted by i.e., the triangle at the bottom of Fig. 7. By and , the L-C of an inward feature is obtained. Similarly, by setting and , the L-C of the outward feature can be obtained either.
For simplicity, the core emission is assumed to be a constant, as the horizon line with a hight of unit shown in Fig. 7. However the jet emission can be attributed to the emission of the core, when the jet precesses to the small region within the core area. The core area is between the time interval, to , as shown in the slash rectangular. Thus the apparent luminosity of the core area becomes, , where is given by setting and in Eq. (10).
By Eq. (10), the apparent luminosity of the core, the inward and the outward features are obtained. The apparent luminosity of an inward feature increases gradually. It disappears in the core area (region 1), at its maximum , as shown in the left hand side curve of Fig. 7. The region 1 is the common area of the core and the inward jet, in which the decrease of the jet apparent luminosity occurs during the increase of that of the core, which makes this region difficult to distinguish from the core.
Contrarily, an outward feature starts in the region 2, which is beyond the true core area. The jet emission rises rapidly, after reaching its maximum , it decreases gradually.
Therefore, compare with the inward features, the outward ones have an additional region 2, which is favorable to observe. This may explain the phenomenon of very large numbers of observed outward motions, as opposed to the inward ones.
The radio L-C of the SE component of GRS 1915+105 at 8.46GHz (Miller-Jones et al. 2007), as shown in the small box (A, B and C) is consistent with the outward curve (, , and ) in Fig. 7.
8 Discussions and Predictions
The non-ballistic model explains superluminal motion by the apparent transverse motion of hot spots, resulted in a continuous jet interacting with material at different locations and directions at approximately the same distance to the core. Obviously, the scenario doesn’t mean the transportation of energy and moment from one point to another with the apparent speed.
The appearance on the sky of precessing jets is affected by time delays, since the image observed is composed of photons coming from various parts of the jet that happen to have the same arrival times. However, in the fitting of jet motion of quasars and microquasars using the non-ballistic model of this paper, the time delay is neglected. The reason is as follows.
The time delay is determined by the distance along LOS, , giving by the first equation of Eq. (2), which is dependent of angles, , and , and distance, .
By Dermer (1999) the time corresponding to the radio peak is around to seconds, which means the distance of the hot spot to the core is, to cm.
Consequently, the discrepancy in the time delay corresponding to the two hot spots, i.e., and in Fig. 2, can be given by putting two different precession phases, and , corresponding to two different time, and , respectively, into the first equation of Eq. (2),
| (11) |
Therefore, by the parameters of 0119+041 and 0735+178 in the text, the time delay between two measured hot spots is less or around 1 day respectively, which is negligible in the fitting of Fig. 3 and Fig. 6. For GRS 1915+105 the time delay is hours which doesn’t affect the fitting of Fig. 5 either.
If exceeds 100pc, then the time delay between two measured hot spots would be larger than 1 year. Under such circumstance, the hot spot, i.e., B2 in Fig. 2, would had been emerged at least 1 year before it was observed. In such case, increasing the jet precession speed, , by a few percent, the data can still be fitted.
The two models can be tested simply by reanalyzing the data of 0119+041. If the previous features and move further away from the core when is observed, then the ballistic model is supported, and the features should be produced by discrete jets. Otherwise, if any intermediate feature is found, i.e., between and , or and , then the non-ballistic model is favored, and the features should be powered by a continuous jet.
The jet motion corresponding to a full period of precession is expected on sources like 0119+041 and 0735+178. If this is observed then the non-ballistic model would be supported.
The discrepancy of the inward and outward feature can also be tested. The apparent luminosity of an inward feature increases gradually, and disappears in the core area (region 1), whereas that of an outward feature may decrease from a peak. And the core area appears moving towards the outward direction for certain angular distance, as shown in Fig. 7.
The ballistic model is based on the assumption of a discrete jet, and can easily explain the linear jet motion. Comparatively, the non-ballistic model is based on the continuous jet, which interprets both the linear and nonlinear jet motion. Therefore, it explains both the phenomena the ballistic model can explain, and the ones the ballistic model cannot.
Testing the two models through their different predictions on both quasars and microquasars, and by both the data from the past and from the future, would enhance our understanding of the true mechanism of superluminal motion, the interaction of jets with interstellar matter, and the common physics underlying quasars and microquasars.
References
- Abell & Margon (1979) Abell G. O. & Margon B., 1979, Nature, 279, 701
- Cohen et al. (1971) Cohen M. H., Cannon W., Purcell G.H., Shaffer D. B., Broderick J. J., Kellermann K. I., Jauncey D. L., 1971, ApJ, 170, 207
- Cohen et al. (2007) Cohen M. H., Lister M. L., Homan D. C., Kadler M. , Kellermann K. I., Kovalev Y. Y. & Vermeulen R. C., 2007, ApJ, 658, 232
- Dermer (1999) Dermer C.D., 1999, Astroparticle Phys, 11, 1
- Gil et al. (1993) Gil J. A., Kijak J. & Seiradakis J. H., 1993, A A, 272, 268
- Hjellming & Johnston (1981) Hjellming R. M. & Johnston K. J., 1981, ApJ, 246, 141
- Katz (1997) Katz J. I., 1997, ApJ, 478, 527
- Kellermann et al. (2004) Kellermann K. I., Lister M. L., Homan D. C., Vermeulen R. C., Cohen M. H., Ros E., Kadler M., Zensus J. A., Kovalev Y. Y., 2004, ApJ, 609, 539
- Lyne & Manchester (1988) Lyne A. G. & Manchester R. N., 1988, MNRAS, 234, 477
- Mantovani et al. (1998) Mantovani F., Junor W., Bondi, M., Cotton, W., Fanti R., Padrielli L., Nicoolson G.D., & Salerno E., 1998, A A, 332, 10
- Miller-Jones et al. (2005) Miller-Jones J. C. A., McCormick D. G., Fender R. P., Spencer R. E., Muxlow T. W. B., & Pooley G. G., 2005, MNRAS, 363, 867
- Miller-Jones et al. (2007) Miller-Jones J. C. A., Rupen M.P., Fender R. P., Rushton A., Pooley G. G. & Spencer R. E., 2007, MNRAS 374, 47
- Rees (1966) Rees, M. J, 1966, Nature, 211, 468
- Whitney et al. (1971) Whitney A. R., Shapiro I. I., Rogers A. E. E., Robertson D. S., Knight C. A., Clark T. A., Goldstein R. M., Marandino, G. E. & Vandenberg N. R., 1971, Science, 173, 225
9 Acknowledgments
I thank S.N. Zhang, Z.Q. Shen and X. Liu for useful discussions and suggestions. This research is supported by the National Natural Science Foundation of China, under grand NSFC10778712.