CLEO Collaboration
Measurement of the -meson mass using
Abstract
We measure the mass of the meson using , events acquired with the CLEO-c detector operating at the CESR collider. Using three decay modes, , with , and with , we find =957.7930.0540.036 MeV, in which the uncertainties are statistical and systematic, respectively. This result is consistent with but substantially more precise than the current world average.
pacs:
14.40.Cs, 14.40.AqExperimental precision on the mass is currently worse than that of , , , , or PDG2008 . The PDG world-average value PDG2008 is . Recent experimental focus on the mass has resolved a conflict among discrepant measurements PDG2008 ; the mass uncertainty now stands out in comparison to other narrow light mesons. This Letter presents a new measurement of the mass, the first in more than a decade.
The and mesons are commonly understood as mixtures of the pure SU(3)-flavor octet () and singlet () states with possible admixtures of gluonium rosner ; gilman . The strengths of pseudoscalar and gluonium mixing become manifest in ratios of branching fractions for radiative decays of pseudoscalar () and vector () mesons, and besmix ; kloemix ; escrib . However, these effects should also be evident in relationships between masses of and on the one hand, and those of and mesons on the other. In the current (as opposed to constituent) quark framework, one such formulation for the pseudoscalar mixing angle in the flavor basis, , finds jones , to first order in flavor-symmetry breaking feldmann ,
| (1) |
Using PDG PDG2008 values for masses, =(41.4600.009)∘, which has an uncertainty dominated by (0.007∘), followed by (0.004∘) and (0.003∘). This value for is consistent with determinations based upon branching fractions (which have uncertainties at the level of 1∘ besmix ; kloemix ; escrib ), indicating flavor-symmetry breaking effects are small feldmann . In general, precision on most other predictions involving has not yet matched that of experiment, and instead appears to be limited by theoretical assumptions and approximations kekez ; gerard ; michael . More precise mass measurements will act as grounding for such predictions as they evolve.
This measurement is based upon data acquired with the CLEO detector at the CESR (Cornell Electron Storage Ring) symmetric collider, mostly in the CLEO-c configuration (95%) with the balance from CLEO III. The data sample corresponds to 27106 xnext produced mesons, of which about 4104 decay as , . We employ three decay modes, denoted as (), ( with ), and ( with ). The decay with , denoted as mode , is used to cross-check the analysis method. Other decay modes of and were studied and found to have inadequate statistical precision compared to modes -. Because both and are very narrow resonances with precisely known masses (, 11 keV; , 34 keV PDG2008 ), imposition of kinematic constraints enables a significant improvement in mass resolution. The analysis method and systematic error considerations are very similar to those of Ref. cleometa , in which , decays were used to measure .
The CLEO-c detector is described in detail elsewhere CLEO ; it offers 93% solid angle coverage of precision charged particle tracking and an electromagnetic calorimeter comprised of CsI(Tl) crystals. The tracking system enables momentum measurements for particles with momentum transverse to the beam exceeding 50 MeV/ and achieves resolution at =1 GeV/. The barrel calorimeter reliably measures photon showers down to =30 MeV and has a resolution of 5% at 100 MeV and 2.2% at 1 GeV.
Signal and background processes are modeled with Monte Carlo (MC) samples that were generated using the EvtGen event generator evtgen , fed through a Geant-based geant detector simulation, and subjected to event selection criteria. The distribution of “transition dipion” (the emitted in the -to--transition) mass is sculpted xnext to match that of the data, and angular distributions of the decay products are set to be appropriate for a vector decay into a vector and a pseudoscalar. The decay is generated using the matrix element measured in Ref. layter .
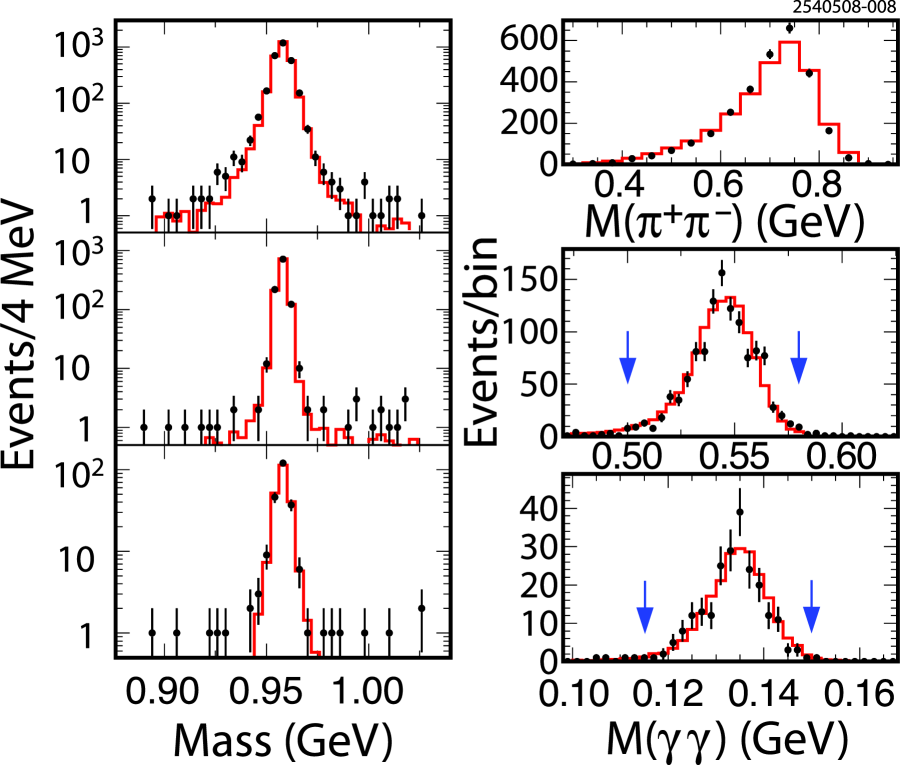
Event selection requires the tracking system to find exactly two oppositely-charged particles for the transition dipion, and two (, , and ) or four () more tracks of net charge zero. A minimum of two () or three (, , and ) photon candidates must also be found. Photons must be located in the central portion of the barrel calorimeter where the amount of material traversed is smallest and therefore energy resolution is best (0.75, where is the polar angle with respect to the initial direction). Such photons must also have energy exceeding 120 MeV () or 36 MeV (, , and ), and either be more than 30 cm from any shower associated with one of the charged pions, or, when between 15 and 30 cm from such a shower, have a photon-like lateral shower profile. Selected photons cannot lie near the projection of any charged pion’s trajectory into the calorimeter, or align with the initial momentum of any candidate within 100 mrad. Spurious showers faking photons can result from nuclear interactions of charged pions in the calorimeter. Such showers tend to have low energy for which the MC modeling may be less accurate. Therefore we consider only the two () or three (, , and ) highest energy photon candidates satisfying the above criteria to suppress such mismodeling effects. Photon pairs are candidates for a or if their invariant mass satisfies =115-150 MeV or 500-580 MeV, respectively, and are then constrained to the PDG average or masses PDG2008 .
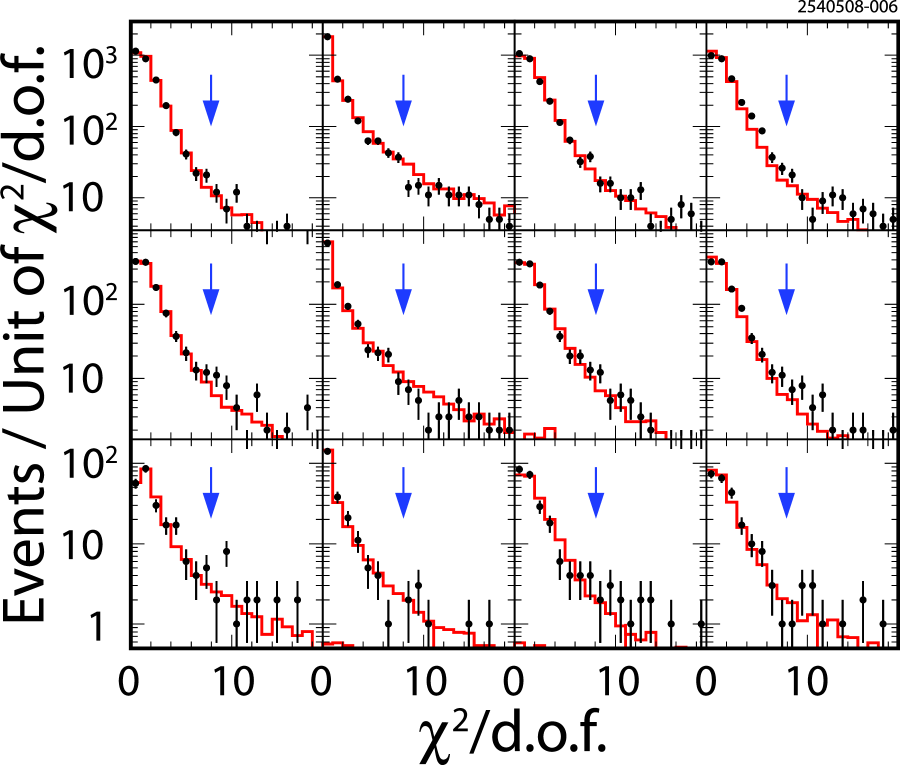
Further kinematic requirements are applied in two two-step fits: first, the decay products are constrained to originate from a single point (vertex) consistent with the beam spot and then constrained to have the mass, PDG2008 ; quality restrictions are applied to both the vertex and the mass kinematic fits (d.o.f.8 for each). Second, the candidate and transition dipion are constrained to a common vertex and then to the mass, PDG2008 , and three-momentum, including the effect of the 3 mrad crossing angle of the and beams. Again, quality restrictions are applied to both the vertex and four-momentum kinematic fits (d.o.f.8 for each). The d.o.f. distributions are shown in Fig. 1.
No attempt is made to isolate the decay in mode because this is difficult to achieve in an unambiguous way; frequently multiple such combinations per event are consistent with an decay due to confusion between the dipion from the transition and the dipion from the decay. Therefore we do not take advantage of constraining any three-pion mass to that of the as we do with in mode . The mass is instead formed from the five pion four-momenta.
With these selections, the three samples of decays are very pure. Non- decays are estimated to constitute up to a 0.5-1.0% background for all three modes, as determined by examining the recoil mass sidebands of the transition dipion for non- contamination when the vertex and mass fits are removed. Inspection of the , , , and mass distributions, shown in Fig. 2, verify that backgrounds are small. MC studies of decays that might be expected to contaminate mode , such as and and cross-feed from , , , are found to contribute only at the 0.1% level. These backgrounds show no significant structure or strong slope in the mass distributions, so their effects upon the mass determination are small compared with statistical uncertainties and are therefore neglected.
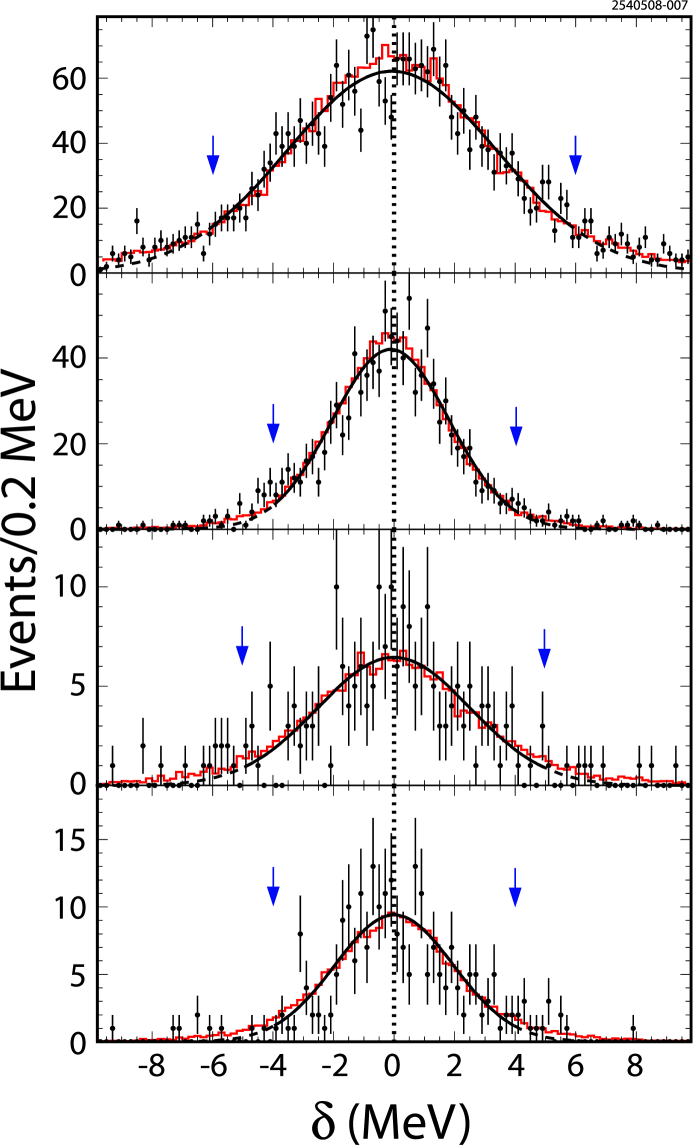
Each event yields an invariant mass of the kinematically-constrained decay products; a single mass value is extracted for each decay mode by fitting a Gaussian shape to the distribution of , where is a reference value, either the PDG2006 world-average PDG2006 (for historical reasons; the PDG2008 value is MeV PDG2008 ), or, in the case of mode , the PDG2008 mass central value. We define the symbols and as the resulting Gaussian mean and width, respectively. The fits are restricted to the central portion of each distribution because the tails outside this region are not represented well by a single Gaussian form. The fits span 1.7 to 2.1 about , and in all cases the resulting fit has a confidence level exceeding 40%. The distributions of with overlaid fits are shown in Fig. 3. Other shapes that might fit the tails, such as a double Gaussian, have been found to yield unstable fits and/or do not improve precision of finding the peak.
There is an unavoidable low-side tail in any monochromatic photon energy distribution from the CLEO calorimeter. It originates from losses sustained in interactions prior to impinging upon the calorimeter and from leakage outside those crystals used in the shower reconstruction. This asymmetric photon energy resolution function causes a small but significant systematic bias in : for simplicity of the kinematic fitting formalism, input uncertainties are assumed to be symmetric, and a bias occurs if they are not. This bias in fitted Gaussian mean is mode-dependent because each presents a different mix of charged and neutral particles.
The biases are estimated by following the above-described procedure on MC signal samples. Each is the difference between the Gaussian peak value of the distribution and the input . We define the bias as , in which we use the MC input for . A non-zero value of means that, for mode , the Gaussian peak mass is offset from the true mass and must be corrected. Although the asymmetric photon lineshape is responsible for most of this difference, the resulting correction automatically compensates for all modeled sources of bias. A bias value for the cross-check is determined similarly.
Table 1 summarizes results by decay mode. The mass result from mode ( keV) is consistent with expectations within its statistical uncertainty. The number of events involved in the determination of in modes , , and is 3917. The three values of have an average, weighted by statistical errors only, of =1553 keV with a =0.14 for two degrees of freedom, demonstrating consistency.
Systematic and statistical errors are summarized in Table 2. Uncertainties that are uncorrelated mode-to-mode, including statistical, are used to determine the weights (=0.44, 0.47, and 0.09 for , , and , respectively) applied to combine values from the three modes into the weighted sum ==135436 keV, where the uncertainties are statistical and systematic, respectively. Note that the combined value using weights including systematic errors is virtualy identical to that obtained accounting only for statistical uncertainties.
As the mass distributions are not perfectly Gaussian, there is some systematic variation of the peak value with the choice of mass window for each fit. We vary the low- and high-side mass limits by 1 MeV, symmetrically, and note the variations in MC peak values with respect to the nominal mass window, as summarized in Table 2.
Uncertainties attributable to imprecision in the masses of the (11 keV), (34 keV), and (24 keV) mesons PDG2008 are directly calculated by repeating the analysis using an altered mass and the deviation in per “1” change from nominal taken as the error. Based on the studies in Ref. cleometa we take one third of the bias magnitude plus its statistical uncertainty, /3, as our estimate of the systematic uncertainty in bias, and here also add one third of its uncertainty due to MC statistics. Uncertainties in charged particle momentum and calorimeter energy scale are evaluated by shifting those scales by the appropriate amount and repeating the analysis. We quote a relative momentum scale accuracy of 0.01% cleometa and a calorimeter energy scale uncertainty of 0.6% cleometa and use these values for our 1 systematic variations. Any deviation from ideal in momentum or energy scale is substantially damped by the four-momentum constraints, as is evident from Table 2: the momentum or energy scale 1 uncertainties induce, at most, 3 parts in 105 shift in -mass scale.
To investigate the effect of less-well-measured events, we have repeated the analysis after tightening the kinematic fitting restrictions on each of the four kinematic fits per event from d.o.f.8 to 3, losing about half of the original events. The overall statistically-weighted mass changes by 047 keV, in which the uncertainty is statistical, demonstrating stability of the measured mass with respect to the kinematic fit quality.
After combining the values in Table 1 using the quoted weights and adding the offset from above, our result is , where the first error is statistical and the second is systematic. This result betters the precision of the world average by nearly a factor of four and has a central value consistent with it. The next most precise single measurement has a factor of five larger uncertainty duane and is more than thirty years old. Three decay modes contribute to this result and are consistent with one another. This measurement brings the mass uncertainty to a level more comparable to that of or . Including this result along with other recent mass measurements in the mixing angle prediction of Eq. (1) gives =(41.4610.008)∘.
We gratefully acknowledge the effort of the CESR staff in providing us with excellent luminosity and running conditions. This work was supported by the A.P. Sloan Foundation, the National Science Foundation, the U.S. Department of Energy, the Natural Sciences and Engineering Research Council of Canada, and the U.K. Science and Technology Facilities Council.
References
- (1) C. Amsler et al. (Particle Data Group), Phys. Lett. B 667, 1 (2008).
- (2) J.L. Rosner, Phys. Rev. D 27, 1101 (1983).
- (3) F.J. Gilman and R. Kauffman, Phys. Rev. D 36, 2761 (1987), Erratum ibid. D 37, 3348 (1988).
- (4) M. Ablikim et al. (BES Collab.), Phys. Rev. D 73, 052008 (2006).
- (5) F. Ambrosino et al. (KLOE Collab.), Phys. Lett. B 648, 267 (2007).
- (6) R. Escribano and J. Nadal, J. High Energy Phys. 05, 006 (2007).
- (7) H.F. Jones and M.D. Scadron, Nucl. Phys B155, 409 (1979); H. Fritzsch and P. Minkowski, Nuovo Cim. A30, 393 (1975).
- (8) T. Feldmann and P. Kroll, Phys. Scripta T99, 13 (2002); T. Feldmann, P. Kroll, and B. Stech, Phys. Lett. B 449, 339 (1999).
- (9) D. Kekez and D. Klabucar, Phys. Rev. D 73, 036002 (2006).
- (10) J.-M. Gerard and E. Kou, Phys. Lett. B 616, 85 (2005).
- (11) C. Michael, Phys. Scripta T99, 7 (2002).
- (12) H. Mendez et al. (CLEO Collab.), Phys. Rev. D 78, 011102(R) (2008).
- (13) D.H. Miller et al. (CLEO Collab.), Phys. Rev. Lett. 99, 122002 (2007).
- (14) Y. Kubota et al. (CLEO Collab.), Nucl. Instrum. Meth. A 320, 66 (1992); M. Artuso et al., Nucl. Instrum. Meth. A 554, 147 (2005); D. Peterson et al., Nucl. Instrum. Meth. A 478, 142 (2002); CLEO-c/CESR-c Taskforces & CLEO-c Collab., Cornell University LEPP Report No. CLNS 01/1742 (2001), unpublished.
- (15) D.J. Lange, Nucl. Instrum. Methods Phys. Res., Sect. A 462, 152 (2001).
- (16) R. Brun et al., Geant 3.21, CERN Program Library Long Writeup W5013 (1993), unpublished.
- (17) J.G. Layter et al., Phys. Rev. D 7, 2565 (1973).
- (18) W.-M.Yao et al. (Particle Data Group), J. Phys. G33, 1 (2006) and 2007 partial update for 2008.
- (19) A. Duane et al., Phys. Rev. Lett. 32, 425 (1974).
| Mode | |||||
|---|---|---|---|---|---|
| 2697 | 3.46 | 71 85 | 6120 | 1087 | |
| 1017 | 1.93 | 113 69 | 14113 | 28 70 | |
| 203 | 2.51 | 9205 | 5435 | 45208 | |
| 230 | 1.95 | 3147 | 4119 | 38148 |
| Source | Variation | All | |||
|---|---|---|---|---|---|
| Fit mass window | 11 | 9 | 31 | 7 | |
| † | 34 keV | 9 | 2 | 3 | 5 |
| † | 11 keV | 3 | 2 | 2 | 2 |
| Bias | 27 | 51 | 30 | 27 | |
| scale | 0.01% | 28 | 17 | 25 | 15 |
| scale | 0.6% | 13 | 22 | 28 | 12 |
| 24 keV | 23 | 11 | |||
| Systematic Sum | 44 | 63 | 57 | 36 | |
| Statistical | 87 | 70 | 208 | 54 |