AGILE and Swift simultaneous observations of the blazar S50716+714 during the bright flare of October 2007
We present the results of a series of optical, UV, X-ray and -ray observations of the BL Lac object S50716+714 carried out by the Swift and AGILE satellites in late 2007 when this blazar was flaring close to its historical maximum at optical frequencies. We have found that the optical through soft X-ray emission, likely due to Synchrotron radiation, was highly variable and displayed a different behavior in the optical UV and soft X-ray bands. The 4-10 keV flux, most probably dominated by the inverse Compton component, remained instead constant. The counting statistics in the relatively short AGILE GRID observation was low and consistent with a constant -ray flux at a level similar to the maximum observed by EGRET. An estimate of the -ray spectral slope gives a value of the photon index that is close to 2 suggesting that the peak of the inverse Compton component in the Spectral Energy Distribution (SED) is within the AGILE energy band. The different variability behavior observed in different parts of the SED exclude interpretations predicting highly correlated flux variability like changes of the beaming factor or of the magnetic field in simple SSC scenarios. The observed SED changes may instead be interpreted as due to the sum of two SSC components, one of which is constant while the other is variable and with a systematically higher synchrotron peak energy.
1 Introduction
Blazars are a rare class of radio loud AGN known to display extreme properties like irregular, often large and rapid variability, apparent super-luminal motion, flat radio spectrum, large and variable polarization. Blazars are thought to be objects emitting radiation over the entire electromagnetic spectrum from a relativistic jet that is viewed closely along the line of sight thus causing strong relativistic amplification (e.g., Urry & Padovani (1995)). Blazars come in two flavors: Flat Spectrum Radio Quasars (FSRQs, or blazars of the Q type in the nomenclature of Giommi et al. 2008), and BL Lac objects, (or blazars of the B type in Giommi et al. 2008) depending on whether their optical spectrum does or does not show the strong and broad emission lines that are typical of QSOs. The broad-band continuum emission of both types of blazars is normally associated to synchrotron and inverse Compton emission, which is expected to produce the two-bump shaped Spectral Energy Distribution (SED) that is always observed in these sources. The synchrotron component usually peaks [in a representation] in the infra-red or in the optical band but is some cases, almost exclusively in Blazars of the BL Lac type, the synchrotron emission can peak at much higher energies, up to the hard X-ray band.
S5 0716+714 is an optically bright and well studied BL Lac known to be highly variable at all frequencies (e.g. Wagner et al. 1996; Giommi et al. 1999) and on timescales ranging from years to a few thousand seconds (e.g. Raiteri et al. 2003; Nesci et al. 2005; Foschini et al. 2006). Within the classification of Padovani & Giommi (1995) S5 0716+714 is an intermediate object (IBL) between Low Energy Peaked (LBL) and High Energy Peaked (HBL) blazars since its synchrotron component reaches the soft X-ray and the Inverse Compton component has been detected in the hard-X-rays (Giommi et al. 1999; Tagliaferri et al. 2003). Despite the many attempts to determine its redshift no positive detection of any feature in its optical spectrum has ever been reported. This, combined with the lack of any host galaxy sets a lower limit of 0.52 to its redshift (Sbarufatti et al. 2005). S5 0716+714 was detected several times by the EGRET -ray detector of the Compton Observatory (Hartman et al. 1999).
In this Letter we present a series of AGILE and Swift ToO observations of S5 0716+714 carried out between 23 October and 13 November 2007 following an AGILE detection of this source with a large -ray flux in September 2007 (Giuliani et al. 2007, ATEL 1221) and an alert issued in late October 2007 by an optical monitoring campaign reporting that this source was undergoing a large optical flare (see Villata et al. 2008, for details).
2 AGILE observations and data analysis
The AGILE observatory (Tavani et al. 2008) is a new technology satellite of the Italian Space Agency (ASI) dedicated to -ray and X-ray astrophysics. AGILE was successfully launched on 23 April 2007 into a low Earth, nearly equatorial, orbit which ensures a low particle background and short passes through the South Atlantic Anomaly. AGILE is capable of observing cosmic sources simultaneously in the 18 - 60 keV and 30 MeV - 50 GeV energy bands with the SuperAGILE (SA), (Feroci et al. 2007) and the Gamma Ray Imaging Detector (GRID) respectively. The GRID is a combination of a Silicon Tracker (Prest et al. 2003; Barbiellini et al. 2001), a Mini-Calorimeter (Labanti et al. 2006) and an Anti-coincidence System (Perotti et al. 2006)
On 23 October 2007, S5 0716+714 was reported by optical observers to be flaring at a flux close to its historical maximum (Villata et al. 2008). Despite AGILE was still undergoing its in-flight calibration program, on 24 October the satellite began a ToO maneuver to bring S5 0716+714 in its very large field of view ( 60 deg radius). The ToO lasted until 1 November 2007 11:50 UTC, for a total pointing duration of 8 days.
All GRID data are normally processed using the scientific data reduction software developed by the AGILE instrument teams and integrated into an automatic pipeline system developed at the ASI Science Data Center (ASDC). The 8 days of S5 0716+714 October ToO data have been processed with the most recent software and in-flight calibrations available at the time of writing ( 14). The AGILE software was run creating counts, exposure, and galactic background -ray maps with a bin-size of deg. To reduce the particle background contamination only events tagged as confirmed -ray events were selected (F4 filtercode=5), All the -ray events whose reconstructed directions form angles with the satellite-Earth vector smaller than 80 deg (albrad=80) were also rejected, thus reducing the -ray Earth Albedo contamination. We created maps in the full AGILE energy band E 100 MeV, and in the two separate energy bands: 100-400 MeV and 400-1000 MeV. The AGILE Maximum Likelihood procedure gives the average flux values reported in Table 1
| Energy band | Count rate | Net counts | |
|---|---|---|---|
| () | |||
| 100 MeV | (4.91.1) | 4811 | 6 |
| 100-400 MeV | (2.30.9) | 2810 | 3 |
| 400-1000 MeV | (62) | 114 | 4 |
A preliminary spectral fitting based on a least square fit to the flux estimated in different bands gives a photon spectral index of . The low counting statistics in the rather short (8 days) AGILE-GRID observation does not allow us to detect small amplitude variability. The overall flux is consistent with a constant value or with variability of magnitude less than a factor of 3. A description of the S5 0716+714 GRID observations and further details of the data analysis are reported in Chen et al. (2008). S5 0716+714 is too faint to be detected by the Super-AGILE X-ray detector.
3 Swift observations
Swift performed 10 short ToO observations of S5 0716+714 between 23 October and 13 November 2007 as detailed in Table 2. The observations were carried out using all three Swift on-board experiments: the X-ray Telescope (XRT, Burrows et al. 2005), the UV and Optical Telescope (UVOT, Roming et al. 2005) and the Burst Alert Telescope (BAT, Barthelmy et al. 2005). However, the hard-X-ray flux of S5 0716+714 is below the sensitivity of the BAT instrument for short exposure and therefore the data from this instrument will not be used here.
| Observation date | XRT exposure | Count rate |
|---|---|---|
| seconds | ct/s 0.3-10 keV | |
| 23-Oct-2007 | 2443 | 0.470.015 |
| 24-Oct-2007 | 1991 | 0.290.013 |
| 25-Oct-2007 | 2698 | 0.370.013 |
| 26-Oct-2007 | 2199 | 0.340.013 |
| 27-Oct-2007 | 1961 | 0.720.030 |
| 28-Oct-2007 | 1758 | 0.330.015 |
| 03-Nov-2007 | 2801 | 0.900.030 |
| 06-Nov-2007 | 1923 | 0.280.013 |
| 09-Nov-2007 | 2003 | 0.390.015 |
| 13-Nov-2007 | 2382 | 0.270.012 |
3.1 UVOT data analysis
During all observations UVOT produced a series of images in each of the lenticular filters (V, B, U, UVW1, UVM2, and UVW2). Photometry of S5 0716+714 was performed using the standard UVOT software distributed within the HEAsoft 6.3.2 package and the calibration included in the latest release of the “Calibration Database”. Counts were extracted from aperture of 5″ radius for all filters and converted to fluxes using the standard zero points. The fluxes were then de-reddened using a value for of 0.031 mag (Schlegel et al. 1998) with ratios calculated for UVOT filters using the mean interstellar extinction curve from Fitzpatrick (1999). No variability was detected within single exposures in any filter. Part of the UVOT data presented here also appear in Villata et al. (2008) who reported results fully consistent with ours.
3.2 XRT data analysis
All XRT observations were carried using the instrument in Photon Counting readout mode, which provides maximum sensitivity but is affected by photon pile up for count-rates larger than cts/s. The data were reduced using the XRTDAS software developed at the ASI/ASDC and distributed within the NASA/HEASARC HEAsoft 6.3.2 package. Photons were selected with grades in the range 0-12 and default screening parameters were used to produce level 2 cleaned event files. Spectral data were extracted in a circular region with a radius of 20 pixels. To avoid pile-up problems, when the source count rate was larger than 0.5 cts/s, the spectral data were extracted in an annular region with inner and outer radii of 3 and 20 pixels respectively The background was estimated in a nearby source-free circular region of 50 pixels radius. In order to use statistics, spectra were rebinned to include at least 20 photons in each energy channel. For our spectral fitting we used the XSPEC 11.3 spectral analysis package. Given the very short exposures (typically 2,000 seconds, see Tab 2) the limited photon statistics allowed us to fit the data to a simple power law spectral model with low energy absorption () fixed to to the Galactic value of cm-2 as estimated by Dickey & Lockman (1990).
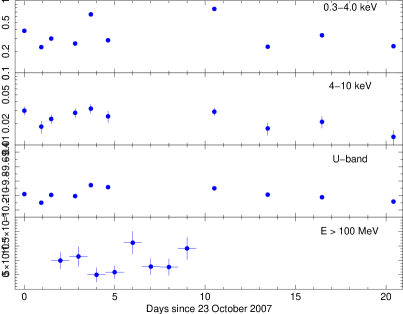
The results are reported in Tab. 3 where column 1 gives the observation date, column 2 gives the flux in the 2-10 keV band, column 3 gives the power law photon index [E-Γ] and 1 error, and column 4 gives the reduced and the number of degrees of freedom. In all cases the average photon index is steeper than 2, indicating that the 0.3-10 keV X-ray spectrum is dominated by synchrotron radiation. However, from the X-ray light curves of Fig. 1 clearly show that the soft (0.3-4 keV) X-ray flux varies much more than the hard (4-10 keV) X-ray flux, suggesting that the high energy part of the spectrum is mostly due the rise of the inverse Compton component as is also apparent in the broad-band SED of Fig. 2.
| Observation | 2-10 keV flux | Spectral slope | Reduced |
|---|---|---|---|
| date | erg cm-2 s-1 | /d.o.f. | |
| 23-Oct-2007 | 5.9 | 0.74/40 | |
| 24-Oct-2007 | 4.5 | 0.55/18 | |
| 25-Oct-2007 | 4.8 | 0.81/35 | |
| 26-Oct-2007 | 5.1 | 1.37/26 | |
| 27-Oct-2007 | 7.6 | 0.68/32 | |
| 28-Oct-2007 | 5.6 | 0.87/19 | |
| 03-Nov-2007 | 8.0 | 0.98/54 | |
| 06-Nov-2007 | 3.9 | 1.28/17 | |
| 09-Nov-2007 | 5.6 | 1.08/24 | |
| 13-Nov-2007 | 3.7 | 0.92/21 |
4 Discussion
We have presented a series of simultaneous ToO observations of the blazar S5 0716+714 carried out by the Swift and AGILE satellites following the detection of this source in a state of large flaring activity (Villata et al. 2008).
The light-curves shown in Fig. 1 show strong variability (up to a factor ) in the soft-X-ray flux, more moderate variations (less than a factor 2) at optical/UV frequencies, and an approximately constant hard X-ray (5-10 keV) flux (see also Fig. 2). A similar behavior was seen during a BeppoSAX observation of S5 0716+714 carried out in October 2000 (Tagliaferri et al. 2003; Foschini et al. 2006; Ferrero et al. 2006). The low counting statistics accumulated during the relatively short ( days) AGILE observation does not allow to detect small amplitude variability. The count-rate is consistent with a constant flux or with variations lower than a factor of 3.
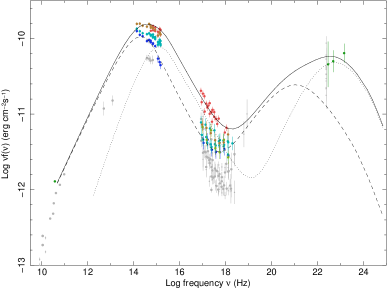
The Spectral Energy Distribution of S5 0716+714 built with all the Swift and AGILE data is shown in Fig. 2 where we see that our flux measurements (colored filled circles) are much larger than those from archival data (light grey points). Large intensity and spectral changes close to the peak and at the end of the synchrotron component, are clearly present while the rise of the inverse Compton component above approximately 4 KeV remained constant over the entire observing period. The AGILE GRID data, integrated between 23 October and 1 November, is shown as three points between 100 MeV and 1 GeV which have been derived from the fluxes reported in table 1. The intensity is close to the maximum observed by EGRET (grey points). This flaring behavior is quite different from that seen in 3C454.3 in April/May 2005 where the inverse Compton component varied by a large factor in a few days (Giommi et al. 2006). This demonstrates that flaring events in blazars may be widely different and each should ideally be followed with detailed observations covering the dynamical times scales of all the emission components. The observed spectral behavior of S5 0716+714 cannot be the result of simple changes in the magnetic field or of the beaming factor in a one-zone homogeneous SSC model. In this case the emission in different bands is expected to vary in a highly correlated way, contrary to what is observed in the optical and X-ray data of Fig. 1 and in the well sampled simultaneous light curve of Villata et al. (2008) where the R-band variations are considerably smaller then in the soft X-ray band. This behavior would also challenge external Compton model (Sikora et al. 1994; Tagliaferri et al. 2003) in which variable high energy emission should result from a single electron population accelerated by disturbances in the jet.
The different flux variations observed at optical and X-ray frequencies could instead be explained by the presence of two SSC components, one of which is constant over the entire observing period, while the second one is highly variable and possibly due to a secondary blob of relativistic plasma including fresh and more energetic particles (see Fig. 2). However, even this scenario cannot reproduce exactly the light curves and spectral changes in all energy bands as this would require a very good knowledge of all the acceleration events and a proper treatment of the energy-dependent loss mechanisms. This can be achieved only through a continuous monitoring of the source while our optical, UV and X-ray observations are just snapshots of 2,000 seconds taken approximately at one day intervals. Fig. 2 shows the two SSC components as dashed and dotted lines, while the continuous line is their sum. For their evaluation we have assumed a SSC model with broken power law spectrum for both particle components:
| (1) | |||||
| (2) |
with constant density within a spherical region of radius and with in the range . The parameters of the ”stationary” component, which reproduces the ”minimum” fluxes at UV and X-ray frequencies, are and at low and high energies respectively, and the break Lorentz factor is ; for the second component similar parameters are assumed ( and ), with a larger break Lorentz factor of , which produces a stronger emission at high energies. The magnetic field and the beaming factor for the two components are assumed to be the same ( G and ), while the first component has an higher normalization and a larger radius ( cm-3 and pc) w.r.t. the second component ( cm-3 and pc). and values are co-moving with the emitting regions.
Finally we note that during a recent large flare (Giommi et al. 2008) S5 0716+714 was detected at TeV energies (Teshima 2008) despite its likely high redshift. If the limit of z 0.52 (Sbarufatti et al. 2005) is confirmed this detection would imply that the Universe is much more transparent to TeV photons than previously claimed.
Acknowledgements.
We acknowledge funding from ASI grant I/024/05/1. This work is partly based on multi-frequency archival data taken from the ASDC, a facility of ASI.References
- Barbiellini et al. (2001) Barbiellini, G. et al. 2001 AIP Conf. Procs Vol 587 p. 754
- Barthelmy et al. (2005) Barthelmy, S. et al. 2005, SSRv., 120, 95
- Burrows et al. (2005) Burrows, D. et al. 2005, SSRv., 120, 165
- Chen et al. (2008) Chen, et al. 2008, submitted to A&A
- Dickey & Lockman (1990) Dickey, J. & Lockman, F. 1990, ARA&A, 28, 215
- Feroci et al. (2007) Feroci, M. et al. 2007, NIMPA, 581, 728
- Ferrero et al. (2006) Ferrero, E. et al. 2006, A&A, 457, 133
- Fitzpatrick (1999) Fitzpatrick, E. L. 1999, PASP, 111, 63
- Foschini et al. (2006) Foschini, L. et al. 2006, A&A, 455, 871
- Giommi et al. (2006) Giommi, P. et al. 2006, A&A, 456, 911
- Giommi et al. (2008) Giommi, P. et al. 2008, A&A, submitted
- Giommi et al. (1999) Giommi, P. et al. 1999, A&A, 351, 59
- Giommi et al. (2008) Giommi, P. et al. 2008, aTel, 1495
- Hartman et al. (1999) Hartman, R. C. et al. 1999, APJS, 123, 79
- Labanti et al. (2006) Labanti, C. et al. 2006, SPIE, 6266, 110
- Nesci et al. (2005) Nesci, R. et al. 2005, AJ, 130, 1466
- Padovani & Giommi (1995) Padovani, P. & Giommi, P. 1995, ApJ, 444, 567
- Perotti et al. (2006) Perotti, F. et al. 2006, NIMPA, 556, 228
- Prest et al. (2003) Prest, M. et al. 2003, NIMPA, 501, 280
- Raiteri et al. (2003) Raiteri, C. et al. 2003, A&A, 402, 151
- Roming et al. (2005) Roming, P. W. et al. 2005, SSRv, 120, 143
- Sbarufatti et al. (2005) Sbarufatti, B. et al. 2005, ApJ, 635, 173
- Schlegel et al. (1998) Schlegel, D. J. et al. 1998, ApJ, 500, 525
- Sikora et al. (1994) Sikora, M. et al. 1994, ApJ, 421, 153
- Tagliaferri et al. (2003) Tagliaferri, G. et al. 2003, A&A, 400, 477
- Tavani et al. (2008) Tavani, M. et al. 2008, NIMPA, 588, 52
- Teshima (2008) Teshima, M. 2008, aTel, 1500
- Urry & Padovani (1995) Urry, C. M. & Padovani, P. 1995, PASP, 107, 803
- Villata et al. (2008) Villata, M. et al. 2008, A&A, 481, L 79
- Wagner et al. (1996) Wagner, S. J. et al. 1996, AJ, 111, 2187