Detection of C3O in the low-mass protostar Elias 18
Abstract
We have performed new laboratory experiments which gave us the possibility to obtain an estimate of the amount of carbon chain oxides (namely C3O2, C2O, and C3O) formed after irradiation (with 200 keV protons) of pure CO ice, at 16 K. The analysis of laboratory data indicates that in dense molecular clouds, when high CO depletion occurs, an amount of carbon chain oxides as high as 2-310-3 with respect to gas phase carbon monoxide can be formed after ion irradiation of icy grain mantles. Then we have searched for gas phase C2O and C3O towards ten low-mass young stellar objects. Among these we have detected the C3O line at 38486.891 MHz towards the low-mass protostar Elias 18. On the basis of the laboratory results we suggest that in dense molecular clouds gas phase carbon chain oxides are formed in the solid phase after cosmic ion irradiation of CO-rich icy mantles and released to the gas phase after desorption of icy mantles. We expect that the Atacama Large Millimeter Array (ALMA), thanks to its high sensitivity and resolution, will increase the number of carbon chain oxides detected in dense molecular clouds.
1 Introduction
One of the main open questions in astrochemistry is the relation between solid phase and gas phase chemistry in dense molecular clouds. In fact in these regions ice mantles form on silicatic and carbonaceous grains after both direct freeze out of gas phase species and grain surface reactions. The presence of icy grain mantles is indirectly deduced from depletion of gas phase species and directly observed in the infrared from absorption features, attributed to vibrational modes of solid phase molecules, superposed to the background stellar spectrum. Icy grain mantles have been detected both in quiescent regions and in star forming regions. In both environments these suffer from energetic processing due to cosmic ions and UV photons. Ion and UV irradiation cause a modification of the structure and of the chemical composition of grain mantles, that is the formation of molecular species not present in the original ice. After desorption of icy mantles molecular species are released to the gas phase which could be enriched by species formed in the solid phase.
Former laboratory experiments have shown that carbon chain oxides (e.g., C2O, C3O, C3O2, C4O, C5O2, C7O2) are formed after ion irradiation and UV photolysis of CO-rich ice mixtures (e.g., Strazzulla et al., 1997; Gerakines & Moore, 2001; Trottier & Brooks, 2004; Loeffler et al., 2005) along with carbon dioxide (CO2) which is the most abundant molecule formed (e.g., Gerakines et al., 1996; Loeffler et al., 2005).
Carbon chain oxides, namely dicarbon monoxide (C2O) and tricarbon monoxide (C3O) have been detected in the molecular cloud TMC-1 towards the cyanopolyyne peak (hereinafter TMC-1CP) and it has been estimated that fractional abundance of C2O is about 610-11 and that of C3O is about 1.410-10. These abundances have been explained by ion-molecule gas phase reactions (Matthews et al., 1984; Brown et al., 1985; Ohishi et al., 2001; Kaifu et al., 2004). C3O has also been extensively searched for (Matthews et al., 1984; Brown et al., 1985) towards other objects, some of which are rich molecular-line sources and which together encompass a wide range of physical conditions. However C3O was not detected in these regions and only upper limits have been estimated. Recently C3O (Tenenbaum et al., 2006) as well as other O-bearing species, such as H2O (Melnick et al., 2001; Hasegawa et al., 2006), OH (Ford et al., 2003), and H2CO (Ford et al., 2004), have been detected towards the carbon star IRC +10216. This is an asymptotic giant branch star. O-bearing molecules are not expected in carbon stars since the bulk of available oxygen is contained in CO. In order to explain these observations it has been suggested that the increase in the star luminosity is causing the evaporation of orbiting icy bodies (Melnick et al., 2001). Alternatively it has been suggested that gas-phase oxygen-rich chemistry is occurring in the outer shell of the star (Tenenbaum et al., 2006).
Here we discuss new laboratory experiments which confirm the formation of carbon chain oxides after ion irradiation of CO ice at low temperature and give us the possibility to obtain a quantitative estimate of the amount of carbon chain oxides formed with respect to initial carbon monoxide (Section 2). We present the new detection of the C3O line at 38486.891 MHz towards the low-mass protostar Elias 18 and we confirm the detection of the same line towards TMC-1CP as already reported by Kaifu et al. (2004) (Section 3). On the basis of our laboratory results we suggest that gas phase carbon chain oxides in dense molecular clouds are actually formed in the solid phase after ion irradiation of CO-rich icy grain mantles and released to the gas phase after desorption of icy mantles (Section 4).
2 Experimental results
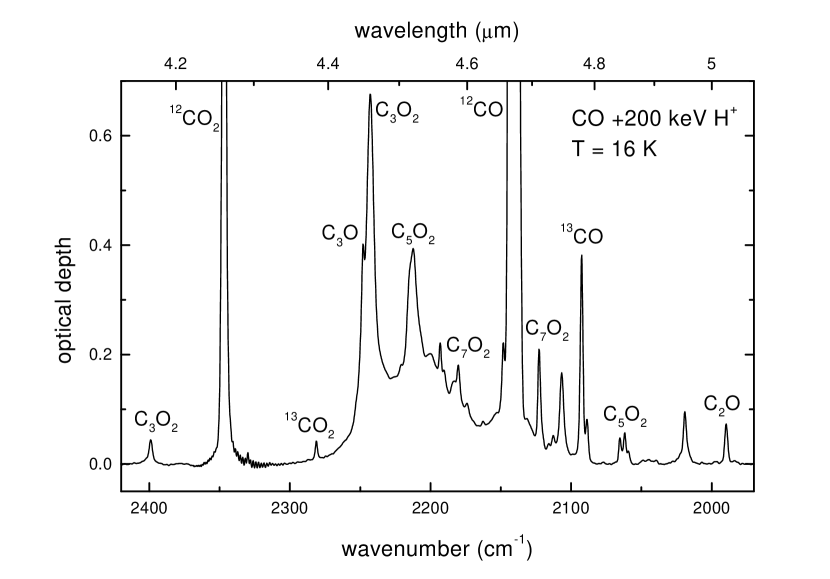
Experiments have been performed in the Laboratory for Experimental Astrophysics (INAF - Catania Astrophysical Observatory, Italy). A detailed description of the experimental set up can be found elsewhere (e.g., Strazzulla et al., 2001; Baratta et al., 2002; Palumbo et al., 2004). CO icy samples have been prepared on a cold substrate (16 K) in a vacuum chamber (P=10-7 mbar) and then irradiated with 200 keV H+ ions. Mid-IR transmission spectra (2.5-25 m; 4000-400 cm-1) have been taken before, during and after irradiation. Different CO icy samples have been irradiated and the highest ion fluence was 1.51015 ions cm-2. Figure 1 shows the spectrum of pure carbon monoxide in the 2450-1950 cm-1 (4.08-5.1 m) spectral range at 16 K after irradiation with 200 keV H+ ions (fluence equal to 1.251014 ions cm-2). It is evident that after irradiation several absorption features are present which indicate the formation of molecular species not present in the original ice sample. In Figure 1 the intense CO band at about 2139 cm-1 (4.67 m) and the CO2 band at about 2343 cm-1 (4.27 m) are out of scale. Main carbon chain oxides bands formed after irradiation are labeled. In Table 1 the peak position of most intense bands is reported along with their identification which is based also on the results presented by Trottier & Brooks (2004). A few features listed in Table 1 still remain unidentified and further laboratory experiments will be necessary for their identification.
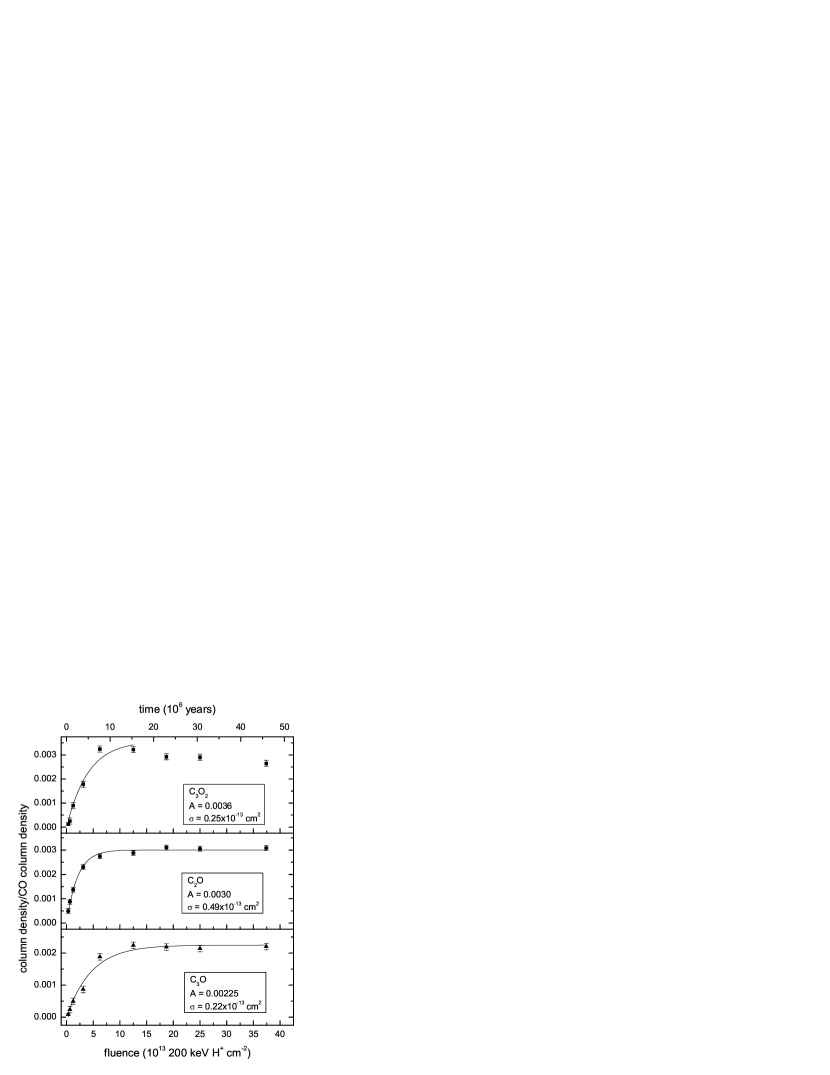
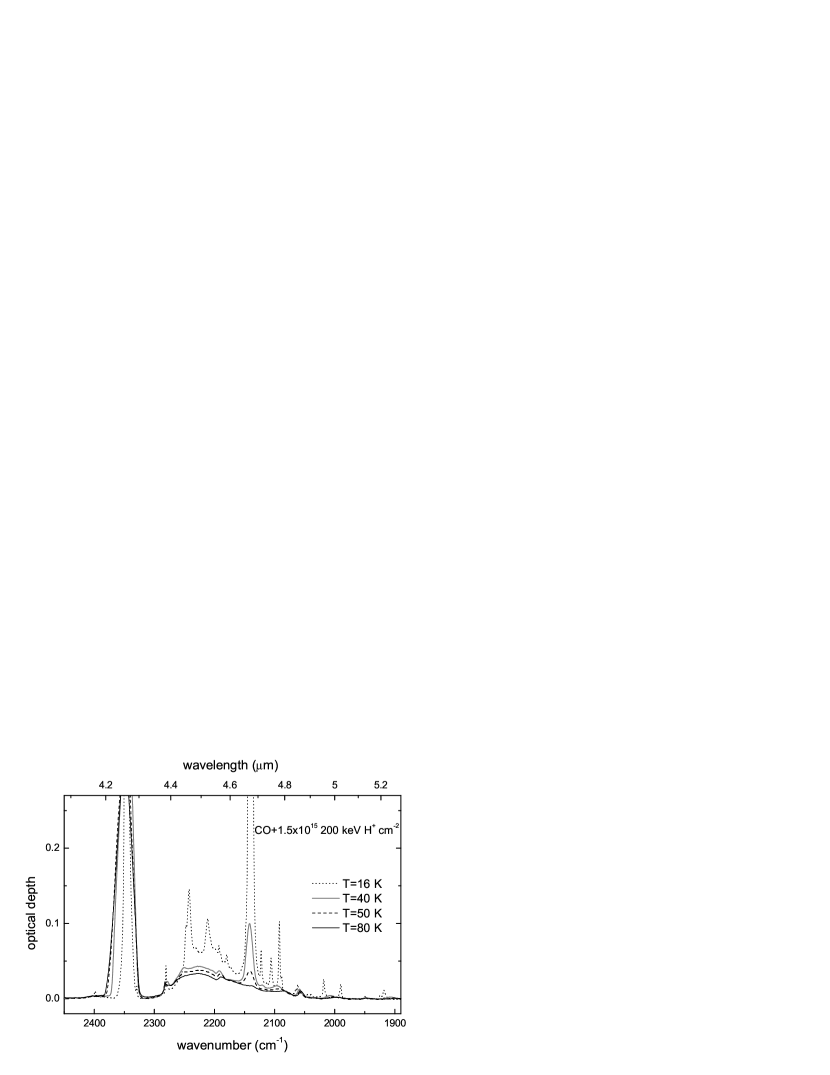
Figure 2 shows the column density of carbon suboxide (C3O2), tricarbon monoxide (C3O), and dicarbon monoxide (C2O) with respect to initial carbon monoxide as a function of ion fluence after irradiation of CO ice at 16 K. Column density of C3O2 has been obtained from the band at 2398 cm-1 using the integrated absorbance value of 0.810-17 cm molecule-1 given by Gerakines & Moore (2001). The column density of C3O and C2O have been obtained from the bands at 2247 cm-1 and 1989 cm-1 respectively. We note that the 2247 cm-1 band is superposed to the broader band at about 2242 cm-1 due to C3O2. In order to estimate the integrated intensity (area) of this band we have considered a linear baseline between 2246.7 and 2249.6 cm-1. Given that the integrated absorbance of bands due to C3O and C2O has not been measured we have assumed a value of 110-17 cm molecule-1 for both bands. In fact this value is close to the average value measured for the absorption bands of many molecules (e.g., Mulas et al., 1998; Kerkhof et al., 1999; Bennett et al., 2004). The initial column density of carbon monoxide (the 2140 cm-1 band being saturated) has been measured from the interference curve given by a He-Ne laser beam reflected both by the vacuum-film and film-substrate interfaces (e.g., Baratta & Palumbo, 1998) during accretion of the ice sample. An ice density equal to 0.8 g cm-3 (Loeffler et al., 2005) was used to obtain the column density value. The ratio of the column density of each species relative to the initial CO column density as a function of ion fluence has been fitted with the exponential curve where is the ion fluence (ions cm-2), is the process cross section (cm2) and A is the asymptotic value of the column density ratio. The and A values obtained for each species are reported in Fig. 2. In the case of C3O2 only data points obtained at ion fluence lower than 1.251014 ions cm-2 have been considered in the fitting procedure. In fact we noted that at higher fluence the column density of carbon suboxide decreases indicating that this species is destroyed after further irradiation. This also occurs to dicarbon monoxide and tricarbon monoxide at fluences higher than those given in Fig. 2. This effect has in fact already been observed for species formed after ion irradiation of other ice samples (e.g., Baratta et al., 2002). As discussed in details in Section 4, the top x-axis in Fig. 2 gives an estimation of the time (years) necessary to obtain on interstellar ices the same effects observed in laboratory. After irradiation was completed ice samples have been warmed up and spectra have been taken at 25, 40, 50, 60, 70 and 80 K. The spectrum at 25 K is almost indistinguishable from that taken at 16 K. Spectra taken at 16, 40, 50 and 80 K are shown in Fig. 3. It is evident that the intensity of absorption bands due to CO and carbon chain oxides rapidly decreases after warm up and that these are not detectable at about 80 K. On the other hand the bands due to carbon dioxide are present in the spectra at higher temperatures. This indicates that volatile species such as CO and carbon chain oxides sublimate. Finally it is worth mentioning that carbon chain oxides are not formed after ion irradiation of O-rich ice samples such as CO2:CO and H2O:CO mixtures (Strazzulla et al., 1997).
3 Observations
Radio observations have been performed in 2006 September 6-12 with the 32-m radiotelescope in Noto (Italy). Sources observed are listed in Table 2. The telescope has an active surface system that compensates the gravitational deformation of the primary mirror making observations at high frequencies also possible. This new antenna set up, together with the favorable weather conditions, allow to operate with good performance at high frequencies.
The observations have been carried out using the 22 GHz and the new 43 GHz (that can be tuned in the 38-47 GHz range) receivers. The beam size of the telescope (HPBW) was about at 22 GHz and at 43 GHz, the system noise temperature (including atmospheric noise and antenna ohmic losses) is about 90-120 K at zenith depending on weather conditions. The aperture efficiency of the telescope was about 0.28 at 43 GHz and 0.44 at 22 GHz. A duty cycle of 5 min integration on source and 5 min off source was used. Total integration time for each source is reported in Table 3.
The spectra have been acquired with the ARCOS autocorrelator (Comoretto et al., 1990) in beam switch mode; two spectra, one for each polarization, have been acquired simultaneously. Each spectrum has a bandwidth of 20 MHz, with a spectral resolution of 37 kHz, corresponding to a velocity resolution of 0.27 and 0.53 km s-1 at 43 and 22 GHz respectively. The determination of the antenna efficiency as a function of the elevation has been performed by observing the flux calibrators 3C286, 3C123 and NGC7027. The spectra were reduced by using the software XSpettro for the on-off difference then software CLASS for the baseline subtraction and temperature calibration. The antenna temperature has been corrected to account for the variation of the effective area of the telescope as a function of elevation. Then all spectra have been averaged.
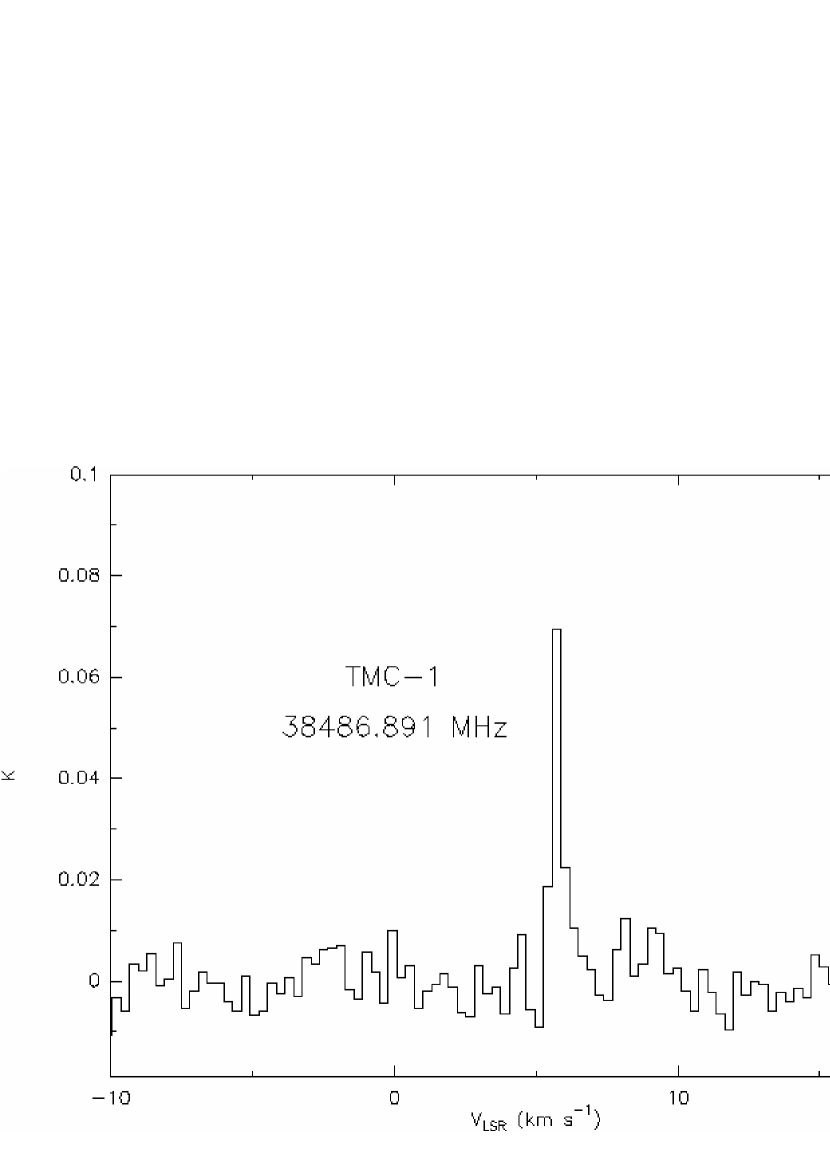
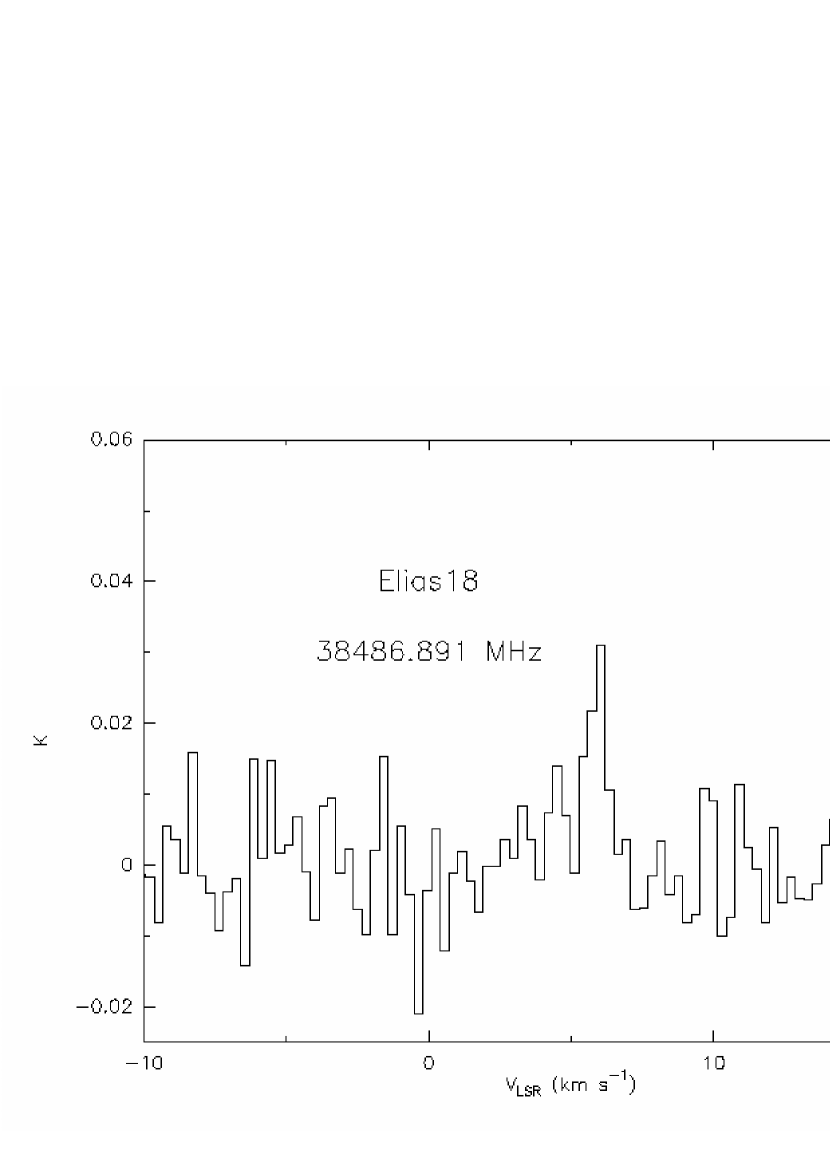
We have searched for the C2O lines at 22258.181 MHz and 45826.706 MHz and the C3O line at 38486.891 MHz towards the low-mass young stellar objects listed in Table 2. Our sample also includes TMC-1CP where the above lines have already been detected (Matthews et al., 1984; Brown et al., 1985; Ohishi et al., 2001; Kaifu et al., 2004). Figure 4 shows the C3O line at 38486.891 MHz towards TMC-1CP. This detection confirms the previous results. We have not been able to confirm the detection of C2O towards TMC-1CP as reported by Ohishi et al. (2001) and Kaifu et al. (2004) probably due to the low S/N ratio of our measurements. Figure 5 shows the C3O line at 38486.891 MHz towards Elias 18. The peak intensity of the line is 0.031 K (S/N=4.4 with rms = 0.007 K). Rms for all the sources of our sample are given in Table 3. Fitting the line profile with a gaussian curve, we have measured that the integrated intensity of the line observed towards TMC-1CP is 0.0390.008 K km s-1 and towards Elias 18 is 0.0250.005 K km s-1. In the hypothesis that the source fills the antenna beam, assuming that the line is optically thin, using Tex=20 K, (C3O)=2.39 D, and B0=4810.885 MHz (Brown et al., 1983), following the procedure described by Goldsmith & Langer (1999), we have estimated that C3O column density is 821011 molecules cm-2 towards TMC-1CP and 5.21.31011 molecules cm-2 towards Elias 18. The value of the C3O column density towards TMC-1CP we have found is lower than the value (1.40.41012 molecules cm-2) reported by Matthews et al. (1984) and Brown et al. (1985), however we believe that within the uncertainties of the estimation these values are comparable. Assuming N(H2)11022 molecules cm-2 (Guelin et al., 1982), we obtain an abundance of C3O w.r.t. hydrogen of about 10-11.
4 Discussion
Observations have shown that in dense molecular clouds the fractional abundance of carbon chain oxides (namely C2O and C3O) is of the order of 10-11-10-10 (Matthews et al., 1984; Brown et al., 1985; Ohishi et al., 2001; Kaifu et al., 2004, this work). In these regions the fractional abundance of CO is of the order of 10-4 then the abundance of carbon chain oxides with respect to CO values about 10-7-10-6. Laboratory experiments here presented indicate that after ion irradiation of pure CO ice at 16 K the amount of carbon chain oxides formed is of the order of 2-310-3 with respect to initial CO (Figure 2). In order to estimate the time necessary to obtain in dense molecular clouds the effects observed in the laboratory we consider the approximation of effective monoenergetic 1 MeV protons and assume that in dense interstellar regions the 1 MeV proton flux is equal to 1 proton cm-2 s-1 (see Mennella et al. (2003) for a detailed discussion). However our experimental results were obtained using 200 keV protons. Thus in order to extrapolate the laboratory results to the interstellar medium conditions we assume that they scale with the stopping power (S, energy loss per unit path length) of impinging ions. Using the TRIM code (Ziegler, 2003) we have estimated that for protons S(200keV)/S(1MeV) is 3.8 in the case of pure CO ice. With these hypotheses in mind we have indicated in Fig. 2 timescale axis (top x-axis), which gives an estimation of the time (years) necessary to obtain the effects, observed in laboratory, on interstellar ices. Thus if we assume high CO depletion and that the carbon chain oxides/CO column density ratio obtained in the solid phase after ion irradiation is maintained in the gas phase after desorption of icy grain mantles, then from the exponential equation used to fit the data, we obtain that about 103 years would be necessary to form the observed column density of carbon chain oxides. As we will discuss below, this time is much shorter than the evolution time scale of dense clouds, thus the observed gas phase abundance of carbon chain oxides could be easily reached even if carbon monoxide is not completely depleted and/or only partial desorption of icy grain mantles takes place.
Towards all the young stellar objects observed in this work, the solid CO absorption band at 4.67 m has been detected (e.g., Kerr et al., 1993; Chiar et al., 1994, 1995; Teixeira et al., 1998) along with the 3 m band due to water ice which is the most abundant solid phase species along these lines of sight. However, recently, a detailed study of the solid CO band profile observed towards a large sample of low mass embedded objects (Pontoppidan et al., 2003) has shown that typical lines of sight have 60-90% of the solid CO in a pure or nearly pure form, suggesting that interstellar ices are best represented by a layered model rather than a mixed ice (e.g., Fraser et al., 2004). The presence of solid CO towards TMC-1CP has never been reported. In Taurus Molecular Cloud a threshold extinction A mag is required for CO ice detection (Chiar et al., 1995). Gas-phase models use AV=10 mag in TMC-1 cores (e.g., Park et al., 2006) while AV=32 mag towards TMC-1A (Teixeira & Emerson, 1999) thus it seems reasonable to assume that CO ice is also present along the line of sight of TMC-1CP.
Elias 18 resides in a part of the Taurus molecular cloud known as Heiles cloud 2 (HCL2) where low-mass star formation is active. It is a highly obscured object (AV 15-19 mag) and it has been suggested (Tegler et al., 1995) that it is in transition between an embedded young stellar object and an exposed T Tauri star. The IR spectral energy distribution (SED) for this source is typical of a class II or “flat-spectrum” YSO with significant optical extinction (Elias, 1978). Recent observations indicate that Elias 18 has a circumstellar disk oriented close to edge-on and that most of the CO in the disk is incorporated in icy mantles on dust grains, i.e. high depletion is observed (Shuping et al., 2001). Mid-IR observations towards Elias 18 show the presence of both the solid CO and CO2 absorption bands (e.g., Tielens et al., 1991; Chiar et al., 1995; Nummelin et al., 2001). The comparison between observations relative to solid CO and laboratory spectra indicates that different ice mixtures can equally well reproduce the observed band profile (Palumbo & Strazzulla, 1993; Chiar et al., 1995, 1998). However all the fits indicate that a comparable amount of solid CO is in the nonpolar (i.e., CO-rich) and polar (i.e., H2O-rich) components. Among the fits obtained, it has been shown that the nonpolar component can be reproduced by the spectrum of ion irradiated pure CO ice (and this is compatible with the hypothesis that CO-rich icy mantles are present along the line of sight in order to form carbon chain oxides) and the polar component can be reproduced by the spectrum of CO formed after ion irradiation of a H2O:CH3OH ice mixture (Palumbo & Strazzulla, 1993). Detection of the stretching mode band of solid CO2 towards Elias 18 and the comparison of the observed band profile with laboratory spectra have been reported by Nummelin et al. (2001). However, as discussed by Ehrenfreund et al. (1997); Gerakines et al. (1999); Ioppolo et al. (2008), the profile of the stretching mode band does not strongly depends on the ice mixture and cannot be used to constrain the ice composition along the line of sight.
TMC-1CP is a dense core in the TMC-1 cold dark cloud. Based on gas phase observations and chemical evolution models it has been deduced that its age is about 105 years and the density is nH = 2104 cm-3 (Park et al., 2006). Thus the gas would take 109/nH=5104 years to condense on grains (Tielens & Allamandola, 1987). The presence of gas phase species implies that desorption processes, such as photodesorption, grain-grain collisions, cosmic ray induced desorption and turbulence, compete with mantle accretion in this region (Boland & de Jong, 1982; Hasegawa & Herbst, 1993; Bringa & Johnson, 2004).
Thus detection of C3O towards these lines of sight is compatible with the hypothesis that this molecular species is formed in the solid phase and released to the gas phase when desorption of icy mantles takes place.
The results here discussed do not exclude that carbon chain oxides are also formed after gas phase reactions in dense molecular clouds. Furthermore we are aware that further observational data are necessary to confirm these results. In fact we plan to search for carbon chain oxides towards other sources in particular hot corinos in Class 0 low mass protostellar objects where evidence of ice mantle evaporation has been reported (Bottinelli et al., 2007).
One of the mysteries of interstellar chemistry is the mechanism regulating the balance between gas phase and solid phase species. Carbon chain oxides could be key molecules in this field and thanks to its high sensitivity and resolution the Atacama Large Millimeter Array (ALMA) will give important results increasing the number of detected features in a larger sample of molecular clouds.
Finally, as far as we know, the detection of C2O and C3O in comets has never been reported. However comets suffer from heavy ion irradiation (Strazzulla & Johnson, 1991) and CO is abundant in these objects thus we expect that carbon chain oxides are present in comets too. In fact a tentative detection of carbon suboxide (C3O2) in comet Halley has been reported (Huntress et al., 1991; Crovisier et al., 1991). A firm detection of carbon chain oxides in comets could also be used to support the hypothesis that the presence of O-bearing species, and in particular C3O, in carbon stars, such as IRC +10216, is due to sublimation of orbiting icy bodies as suggested by Melnick et al. (2001).
References
- Baratta & Palumbo (1998) Baratta, G. A., & Palumbo, M. E. 1998, J. Opt. Soc. Am. 15, 3076
- Baratta et al. (2002) Baratta, G. A., Leto, G., & Palumbo, M. E. 2002, A&A, 384, 343
- Bennett et al. (2004) Bennett, C. J., Jamieson, C., Mebel, A. M., & Kaiser, R. I. 2004, Phys. Chem. Chem. Phys., 6, 735
- Boland & de Jong (1982) Boland, W., & de Jong T. 1982, ApJ, 261, 110
- Bottinelli et al. (2007) Bottinelli, S., Ceccarelli, C., Williams, J. P., & Lefloch, B. 2007, A&A, 463, 601
- Bringa & Johnson (2004) Bringa, E. M., & Johnson, R. E. 2004, ApJ, 603, 159
- Brown et al. (1983) Brown, R. D., Eastwood, F. W., Elmes P. S., & Godfrey, P. D. 1983, J. Am. Chem. Soc., 105, 6496
- Brown et al. (1985) Brown, R. D., Godfrey, P. D., Cragg, D. M., et al. 1985, ApJ, 297, 302
- Chiar et al. (1994) Chiar, J. E., Adamson, A. J., Kerr, T. H., & Whittet, D. C. B. 1994, ApJ, 426, 240
- Chiar et al. (1995) Chiar, J. E., Adamson, A.J., Kerr, T. H., & Whittet, D. C. B. 1995, ApJ, 455, 234
- Chiar et al. (1998) Chiar, J. E., Gerakines, P. A., Whittet, D. C. B., et al. 1998, ApJ, 498, 716
- Comoretto et al. (1990) Comoretto, G., Palagi, F., & Cesaroni, R. 1990, A&AS, 84, 179
- Crovisier et al. (1991) Crovisier, J., Encrenaz, T., & Combes M. 1991, Nature, 353, 610
- Ehrenfreund et al. (1997) Ehrenfreund, P., Boogert, A. C. A., Gerakines, P. A., Tielens, A. G. G. M., & van Dishoeck, E. F. 1997, A&A, 328, 649
- Elias (1978) Elias, J. H., 1978, ApJ, 224, 857
- Ford et al. (2003) Ford, K. E. S., Neufeld, D. A., Goldsmith, P. F., & Melnick, G. J. 2003, ApJ, 589, 430
- Ford et al. (2004) Ford, K. E. S., Neufeld, D. A., Schilke, P., & Melnick, G. J. 2004, ApJ, 614, 990
- Fraser et al. (2004) Fraser, H. J., Collings, M. P., Dever, J. W., & McCoustra, M. R. S. 2004, MNRAS, 353, 59
- Gerakines et al. (1996) Gerakines, P. A., Schutte, W. A., & Ehrenfreund, P. 1996, A&A, 312, 289
- Gerakines et al. (1999) Gerakines, P. A., Whittet, D. C. B., Ehrenfreund, P., et al. 1999, ApJ, 522, 357
- Gerakines & Moore (2001) Gerakines, P. A., & Moore, M. H. 2001, Icarus, 154, 372
- Goldsmith & Langer (1999) Goldsmith, P. F., & Langer, W. D. 1999, ApJ, 517, 209
- Guelin et al. (1982) Guelin, M., Langer, W. D., & Wilson, R. W. 1982, A&A, 107, 107
- Hasegawa & Herbst (1993) Hasegawa, T. I., & Herbst, E. 1993, MNRAS, 261, 83
- Hasegawa et al. (2006) Hasegawa, T. I., Kwok, S., Koning, N., et al. 2006, ApJ, 637, 791
- Huntress et al. (1991) Huntress, W. T., Allen, M., & Delitsky, M. 1991, Nature, 352, 316
- Kaifu et al. (2004) Kaifu N., Ohishi M., Kawaguchi K., et al., 2004, Publ. Astron. Soc. Japan, 56, 69
- Kerkhof et al. (1999) Kerkhof, O., Schutte, W. A., & Ehrenfreund, P. 1999, A&A, 346, 990
- Kerr et al. (1993) Kerr, T. H., Adamson, A. J., & Whittet, D. C. B. 1993, MNRAS, 262, 1047
- Ioppolo et al. (2008) Ioppolo, S., Palumbo, M. E., Baratta, G. A., & Mennella, V. 2008, A&A, submitted
- Loeffler et al. (2005) Loeffler, M. J., Baratta, G. A., Palumbo, M. E., Strazzulla, G., & Baragiola, R. 2005, A&A, 435, 587
- Matthews et al. (1984) Matthews, H. E., Irvine, W. M., Friberg, P., Brown, R. D., & Godfrey, P. D. 1984, Nature, 310, 125
- Melnick et al. (2001) Melnick, G. J., Neufeld, D. A., Ford, K. E. S., Hollenbach D. J., & Ashby M. L. N. 2001, Nature, 412, 160
- Mennella et al. (2003) Mennella, V., Baratta, G. A., Esposito, A., Ferini, G., & Pendleton, Y.J. 2003, ApJ, 587, 727
- Mulas et al. (1998) Mulas, G., Baratta, G. A., Palumbo, M. E., & Strazzulla, G. 1998, A&A, 333, 1025
- Nummelin et al. (2001) Nummelin, A., Whittet, D. C. B., Gibb, E. L., Gerakines, P. A., & Chiar, J. E. 2001, ApJ, 558, 185
- Ohishi et al. (2001) Ohishi, M., Suzuki, H., Ishikawa, S., et al., 1991, ApJ, 380, L39
- Palumbo & Strazzulla (1993) Palumbo, M. E., & Strazzulla, G. 1993, A&A, 269, 568
- Palumbo et al. (2004) Palumbo, M. E., Ferini, G., & Baratta, G. A. 2004, Adv. Space Res. 33, 49
- Palumbo et al. (1998) Palumbo, M. E., Baratta, G. A., Brucato, J. R., Castorina, A. C., Satorre, M. A., & Strazzulla, G. 1998, A&A 334, 247
- Park et al. (2006) Park, I. H., Wakelam, V., & Herbst, E. 2006, A&A, 449, 631
- Pontoppidan et al. (2003) Pontoppidan, K. M., Fraser, H. J., Dartois, E. et al., 2003, A&A, 408, 981
- Shuping et al. (2001) Shuping, R. Y., Chiar, J. E., Snow, T. P., & Kerr, T. 2001, ApJ, 547, L161
- Strazzulla & Johnson (1991) Strazzulla, G., & Johnson, R. 1991, in Comets in the post Halley era, ed. R. L. Newburn & M. Neugebauer (Kluwer, Dordrecht) 243
- Strazzulla et al. (2001) Strazzulla, G., Baratta, G. A., & Palumbo, M. E. 2001, Spectrochim. Acta A, 57, 825
- Strazzulla et al. (1997) Strazzulla, G., Brucato, J. R., Palumbo, M. E., & Satorre, M. A. 1997, A&A, 321, 618
- Tegler et al. (1995) Tegler, S. C., Weintraud, D. A., Rettig, T. W., Pendleton, Y. J., Whittet, D. C. B., & Kulesa, C. A. 1995, ApJ, 439, 279
- Teixeira & Emerson (1999) Teixeira, T. C., & Emerson, J. P. 1999, A&A, 351, 292
- Teixeira et al. (1998) Teixeira, T. C., Emerson, J. P., & Palumbo, M. E. 1998, A&A, 330, 711
- Tenenbaum et al. (2006) Tenenbaum, E. D., Aponi, A. J., Ziurys, L. M., Agundez, M., Cernicharo, J., Pardo, J. R., Guelin, M., 2006, ApJ, 649, L17
- Tielens & Allamandola (1987) Tielens, A.G.G.M., & Allamandola, L. J. 1987, in: G. E. Morfill, & M. Scholer (eds.), Physical processes in interstellar clouds, (Reidel, Dordrecht) p.333
- Tielens et al. (1991) Tielens, A.G.G.M., Tokunaga, A. T., Geballe, T. R., & Baas, F. 1991, ApJ, 381, 181
- Trigilio et al. (2006) Trigilio, C., Umana, G., Siringo, C., Buemi, C., Leto, P., Codella, C., & Panella, D. 2006, MSAIS 10, 171
- Trigilio et al. (2007) Trigilio, C., Palumbo, M. E., Siringo, C., & Leto, P. 2007, ApSS, in press
- Trottier & Brooks (2004) Trottier, A., & Brooks, R. L., 2004, ApJ, 612, 1214
- Ziegler (2003) Ziegler, J. F. 2003, Stopping and Range of Ions in Matter SRIM2003 (available at www.srim.org)
| band position | identification |
|---|---|
| (cm | |
| 3706 | CO2 |
| 3601 | CO2 |
| 3069 | C3O2 |
| 2398 | C3O2 |
| 2340 | CO2 |
| 2329 | C16O18O |
| 2280 | 13CO2 |
| 2247 | C3O |
| 2242 | C3O2 |
| 2211 | C5O2 |
| 2192 | OCC13CO |
| 2179 | C7O2 |
| 2140 | CO |
| 2122 | C7O2 |
| 2112 | C17O |
| 2105 | |
| 2092 | 13CO |
| 2088 | C18O |
| 2064 | |
| 2061 | C5O2 |
| 2018 | |
| 1989 | C2O |
| 1924 | |
| 1918 | C4O |
| 1042 | O3 |
| ObjectaaOther ID is given in brackets. | Region | (2000) | (2000) |
|---|---|---|---|
| TMC-1CP | Taurus | 04 41 45.9 | 25 41 27 |
| TMC1-A | Taurus | 04 39 35.0 | 25 41 47 |
| Elias 18 | Taurus | 04 39 55.7 | 25 45 02 |
| L1551 IRS5 | Taurus | 04 31 33.9 | 18 08 08 |
| L1489IR | Taurus | 04 04 43.1 | 26 18 58 |
| Elias 29 (WL15) | Ophiuchus | 16 27 09.3 | -24 37 21 |
| Elias 32 (VS18) | Ophiuchus | 16 27 28.5 | -24 27 17 |
| WL5 | Ophiuchus | 16 27 18.0 | -24 28 52 |
| CK1 (SVS20) | Serpens | 18 29 57.5 | 01 14 07 |
| SVS4 | Serpens | 18 29 57.8 | 01 12 48 |
| CCO | CCO | C3O | ||||
| =22258.181 MHz | =45826.706 MHz | =38486.891 MHz | ||||
| JN=21-10 | JN=32-21 | J=4-3 | ||||
| Source | int. time | rms | int. time | rms | int. time | rms |
| (min) | (K) | (min) | (K) | (min) | (K) | |
| TMC-1CP | 300 | 0.008 | 140 | 0.011 | 380 | 0.005 |
| TMC-1A | 160 | 0.010 | ||||
| Elias 18 | 180 | 0.010 | 140 | 0.008 | 200 | 0.007 |
| L1551 IRS5 | 300 | 0.007 | 150 | 0.009 | 300 | 0.007 |
| L1489IR | 300 | 0.008 | 220 | 0.001 | 240 | 0.008 |
| Elias 29 | 90 | 0.016 | 90 | 0.019 | 200 | 0.008 |
| Elias 32 | 90 | 0.016 | 90 | 0.022 | 160 | 0.011 |
| WL5 | 90 | 0.018 | 80 | 0.025 | 160 | 0.009 |
| CK1 | 120 | 0.013 | 120 | 0.014 | 230 | 0.006 |
| SVS4-4 | 200 | 0.011 | 120 | 0.015 | 160 | 0.008 |