Study of reconnection-associated multi-scale fluctuations with Cluster and Double Star
Abstract
The objective of the paper is to asses the specific spectral scaling properties of magnetic reconnection associated fluctuations/turbulence at the Earthward and tailward outflow regions observed simultaneously by the Cluster and Double Star (TC-2) spacecraft on September 26, 2005. Systematic comparisons of spectral characteristics, including variance anisotropy and scale-dependent spectral anisotropy features in wave vector space were possible due to the well-documented reconnection events, occurring between the positions of Cluster (X = -14–16 ) and TC-2 (X = -6.6 ). Another factor of key importance is that the magnetometers on the spacecraft are similar. The comparisons provide further evidence for asymmetry of physical processes in Earthward/tailward reconnection outflow regions. Variance anisotropy and spectral anisotropy angles estimated from the multi-scale magnetic fluctuations in the tailward outflow region show features which are characteristic for magnetohydrodynamic cascading turbulence in the presence of a local mean magnetic field. The multi-scale magnetic fluctuations in the Earthward outflow region are exhibiting more power, lack of variance and scale dependent anisotropies, but also having larger anisotropy angles. In this region the magnetic field is more dipolar, the main processes driving turbulence are flow breaking/mixing, perhaps combined with turbulence ageing and non-cascade related multi-scale energy sources.
VÖRÖS ET AL. \titlerunningheadReconnection associated multi-scale fluctuations \authoraddrZ. Vörös, Space Research Institute, Austrian Academy of Sciences, Schmiedlstrasse 6, 8042 Graz, Austria. (zoltan.voeroes@oeaw.ac.at)
1 Introduction
Magnetic reconnection (MR) is a fundamental physical process which was proposed to explain changes in magnetic field topology and associated conversion of magnetic to kinetic energy in laboratory, space and astrophysical plasmas [e.g. Birn and Priest, 2007]. The intensive research in these fields gradually led to a conception of MR being a multi-scale, non-stationary, 3D process in real systems. In the terrestrial magnetotail MR occurs in localized regions, where kinetic effects breaking the frozen-in condition lead to particle acceleration, plasma bulk flows and other large-scale outcomes which are back-reacting on proton/electron-scale processes. There are many unsolved details, even opposing results and viewpoints about MR and its multi-scale signatures [e.g., Nakamura et al., 2006; Baumjohann et al., 2007], therefore in-situ multi-point measurements are of immense importance. The four-spacecraft Cluster mission allowed, for example, for the first time direct calculations of spatial gradients and unambiguously observed Hall magnetic fields and current sheet structure near a reconnection region [Runov et al., 2003] and permitted to estimate the spatial size of bulk plasma flows [Nakamura et al., 2004]. The spatial structure of plasma outflow associated turbulence was also established using multi-point Cluster measurements [Vörös et al., 2007a]. The multi-point Double Star (TC) - Cluster spacecraft measurements have already provided essential information about the large-scale dynamics of magnetotail. For example, more information was obtained about the propagation of dipolarization fronts [Nakamura et al., 2005; Takada et al., 2006], flow related structures [Volwerk et al., 2005, 2007] or the radial extension of flapping motions [Zhang et al., 2005].
In this paper we will analyze and compare the spectral properties of multi-scale magnetic fluctuations/turbulence associated with the identified MR events in the companion paper by Sergeev et al. (this issue). A strong coupling between reappearing reconnections and associated turbulence during the September 26, 2005 MR events has already been emphasized at a qualitative level [Sergeev et al., 2007]. Our goal here is to provide a quantitative description in terms of scaling properties of non-stationary magnetic fluctuations within sliding overlapping windows. We also focus on the anisotropy of fluctuations which is introduced by a local mean magnetic field. The estimated anisotropies indicate a clear difference between the physical processes at the Earthward and tailward outflow sides of MR events at the positions of the TC-2 and Cluster spacecraft. Variance anisotropy and scale-dependent increase of anisotropy at Cluster’s location (14-16 Re) indicates the presence of reconnection outflow associated magnetohydrodynamic cascading turbulence. At the geostationary distance, where TC-2 is located ( 6.6 Re), variance anisotropy is absent, the anisotropy is not scale dependent and the fluctuations do not correspond to a simple cascading turbulence. In this case magnetic fluctuations are driven differently.
In the analysis presented in this paper magnetic field data from the Cluster Flux Gate Magnetometer (FGM, [Balogh et al., 2001]) and from the Double Star Magnetic Field Investigation (FGM, [Carr et al., 2005]) will be used, both available with 22 Hz resolution. Spin averaged (4s) bulk velocity data from the Cluster Ion Spectrometry experiment (CIS, [Rème et al., 2001]) will be used for identification of bulk flow associated magnetic fluctuations at the position of Cluster spacecraft.
2 Spectral analysis of magnetic fluctuations
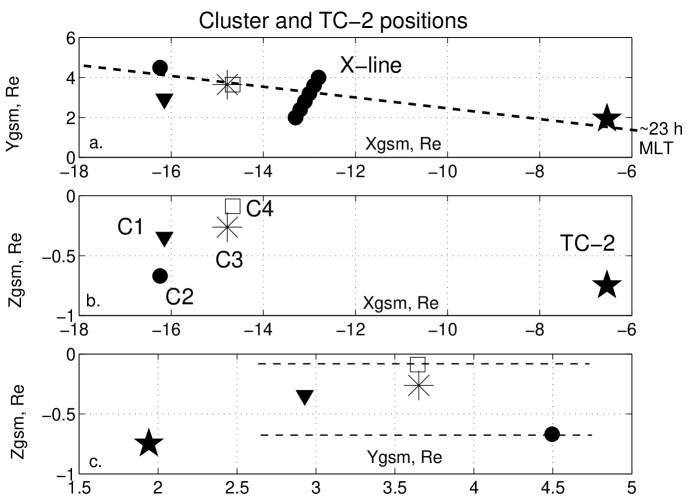
In a companion paper by Sergeev et al. (this issue), some signatures and consequences of three intense repeatedly occurring MR events between 08 and 10 UT on September 26, 2005 at near-Earth magnetotail are studied using data from Cluster, Double Star (TC-2), GOES10 and LANL spacecraft. The MR events were identified on the basis of simultaneous observations in the inflow and outflow regions and near-separatrix regions, including energetic electron bursts, Alfvènic outflows, current densities, quadrupole magnetic fields, electric fields, injections of energetic particles to geostationary orbit and perturbations of the plasma sheet. We are not going into all the details here, however, we will accept the working hypothesis that the observed plasma flows and magnetic fluctuations are associated with MR events (Sergeev et al., this issue). Magnetospheric modeling and mapping together with the corresponding auroral brightenings observed by IMAGE auroral imager helped to identify magnetic field configurations. During this unique period, the Cluster (14-16 Re) - X-line - TC-2 (6.6 Re) constellation and the auroral brightening region were aligned along the same meridian ( 23 h MLT) and Cluster and TC-2 probed opposite sides of MR associated dynamical activations. Figure 1 shows the GSM positions of the spacecraft, supposed to be near the central meridian of repeatedly observed activations. For better orientation, the approximate position of the X-line is depicted in Figure 1a. The horizontal dashed lines in Figure 1 c show the GSM Z extent of reconnection outflow at Cluster positions during the event around 0942 UT [Vörös et al., 2007a], (see later). PEACE and CIS spectrograms (not shown), together with magnetic and plasma parameters confirm that the Cluster spacecraft stay inside the plasma sheet during the whole period of study. For example, the plasma density was about 1 and the plasma 1. Ion moments are not available from TC-2, but the electron moments from the PEACE instrument and magnetic field variations show that TC-2 was in the middle of the plasma sheet (see Sergeev et al., this issue). For example, the electron density was about 1.2 - 1.4 and the electron temperature varied between 2-3 keV at TC-2 during the activations.
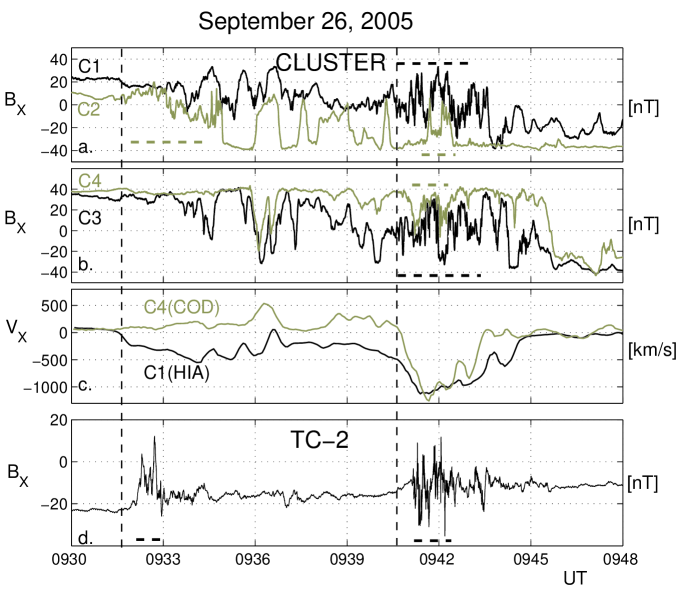
The two upper subplots in Figure 2a, b show the magnetic components from the Cluster spacecraft. Figure 2c shows the available bulk velocity data from the C1 (Hot Ion Analyzer) and C4 (Composition Distribution Function) spacecraft. In Figure 2d the magnetic component from TC-2 is depicted. The time period from 0930 to 0948 UT in Figure 2 contains the events on September 26, 2005, labeled as b.) and c.) in the paper by Sergeev et al. (this issue). The separation between C3 and C4 in Zgsm direction is 1000 km, while much smaller in other directions (Figure 1). Therefore, the increased difference between Bx components measured by C3 and C4 after 0937 UT is a signature of a thin current sheet, which is expected to occur near the reconnection region. We will argue below that the magnetic fluctuations at Cluster and at TC-2 positions are different. In Figures 2a,b,d horizontal dashed lines show the occurrence of multi-scale (wide-band) fluctuations in dynamic spectra (not shown). Although the positions of Cluster spacecraft relative to the neutral sheet or bulk flows are changing in time, the magnetic fluctuations are very intense during the major part of the depicted interval. The magnetic fluctuations are especially enhanced at C1 and C3 (black curves in Figures 2a, b) due to the spacecraft position being most of the time in the central plasma sheet. This is in contrast with magnetic fluctuations at TC-2 where the short active periods near 0933 and 0942 UT are separated by a rather quiet period.
Between 0932 and 0941 UT the C1 spacecraft observed continuous fast tailward bulk flow suggesting that the X-line was Earthward of X = -16 . Most of the time C4 was in the boundary plasma sheet and sporadically detected Earthward flows suggesting that the X-line, at least sporadically, could appear close to X = -16 (Figure 1a). Later on, between 0941 and 0943 UT, both C1 and C3 observe strong tailward flow reaching -1000 km/s. This can have different explanations, e.g. Earthward moving X-line, MR active in a different location or even a complex 3D geometry. The two vertical dashed lines in Figure 2 show the beginning of firstly observed multi-scale magnetic fluctuations by Cluster at 093145 UT (C2) and at 094030 UT (C1, C3). The associated beginnings of multi-scale magnetic fluctuations at TC-2 position are time-delayed by approximately 15-20 s. Though, full-scale substorms were not observed, the above time delays together with the observed auroral brightenings and injections of energetic particles to geostationary orbit indicate that, the activation events can be described in terms of the Near Earth Neutral Line (NENL) model (see Sergeev et al., this issue).
In summary, the length (horizontal dashed lines in Figure 2) and the beginnings and ends of multi-scale magnetic fluctuations at Cluster and TC-2 positions are different and the magnetic X-line(s) seems to be closer to the Cluster position (Figure 1a). Therefore, it is not a priori clear how to compare straightforwardly the spectral properties of fluctuations at the positions of Cluster and TC-2, or how long and which data intervals (physical processes) should be considered in intercomparison. Moreover, the physical processes in the plasma sheet are multi-scale and non-stationary [Vörös et al., 2006]. A possible solution for this problem is the estimation of spectral properties in sliding overlapping windows. The length of the sliding window has to be chosen according to the available length of - at least quasi-stationary - physical processes. Contrarily, to be able to estimate the spectral properties over multiple scales, should be as large as possible. Since magnetic data from Cluster and TC-2 are available with the same resolution (22 Hz), will be equal for all spacecraft. Obviously, cannot be larger than the lifetime of fluctuations we are interested in, e.g. the length of the first activation measured by TC-2 before 0933 UT is about 1 min. The second activation at TC-2 after 0941 UT shows visually a longer duration ( 3 min), but one cannot be sure if the process is really stationary during the whole activation interval. The multi-scale magnetic fluctuations e.g. at C1 or C3 after 0941 UT persist also a few minutes. Similar fluctuations in the central plasma sheet, however, are known to be driven by plasma bulk flows and those are bursty and time dependent [Baumjohann et al., 1990; Angelopoulos et al., 1992; Vörös et al., 2004a, b]. For example, the bulk flows exhibit -1000 km/s speed no longer than a minute around 0942 UT, then the speed is decreasing (Figure 2c). Therefore, we choose 30 s and shift the window by 2 s along the time series after each calculation step.
Within each analyzing window the spectral scaling parameters and in the relation are estimated, using a wavelet technique proposed by Abry et al., [2000], where is the frequency, represents the scaling index and is a nonzero magnitude parameter. The method was adapted for the analysis of plasma sheet turbulence by Vörös et al. [2004b]. Here, we recall only the main steps of the wavelet technique. First, a discrete wavelet transform of the data is performed over a dyadic grid and . Then, at each octave , the variance of the discrete wavelet coefficients is computed through , where is the number of coefficients at octave . Finally, is estimated by constructing a plot of versus (logscale diagram) and by using a weighted linear regression over the region where is a straight line. represents the intercept of that line with and has the dimension of variance ( in our case).
Having the window and the resolution fixed, the scaling properties of fluctuations can only be studied over the time scales of 0.1 - 5 s (0.2 - 10 Hz) (with 95% confidence). We consider that, magnetic fluctuations are statistically stationary only if the estimated spectral characteristics are similar at least over 2 window length (2W = 1 minute), consisting 30 analyzing windows having the step of 2 s. Physical processes with shorter duration than 2W cannot be resolved by this method and the sliding window analysis produces fluctuating estimates of and , usually underestimating . The estimations are also influenced by the 4 s spin tone. This effect was partially reduced by careful calibration and by examination of time scales below 4 s.
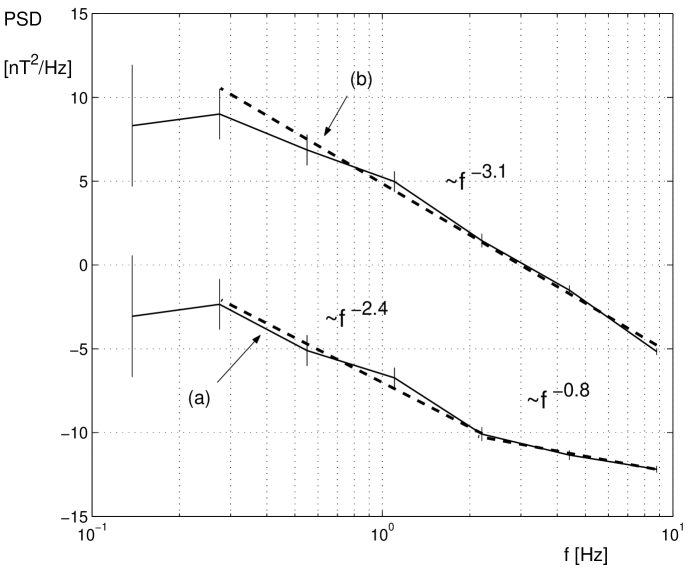
First, we demonstrate, how multi-scale fluctuations behave over two nearby scales during active and quiet periods. For comparison with the more standard Fourier approach we transformed the wavelet based scales into the approximate Fourier frequencies. The relationship between wavelet scales and Fourier frequencies can be derived by finding the wavelet transform of a pure cosine wave with a known Fourier frequency (e.g. [Torrence and Compo, 1998]). Figure 3 shows the comparison of power spectra estimated from TC-2 data during a quiet interval (interval (a): the analyzing window W is centered at 0931 UT, see Figure 2d) and during reconnection associated fluctuations (interval (b): W is centered at the first activation before 0933 UT). During the quiet period (interval (a)) two neighbouring frequency ranges 0.3 - 2 Hz (larger scale) and 2 - 8 Hz (smaller scale) show scalings with different scaling exponents. However, no spectral break is observed over the same frequency ranges during reconnection associated magnetic fluctuations (interval (b)) and the power of the fluctuations is larger than during the quiet period. It indicates that developed multi-scale fluctuations are present, driven by the reconnection outflow.
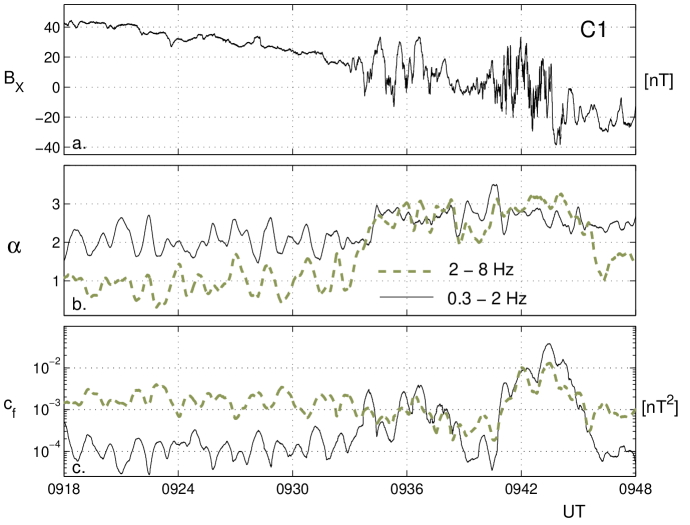
Figure 4 demonstrates the sliding window estimation of scaling parameters (Figure 4b) and (Figure 4c) for magnetic field components from C1 (Figure 4a). A longer interval between 0918 and 0948 UT is shown to see the difference between quiet and active periods. Again, both scaling parameters are estimated over the two neighbouring frequency ranges 0.3 - 2 Hz (larger scale, continuous black curves) and 2 - 8 Hz (smaller scale, dashed grey curves). When magnetic fluctuations are rare or absent (0918 - 0933 UT) the scaling parameters are fluctuating near the noise level and the difference of estimations between neighbouring scales is large. Between 0933 and 0938 UT only the large-scale power is enhanced over the noise level, when exhibits low-frequency flapping-like motion almost without higher-frequency activity. Between 0941 and 0945 the burst plasma flow related multi-scale magnetic fluctuations lead to enhanced power and closer scaling index estimations over both frequency ranges. It indicates again that multi-scale flow-driven turbulent fluctuations are present (see further details in Vörös et al. [2004b, 2006]).
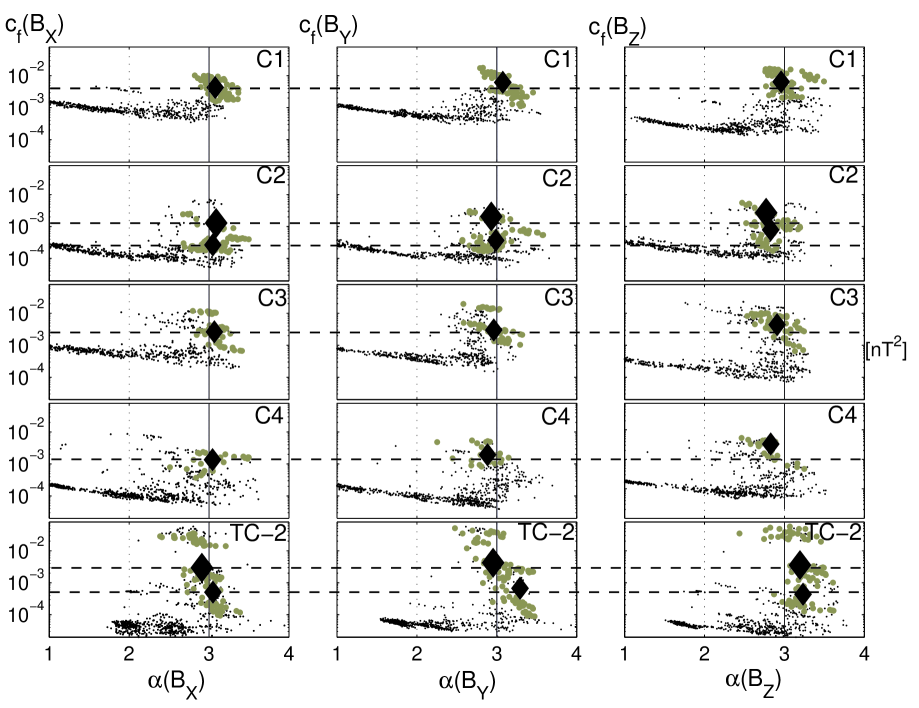
Figure 5 shows the scatter plots of vs. , computed over frequency range 0.3 - 8 Hz, for all magnetic components (i= X, Y, Z). The top three rows contain Cluster and the bottom row TC-2 spectral estimations. Three populations of data points are well discernible. The majority of small black points showing large spread in with the smallest powers organized into a narrow arm-like structures correspond to noise. As it was already mentioned in two-scale analysis, no activity or scale-restricted fluctuations results in noisy or/and small power estimations. The larger grey points with higher powers concentrating between (2.5-3.5) correspond to multi-scale fluctuations/turbulence. The remaining black point populations are due to noisy transients, short duration events, etc. The black diamonds show the medians of grey point distributions (multi-scale turbulence). C2 and TC-2 spacecraft data contain 2 periods with multi-scale turbulence resulting in two distributions of grey points and two median values. The larger diamonds denote later time intervals. We will not analyze the differences between the different activation periods because the corresponding grey point distributions are overlapping (no additional color needed). Instead, we will concentrate on more pronounced differences between Cluster and TC-2 magnetic fluctuations.
To allow better comparisons between the spectral parameters for each magnetic component and spacecraft, 3 vertical lines are drawn at . The dashed horizontal lines are centered at median values (black diamonds) for components (in first column of Figure 5). For and components the median values of scaling indices are rather similar, near for all spacecraft. The median values of are systematically below 3 for Cluster and over 3 for TC-2 components. This component dependent difference in can be explained by stronger , namely more dipolar field at the position of TC-2 and by peculiarities of the interaction of plasma flows with the dipolar field. For Cluster data (top four rows in Figure 5), the median values of powers associated with multi-scale fluctuations (black diamonds) show a weak but consistent increase when going from to and . At the same time the corresponding scaling indices change from 3.1 to 2.9. This corresponds to variance anisotropy in plasma sheet turbulence where perpendicular variances relative to the mean magnetic field are larger than the parallel one [Vörös et al., 2004b]. In Cluster position the variances are increased in the GSM Y, Z components, because the mean field direction is roughly in GSM X direction in a stretched plasma sheet. Variance anisotropy occurs in compressible MHD, but the controlling factor is mainly the plasma and not the proximity to the incompressible state [Matthaeus et al., 1996]. It is also known from 3D MHD simulations of turbulence that, for variance anisotropy is significant, however, over the anisotropy disappears [Matthaeus et al., 1996]. The power of compressional fluctuations over MHD scales is known to be larger than the power of right-hand and left-hand polarized waves in the near-Earth plasma sheet [Volwerk et al., 2004]. More importantly, plasma varied between 1 and 10 during the activation periods, which can explain the appearance of variance anisotropy at the position of Cluster spacecraft.
The spread around the median powers (larger grey points) is much larger at the position of TC-2 than of Cluster. The maximum values of powers are close to at TC-2 for all magnetic components. As described above, TC-2 is in the plasma sheet during the activations, presumably crossing regions with plasma , but still in a region with favorable conditions for the occurrence of variance anisotropy (plasma certainly will not approach 40). Nevertheless, variance anisotropy is not observed at the position of TC-2 (bottom row in Figure 5). This may indicate that the magnetic fluctuations over the considered scales might be driven by different physical processes at Cluster and TC-2 positions. In order to investigate further this possibility we will analyze the anisotropy of fluctuations in wave number space. In the presence of sufficiently strong mean magnetic field () scale-dependent spectral anisotropy in wave vector space is dynamically and robustly generated in MHD cascading turbulence [Shebalin et al. [1983]]. This offers the possibility to compare the expected mean field influenced spectral properties of MHD turbulence with the observed multi-spacecraft data. We note, that the variance anisotropy is not necessarily the same as the anisotropy in wave vector space, because there is no full correspondence between the most energetic wave vectors and the minimum variance directions [Matthaeus et al., 1996].
3 Scale-dependent anisotropy
Shebalin et al. [1983] studied incompressible MHD anisotropies arising in wave vector space in the presence of a mean magnetic field. They studied the interaction of opposite-traveling wave packets and found that in wave vector space, those interactions produce modes with wave vectors preferentially perpendicular to the mean magnetic field. Goldreich and Sridhar [1995] proposed a balance condition between parallel and perpendicular modes (parallel-propagating Alfven waves and perpendicular eddy motions). On this basis it was shown that a scale-dependent anisotropy appears, namely (or , where is the characteristic scale of eddies in parallel and perpendicular directions), which means that the anisotropy is increasing with decreasing scale.
As a quantitative measure of spectral anisotropy, it is convenient to use the anisotropy angles, introduced by Shebalin et al. [1983]
| (1) |
To isotropic fluctuations corresponds , purely parallel (slab) fluctuations exhibit , and fully perpendicular (2D) fluctuations results in . Now, the question is how to make measurements in the wave vector space?
Based on four-point Cluster measurements the so-called k-filtering technique was proposed to estimate the magnetic field energy distribution in both the angular frequency and wave vector spaces [Sahraoui et al., 2003]. In our case, this technique cannot be used, because there are no four identical spacecraft at the position of TC-2. Also, the Cluster spacecraft are frequently merged into different physical regions in the dynamical magnetotail [Vörös et al., 2007a], the k-filtering technique, however, assumes homogeneous and stationary wave-fields in space.
Oughton et al. [1998] presented a simple model for the scaling of the anisotropy as a function of the fluctuating magnetic field over the local mean magnetic field . On the basis of theoretical arguments and numerical simulations they have shown that the anisotropy angle can be estimated from the relationship
| (2) |
we use the values and obtained from Figure 3 in [Oughton et al., 1998]. Both and can change with Mach number and Reynolds number, but small changes of these numbers do not influence significantly our results. We note that by using the above relationship the anisotropy angle defined in the Fourier space can be estimated in the time-domain. It was also shown that the approximate relationship is valid only for some intermediate values
| (3) |
For the estimation of we used the same sliding window technique as above. The mean magnetic field is and stands for averaging over the window . The fluctuations were obtained within each through . The time-scale in this time-domain analysis is represented by . We note, that the mean magnetic field within the windows W was always different from zero, even if locally nT can occur (e.g. at Cluster around 0942 UT, Figure 2). One can perform sliding window analysis estimating for different (different scales) keeping the time shift unchanged. Interestingly, when multi-scale fluctuations were absent the ratio indicating that has no physical meaning during quiet periods (not shown). For proper steady estimations of similar values of were required at least over 2 window length.
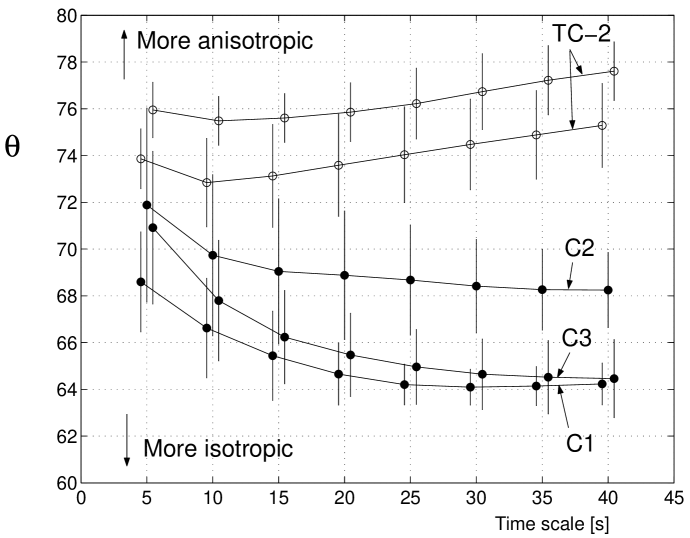
Out of seven data intervals of multi-scale fluctuations (horizontal dashed lines in Figure 2 and diamonds in Figure 5), three data intervals from Cluster and two data intervals from TC-2 were found for which could be estimated according to Equations 2 and 3. During the remaining two intervals at TC-2 and C4 near 0942 UT, the estimations of were not stationary enough. Figure 6 shows the scale dependence of estimated anisotropy angles . The error bars represent standard deviations. Turbulence at the position of Cluster exhibits scale-dependent anisotropy. The anisotropy angle is increasing towards small scales, but below the time scale of 10-15 s the anisotropy angle is almost the same for TC-2 and Cluster spacecraft. At the TC-2 position the fluctuations are more anisotropic, but almost scale independent, exhibiting a weak increase towards larger time scales.
Both variance anisotropy and scale-dependent anisotropy in wave vector space seem to confirm the above supposition that the multi-scale magnetic fluctuations at the positions of Cluster and TC-2 spacecraft are different.
4 Conclusions
In this paper magnetic fluctuations at Cluster and Double Star were compared using spectral and time-domain methods. The comparison is facilitated because of the magnetometers with similar technical parameters on these spacecrafts [Balogh et al. 2001; Carr et al. 2005].
The spectral power increased during the periods of multi-scale fluctuations. The power of fluctuations over frequency range 0.3 - 8 Hz are 1-2 orders of magnitude above the quiet time periods at Cluster positions (14-16 , Figures 4, 5). This is an established feature of bursty bulk flow associated magnetic fluctuations [e.g. Vörös et al., 2004b]. In fact, the multi-scale magnetic fluctuations at Cluster are all flow related (the five intervals labeled by horizontal dashed lines in Figures 1a, b). The ion data is not available from C2, but the GSM Z distance between C1 and C2 was only about 2000 km, C1 observed a tailward bulk flow and C2 was closer to the neutral sheet than C1. The plasma flow origin of magnetic fluctuations observed by Cluster after 0941 UT was demonstrated by Vörös et al. [2007a]. The power of fluctuations are 1-4 orders of magnitude above the quiet time periods at TC-2 position (, Figure 5, bottom panels). The TC-2 results can be compared with the Charge Composition Explorer (CCE) of the Active Magnetospheric Particle Tracer Explorer (AMPTE) observations of magnetic fluctuations in the pre-midnight and post-midnight sectors at radial locations of 7.4 - 8.8 . During current disruption events observed by AMPTE wave powers of 2-3 orders of magnitude above the pre-onset period were measured over the frequency ranges of 0.1 - 4 Hz [Lui et al., 1992]. The scaling index at AMPTE is changing between [Lui et al., 1992; Ohtani et al., 1995]. The spectral scaling index at TC-2 and Cluster spacecraft changed between , showing a small, presumably component related difference, but negligible between the events near 0933 and 0942 UT (small and large diamonds in Figure 3). Having in mind different magnetometers, noise levels and slightly different frequency ranges in TC-2 and AMPTE spacecraft, the estimated spectral parameters are rather close to each other. The differences in spectral parameters can also appear because of the different positions of spacecraft, observing fluctuations in regions with different plasma , proton gyroperiod [Ohtani et al., 1995] or boundary effects [e.g. Borovsky and Funsten, 2003]. Notice, that the observed spectral indices are different from the values of 3/2 or 5/3 which correspond to hydrodynamic or magnetohydrodynamic inertial range scalings, respectively. It was shown recently by Vörös et al. [2007b] that, the inertial range can be identified only when at least several minute long quasi-stationary plasma flows exist in the turbulent plasma sheet. For frequencies larger than the proton gyrofrequency (typically 0.1-0.4 Hz in our case), the spectrum steepens, exhibiting spectral indices near 3. This steepening cannot be caused by dissipation via kinetic wave damping, because it would result in a strong cutoff in the power spectra rather than a power law (Li et al., 2001). When the energy is not dissipated it has to be transferred further towards higher frequencies. The spectral energy transfer in the small-scale cascade might be controlled by other physical processes exhibiting different characteristic time scales than the inertial range magnetohydrodynamic turbulence. The physical mechanisms involved in the generation of this high frequency scaling range can be e.g. Hall physics related in the presence of dispersive effects [e.g. Alexandrova et al., 2007]. The small-scale cascade is intermittent [e.g. Alexandrova et al., 2007; Vörös et al., 2003, 2007], which indicates that intermittency is not restricted to the inertial range [Bruno and Carbone, 2005]. Numerical simulations of MHD turbulence show that neither the magnetic field anisotropy is restricted to the inertial range and the small scale cascade continues to be anisotropic [e.g. Cho et al., 2002].
These findings, in agreement with earlier results, indicate that fluctuations/turbulence exhibit different spectral characteristics in the tailward (Cluster)/Earthward (TC-2) reconnection outflow regions, substantiated further by the fact that the consequences of the same reconnection events are observed by very similar magnetometers. The fluctuations at Cluster and TC-2 positions might be driven by different physical processes, because the physical situations are different. Physically, in the tailward outflow region (Cluster) the strong plasma flow drives the magnetic field fluctuations, the latter representing a passive scalar field [Vörös et al., 2004a]. In the Earthward outflow region (TC-2) is stronger, the magnetic field is more dipolar, the leading processes are flow breaking [e.g., Shiokawa et al., 1997], dipolarization [e.g., Baumjohann et al., 1999] or tail current disruption [e.g., Lui et al., 1992]. Unlike the reconnection outflows at the magnetopause, Earthward - tailward plasma outflows are not symmetric in the tail. On the Earthward side the flows are more affected by the obstacle represented by the magnetic wall - a stronger near-Earth magnetic field. The reconnection outflow asymmetry in the plasma sheet has already been observed, e.g. in connection with slow-mode shocks and the Walén test [Eriksson et al., 2004].
In summary, the difference between plasma flow driven and stronger dipolar field dominated fluctuations is discernible in both variance and scale dependent spectral anisotropy features. There are favorable conditions in both locations for variance anisotropy, but it appears only at Cluster positions. Scale dependent anisotropy in wave-vector space is present also only at Cluster locations, though TC-2 observes a slightly larger anisotropy angles. Theory and simulations of magnetohydrodynamic cascading turbulence with magnetic field and not too high plasma predict both types of anisotropies. We can speculate that the lack of anisotropy in TC-2 location can be explained through: (a) magnetic fluctuations which are not associated by a turbulent cascade; for example currents can heat the plasma over small spatial scales, in which case substantial part of energy would not be transferred through a turbulent cascade; (b) magnetic fluctuations which are associated by a turbulent cascade, but without scale dependent anisotropy. The anisotropy level can be higher, but saturated because of turbulence ageing or/and mixing and flow breaking near the more dipolar field. As a matter of fact, the largest anisotropy angle at the Cluster position (which is closer to the reconnection site) is roughly the same as the average anisotropy angle at TC-2 position. In any case, flow breaking/mixing due to the near-Earth magnetic obstacle and the associated plasma/current instabilities can explain the lack of anisotropies at TC-2 position.
Acknowledgements.
The authors thank H. U. Eichelberger for great help in the data processing. The work by Z. Vörös was partially supported by the Grant Agency of the Academy of Sciences of the Czech Republic (Grant No.: B300420509). Part of the work by M. Volwerk was financially supported by the German Bundesministerium für Bildung und Forschung and the Zentrum für Luft- und Raumfahrt under contract 50 OC 0104.References
- [] Abry, P., P. Flandrin, M. S. Taqqu, and D. Veitch (2000), Wavelets for the analysis, estimation and synthesis of scaling data, in Self-Similar Network Traffic and Performance Evaluation, edited by K. Park and W. Willinger, p. 39, Wiley-Interscience.
- [] Alexandrova, O., V. Carbone, P. Veltri, and L. Sorriso-Valvo (2007), Solar wind Cluster observations: turbulent spectrum and role of Hall effect, Planet. Space Sci., doi:10.1016/j.pss.2007.05.022.
- [] Angelopoulos, V., W. Baumjohann, C. F. Kennel, F. V. Coroniti, M. G. Kivelson, R. Pellat, R. J. Walker, H. Lühr, and G. Paschmann (1992), Bursty bulk flows in the inner plasma sheet, J. Geophys. Res., 97, 4027–4039.
- [] Balogh, A., et al. (2001), The Cluster magnetic field investigation: Overview of in-flight performance and initial results, Ann. Geophys., 19, 1207–1217.
- [] Baumjohann, W., G. Paschmann, and H. Lühr (1990), Characteristics of high-speed ion flow in the plasma sheet, J. Geophys. Res., 95, 3801–3810.
- [] Baumjohann, W., M. Hesse, S. Kokubun, T. Mukai, T. Nagai, and A.A. Petrukovich (1999), Substorm dipolarization and recovery, J. Geophys. Res., 104, 24995-25000.
- [] Baumjohann, W., et al. (2007), Dynamics of thin current sheets: Cluster observations, Ann. Geophys., 25, 1365-1389. Bruno, R., and V. Carbone (2005), The solar wind as a turbulence laboratory, Living Rev. Solar Phys., 2, 1 186.
- [] Birn, J., and E.R. Priest (Eds.) (2007), Reconnection of magnetic fields, Cambridge University Press.
- [] Carr, C., et al. (2005), The Double Star magnetic field investigation: instrument design, performance and highlights of the first year’s observations, Ann. Geophys., 23, 2713–2732.
- [] Cho, J., A. Lazarian, and E.T. Vishniac (2002), New regime of magnetohydrodynamic turbulence: cascade below the viscous cutoff, Astrophys. J., 566, L49–L52.
- [] Eriksson, S., M. ieroset, D. N. Baker, C. Mouikis, A. Vaivads, M. W. Dunlop, H. Rème, R.E. Ergun, and A. Balogh (2004), Walén and slow-mode shock analyses in the near-Earth magnetotail in connection with a substorm onset on 27 August 2001, J. Geophys. Res., 109, A10212, doi:10.1029/2004JA010534.
- [] Goldreich, P., and S. Sridhar (1995), Toward a theory of interstellar turbulence, II. Strong Alfve nic turbulence, Astrophys. J., 438, 763–775, doi: 10.1086/175121.
- [] Lui, A.T.Y., et al. (1992), Current disruptions in the near-Earth neutral sheet region, J. Geophys. Res., 97, 1461–1480.
- [] Li, H., S. P. Gary, and O. Stawicki (2001), On the dissipation of magnetic fluctuations in the solar wind, Geophys. Res. Lett, 28, 1347–1350.
- [] Matthaeus, W. H., S. Ghosh, S. Oughton, and D.A. Roberts (1996), Anisotropic three-dimensional MHD turbulence, J. Geophys. Res., 101, 7619–7629.
- [] Nakamura, R., et al. (2004), Spatial scale of high-speed flows in the plasma sheet observed by Cluster, Geophys. Res. Lett, 31, L09804, doi:10.1029/2004GL019558.
- [] Nakamura, R., et al. (2005), Cluster and Double Star observation of dipolarization, Ann. Geophys., 23, 2915–2920.
- [] Nakamura, R., et al. (2006), Dynamics of thin current sheets associated with magnetotail reconnection, J. Geophys. Res., 111, A11206, doi:10.1029/2006JA011706.
- [] Ohtani, S., T. Higuchi, A. T. Y. Lui, and K. Takahashi (1995), Magnetic fluctuations associated with tail current disruption: Fractal analysis, J. Geophys. Res., 100, 19135–19145.
- [] Oughton, S., W. H. Matthaeus, and S. Ghosh (1998), Scaling of spectral anisotropy with magnetic field strength in decaying magnetohydrodynamic turbulence, Phys. Plasmas, 5, 4235–4242.
- [] Rème, H., et al. (2001), First multispacecraft ion measurements in and near the Earths magnetosphere with the identical Cluster ion spectrometry (CIS) experiment, Ann. Geophys., 19, 1303–1354.
- [] Runov, A., et al. (2003), Current sheet structure near magnetic X-line observed by Cluster, Geophys. Res. Lett, 30(11), 1579, doi:10.1029/2002GL016730.
- [] Sahraoui, F., et al. (2003), ULF wave identification in the magnetosheath: The k-filtering technique applied to Cluster II data, J. Geophys. Res., 108(A9), 1335, doi:10.1029/2002JA009587.
- [] Sergeev, V., et al. (2007), Observation of repeated intense near-Earth reconnection on closed field lines with Cluster, Double Star and other spacecraft, Geophys. Res. Lett., 34, L02103, doi:10.1029/2006GL028452.
- [] Sergeev, V., et al. (2007), Study of near-Earth reconnection events with Cluster and Double Star, J. Geophys. Res. , (this issue).
- [] Shebalin, J. V., W. H. Matthaeus, and D. C. Montgomery (1983), Anisotropy in MHD turbulence due to a mean magnetic field, J. Plasma Phys., 29, 525–547.
- [] Shiokawa, K., W. Baumjohann, and G. Haerendel (1997), Braking of high-speed flows in the near-Earth tail, Geophys. Res. Lett., 24, 1179-1182.
- [] Takada, T., R. Nakamura, W. Baumjohann, Y. Asano, M. Volwerk, T.L. Zhang, B. Klecker, H. Rème, E.A. Lucek, and C. Carr (2006), Do BBFs contribute to inner magnetosphere dipolarizations: Concurrent Cluster and Double Star observations, Geophys. Res. Lett., 33, L21109, doi:10.1029/2006GL027440.
- [] Torrence, Ch., and G.P. Compo (1998), A practical guide to wavelet analysis, Bull. Amer. Meteorol. Soc., 79, 61–78.
- [] Volwerk, M., et al. (2004), Compressional waves in the Earth’s neutral sheet, Ann. Geophys., 22, 303–315.
- [] Volwerk, M., et al. (2005), Plasma Flow channels with ULF waves observed by Cluster and Double Star, Ann. Geophys., 23, 2929–2935.
- [] Volwerk, M., K.H. Glassmeier, R. Nakamura, T. Takada, W. Baumjohann, B. Klecker, H. R me, T.L. Zhang, E. Lucek, and C. Carr (2007), Flow burst-induced Kelvin-Helmholtz waves in the terrestrial magnetotail, Geophys. Res. Lett., 34, L10102, doi:10.1029/ 2007GL029459.
- [] Vörös, Z., et al. (2003), Multi-scale magnetic field intermittence in the plasma sheet, Ann. Geophys., 21, 1955–1964.
- [] Vörös, Z., W. Baumjohann. R. Nakamura, A. Runov, M. Volwerk, T.L. Zhang, and A. Balogh (2004a), Wavelet analysis of magnetic turbulence in the Earth’s plasma sheet, Phys. Plasmas, 111, 1333–1338, doi:10.1063/1.1667499.
- [] Vörös, Z., et al. (2004b), Magnetic turbulence in the plasma sheet, J. Geophys. Res., 109, A11215, doi:10.1029/2004JA010404.
- [] Vörös, Z., W. Baumjohann, R. Nakamura, M. Volwerk, and A. Runov (2006), Bursty bulk flow driven turbulence in the Earth’s plasma sheet, Space Sci. Rev., 122, 301–311 doi:10.1007/s11214-006-6987-7.
- [] Vörös, Z., W. Baumjohann, R. Nakamura, A. Runov, M. Volwerk, T. Takada, E.A. Lucek, and H. Rème (2007a), Spatial structure of plasma flow associated turbulence in the Earth’s plasma sheet, Ann. Geophys., 25, 13–17.
- [] Vörös, Z., W. Baumjohann, R. Nakamura, A. Runov, M. Volwerk, Y. Asano, D. Jankovičová, E.A. Lucek, and H. Rème (2007b), Spectral scaling in the turbulent Earth’s plasma sheet revisited, Nonlin. Proc. Geophys., 14, 535–541.
- [] Zhang, T. L., et al. (2005), Double Star/Cluster observation of neutral sheet oscillations on 5 August 2004, Ann. Geophys., 23, 2909–2914.