Uniting Old Stellar Systems: From Globular Clusters to Giant Ellipticals
Abstract
Elliptical galaxies and globular clusters (GCs) have traditionally been regarded as physically distinct entities due to their discontinuous distribution in key scaling diagrams involving size, luminosity and velocity dispersion. Recently this distinctness has been challenged by the discovery of stellar systems with mass intermediate between those of GCs and dwarf ellipticals (such as Ultra Compact Dwarfs and Dwarf Galaxy Transition Objects). Here we examine the relationship between the virial and stellar mass for a range of old stellar systems, from GCs to giant ellipticals, and including such Intermediate Mass Objects (IMOs). Improvements on previous work in this area include the use of (i) near-infrared magnitudes from the 2MASS survey, (ii) aperture corrections to velocity dispersions, (iii) homogeneous half light radii and (iv) accounting for the effects of non-homology in galaxies. We find a virial-to-stellar mass relation that ranges from 104 M⊙ systems (GCs) to 1011 M⊙ systems (elliptical galaxies). The lack of measured velocity dispersions for dwarf ellipticals with –16 MK –18 (108 M⊙) currently inhibits our ability to determine how, or indeed if, these galaxies connect continuously with GCs in terms of their virial-to-stellar mass ratios. We find elliptical galaxies to have roughly equal fractions of dark and stellar matter within a virial radius; only in the most massive (greater than 1011 M⊙) ellipticals does dark matter dominate the virial mass. Although the IMOs reveal slightly higher virial-to-stellar mass ratios than lower mass GCs, this may simply reflect our limited understanding of their IMF (and hence their stellar mass-to-light ratios) or structural properties. We argue that most of these intermediate mass objects have similar properties to massive GCs, i.e. IMOs are essentially massive star clusters. Only the dwarf spheroidal galaxies exhibit behaviour notably distinct from the other stellar systems examined here, i.e. they display a strongly increasing virial-to-stellar mass ratio (equivalent to higher dark matter fractions) with decreasing stellar mass. The data used in this study is available in electronic format.
1 Introduction
The scalings between basic parameters such as the size, luminosity or surface brightness, and line-of-sight velocity dispersion of stellar systems have provided a key tool in which to understand self-gravitating systems. When viewed as a 3 parameter space, they are collectively know as the Fundamental Plane (Djorgovski & Davis (1987)). Such scaling relations have been used to probe the structural properties, origin, and even to classify objects depending on where they lie in parameter space. The scalings in ‘-space’ (with axes related to mass, mass-to-light ratio and surface brightness) of dynamically hot galaxies were explored by Bender et al. (1992). These hot systems included elliptical, dwarf spheroidal and the bulges of spiral galaxies. Burstein et al. (1997) extended the -space analysis to include disk galaxies, groups and clusters of galaxies and globular clusters (GCs). More recently, Zaritsky et al. (2006) defined the Fundamental Manifold of spheroids revealing a continuity from clusters of galaxies to dwarf ellipticals, and possible extension to dwarf spheroidals.
Like elliptical galaxies, GCs are self-gravitating systems with a strong component of pressure support from the random motions of their stars (i.e. they are dynamically hot) and are dominated by stars of old age (i.e. older than 10 Gyrs). However, they were either excluded from past studies (e.g. Bender et al. (1992); Zaritsky et al. (2006)) or found to be distinct entities based on their different scalings and large separation in mass from galaxies (e.g. Kormendy (1985); Burstein et al. (1997)).
Only in the last decade have objects of mass intermediate between those of massive GCs and dwarf ellipticals been discovered (Hilker et al. (1999); Drinkwater et al. (2000)). These objects have masses of 107 M⊙ and relatively compact sizes with measured half light radii of 50 pc. They are usually referred to as Ultra Compact Dwarfs (UCDs) or Dwarf Globular Transition Objects (DGTOs). Although they share many properties with the nuclei of nucleated dwarf galaxies (e.g. Geha et al. (2003); Côté et al. (2006); Böker (2008)) they also resemble massive GCs (e.g. Kissler-Patig et al. (2006); Haşegan et al. (2005); Hilker et al. (2007); Gilmore et al. (2007)). A number of papers have proposed various possible mechanisms to explain such intermediate mass objects (IMOs; we prefer this terminology as it describes their physical state and not their uncertain origin). These include the remnant nucleus of a stripped dwarf galaxy (Drinkwater et al. (2003); Bekki et al. (2003)), the merger of several smaller GCs (Fellhauer & Kroupa (2002); Bekki et al. (2004)), a completely new type of galaxy (Drinkwater et al. (2000)) or an extension of the GC sequence to higher masses (Mieske et al. (2002)). However, each of these possible explanations has difficulties (e.g. Goerdt et al. (2008); Evstigneeva et al. (2008)).
A number of authors have examined the scaling relations of IMOs, sometimes including GCs and galaxies in their analysis (Martini & Ho (2004); Haşegan et al. (2005); Evstigneeva et al. (2007); Hilker et al. (2007)). A recent work in this fast moving field is that of Dabringhausen et al. (2008) (hereafter D08) who include GCs and giant ellipticals, but focus on IMOs and dwarf galaxies. They confirm a transition in globular cluster and IMO properties (to larger sizes, higher stellar densities and higher inferred mass-to-light ratios) at a mass of 106 M⊙. They interpret this as either as evidence for dark matter or a different initial mass function (IMF) in these somewhat higher mass objects. D08 also included dwarf spheroidal (dSph) galaxies in their analysis. These galaxies have similar velocity dispersions to globular clusters but very high inferred mass-to-light ratios. Debate continues whether these high ratios are due to tidal heating or large dark matter halos (see for example Penarrubia et al. (2008) and Metz et al. (2008)), and how such galaxies fit into the general scaling relations.
After submission of our paper to the journal, the work of Mieske et al. (2008) was made publicly available. This work discusses the nature of UCDs focusing on their internal dynamics and re-examining various UCD scaling relations. In the appropriate sections of this paper we comment on the Mieske et al. (2008) results. In general, they reach similar conclusions to us.
Here we focus on the relationship between virial and stellar
mass for a wide mass range of old, pressure-supported systems. In
particular, we examine elliptical galaxies and globular clusters along
with IMOs and dwarf spheroidals. In general,
such systems contain little, if any, cold or hot gas and so
the stellar mass is a good proxy for the baryonic mass in these
systems. They are usually dominated, in mass, by old stellar populations.
We also apply
several improvements on previous work through the use of:
(i) near-infrared magnitudes which are a much better
tracer of stellar mass than optical light;
(ii) aperture corrections to the literature velocity dispersions
of unresolved GCs and IMOs to reflect central values;
(iii) half light radii that account for the deviations in galaxy
light profiles from the simple R1/4 law;
and
(iv) variations to the calculated virial mass for non-homology
effects between galaxies.
In Section 2, we describe the physical parameters which we use, while Section 3 lists the data samples (which are given in Table 1 and available fully in electronic form). Section 4 presents the scaling relations of both velocity dispersion and radius with near-infrared luminosity before examining the virial versus stellar mass relation. Finally, in Section 5, we highlight prospects for future work and give our conclusions.
2 Data Parameters
2.1 Velocity Dispersions
Luminosity-weighted central velocity dispersions () from the literature have been used for spatially resolved objects, such as Galactic GCs and elliptical galaxies. However for extragalactic IMOs and GCs in the nearby galaxies M31 and NGC 5128, spatially resolved velocity dispersion profiles are generally not available and hence aperture measurements are quoted in the literature. Assuming that the velocity dispersion profiles follow the same form as those observed for Milky Way GCs, then can be estimated following the prescription given by Djorgovski et al. (1997). Thus unless central values are quoted for IMOs and unresolved GCs in nearby galaxies we assume a 10 percent increase in the literature aperture velocity dispersion. This corresponds to a 20 percent, or 0.08 dex, increase in log mass. When corrections have been applied this is noted in Table 1.
A more sophisicated approach to the aperture corrections of velocity dispersion measures were made by Mieske et al. (2008). Their corrections, based on mass modelling, for the NGC 5128 GCs range from about 7% to 21%, with an average of 15%. If our corrections are systematically too low by 5% this will cause the central velocity dispersion to be underestimated by 0.02 dex and 0.04 dex in mass. Such small effects have no effect on our conclusions.
2.2 Near-Infrared Magnitudes
Rather than use optical luminosities as done by most previous studies (including D08), we use the Ktotal 2.2 micron near-infrared magnitudes from the homogeneous 2MASS survey (Jarrett et al. (2003)). This has several advantages: it is a better tracer of the underlying mass as it is less influenced by young, blue stars; it significantly reduces the influence of dust reddening; and it reduces the sensitivity to metallicity variations from low to high mass objects (this is important when calculating stellar masses). K-band magnitudes are not corrected for Galactic extinction as the corrections are generally negligible. The main disadvantage of the K-band is that fewer objects are available for analysis.
Our sample of elliptical galaxies (described in Section 3) all have total K-band magnitudes available from the 2MASS survey. A large subset of our galaxy sample also have total B magnitudes available from NED. This allows us to derive a new B–K colour-magnitude relation for elliptical galaxies down to faint magnitudes, with the caveat that NED photometry is very inhomogeneous.
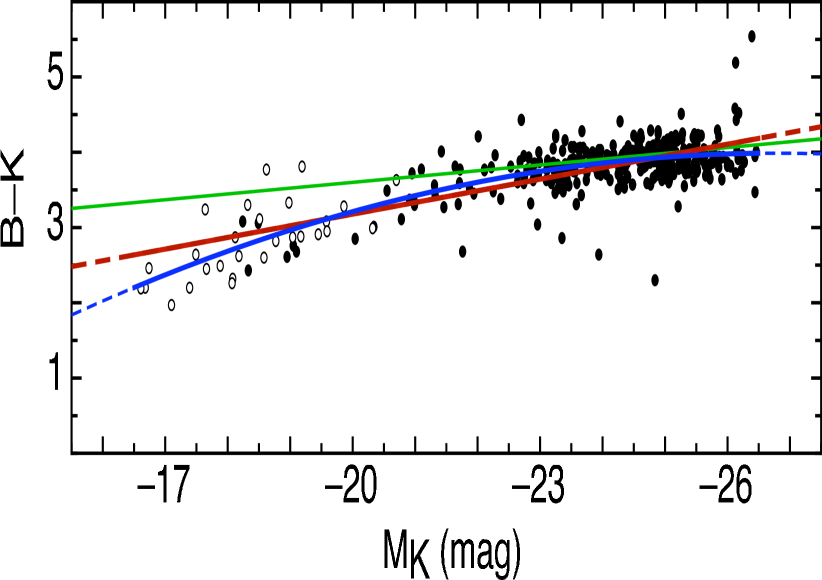
In Figure 1 we show the B–K colour magnitude relation for our elliptical galaxy sample, together with additional data from Binggeli & Jerjen (1998) who provide B-band photometry for a large sample of dwarf ellipticals in the Virgo cluster. Magnitudes in the K-band for the Binggeli & Jerjen sample are taken from 2MASS. In a study of Coma cluster ellipticals, Mobasher et al. (1986) report a linear fit to the B–K colour-magnitude relation for their sample (which is plotted as the upper green line in Figure 1). Whilst this fits well at the bright end, it appears to overestimate the colours for the dwarf elliptical galaxies. We have fit both a linear and quadratic function to the data in Figure 1. They are:
| (1) | ||||
| (2) |
The fits are statistically similar with a chi-squared of 32.6 and 29.2 for the linear and quadratic fits respectively. In this work we have somewhat arbitrarily chosen to use our linear rather than quadratic fit to the colour-magnitude relation. Although the difference between the fits can be as large as 0.5 mag. at MK = –16 mag., the bulk of the data used in this paper (shown as filled circles in Figure 1) have MK –20 and hence the difference between our linear and quadratic fit is insignificant for our purposes.
2.3 Half Light Radii
For GCs and IMOs we use the half light radii as quoted in the original data source (see Section 3 for details). For galaxies however, we use the 2MASS survey to obtain half light radii. The 2MASS survey calculates an R20 size which is the major-axis radius of the K-band 20th mag. arcsec-2 isophote (Jarrett et al. (2000)). We convert this into a half light radius (Rh) using an empirical relation based on Sérsic light profiles, which we verify for a small sample of galaxies that have both R20 and Rh (from Sérsic fits to the light profiles) independently available.
The Sérsic profile is given by
| (3) |
where is the central surface brightness, is the Sérsic shape parameter and , for 0.5 10. Substituting into equation (3) and allowing for the effect of the ellipticity gives
| (4) |
where specifies the central surface brightness in the K-band and Rh is the geometric-mean half light radius rather than the major-axis half light radius. Thus equation (4) provides an analytic relation, based on the Sérsic profile, for converting R20 into Rh.
To apply equation (4) to our galaxy dataset we use the empirical relations between the Sérsic index and central surface brightness with galaxy magnitude. Graham & Guzmán (2003) provide an empirical relation for the B-band absolute magnitude as a function of , such that
| (5) |
and an empirical relation between the central surface brightness and the absolute magnitude, such that
| (6) |
To convert equations (5) and (6) into K-band magnitudes we use the B–K colour-magnitude relation (given in equation 1). However, when applying colours to the central surface brightness, a correction is required due to any colour gradients that may exist. Michard (2005) discuss this in some detail, and a simple analysis indicates
| (7) |
Equations (4-7) give an empirical relation for converting to
| (8) |
where the Sérsic shape parameter is given by
| (9) |
We note that for elliptical galaxies the Sérsic index does not vary between the B and R-bands (Graham et al. (2007)) and we have assumed no variation between the B and K-bands. Thus, equation 8 together with equations 1 and 9, allows one to convert the 2MASS R20 radii into half light radii using only the 2MASS K-band magnitude and the galaxy ellipticity.
To test the above procedure we use the data from Caon et al. (1993), D’Onofrio et al. (1994) and Binggeli & Jerjen (1998), who provide a sample of elliptical galaxies with measured half light radii, B-band absolute magnitudes, ellipticities and surface brightnesses. We take R20 and the K-band apparent magnitudes from 2MASS for this sample of galaxies and use equation 1 to calculate their B–K colours. This dataset allows us to compare the observationally-derived Rh with the expected value according to the discussion above. These differences, normalised by the observed Rh value, are shown in Figure 2. The distribution shows large scatter, with little systematic trend, except perhaps at low luminosities when our predicted half light radii tend to be underestimated by 40%. The implications of this are discussed in section 4.2.
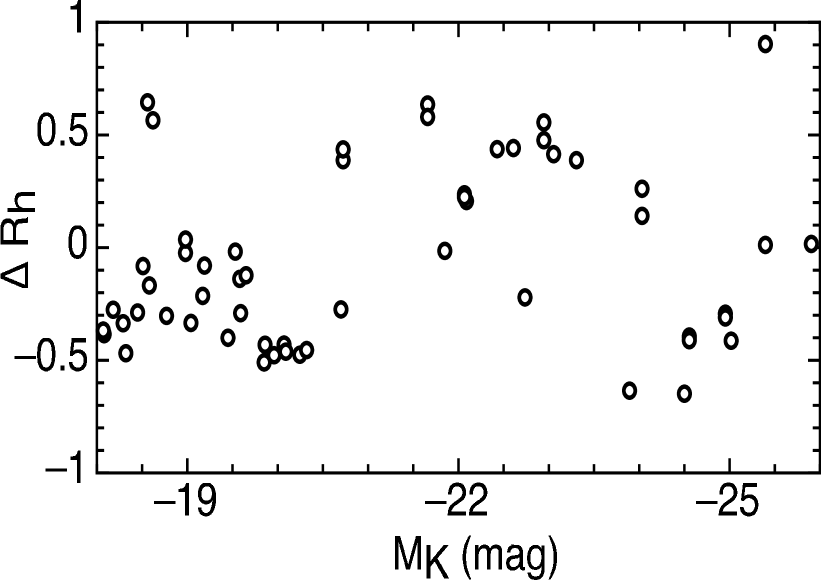
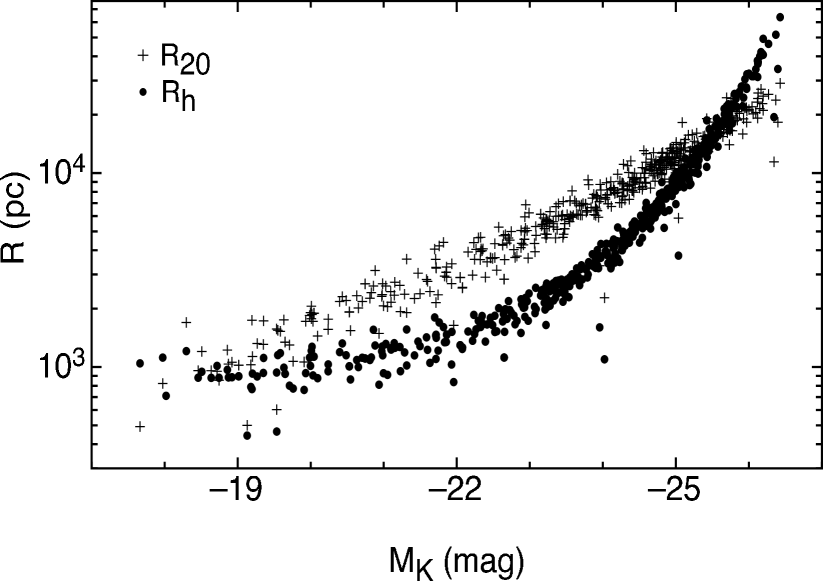
Figure 3 shows the effect on the size-luminosity relation for elliptical galaxies of converting 2MASS R20 major-axis radii into Rh geometric-mean radii. Our procedure modifies the nearly straight relation between R20 and magnitude to the curved trend seen in Figure 3 and reduces the scatter (the latter due to the conversion from major-axis to geometric radii). The curved relation is consistent with that reported by Graham & Worley (2008) who did not convert from 2MASS R20 radii but used measured half light radii directly from Sérsic law fits to light profiles. We note that recent high resolution imaging with the Advanced Camera for Surveys on HST of early-type Virgo cluster galaxies confirms that their surface brightness profiles are well fit by Sérsic laws over a large range in galaxy luminosity (Ferrarese et al. (2006)).
We note that the error in log Rh, and hence log mass, from assuming an R1/4 law for all galaxies can be up to a factor of 5–10 at the extreme low and high mass ends of the galaxy sequence (see Trujillo et al. (2001)). Thus studies that assume R1/4 law fits for all elliptical galaxies can be subject to large systematic errors depending on the mass range explored.
3 Data Samples
Here we briefly mention the literature data samples which we have used, in rough order of increasing mass, and if any specific corrections have been applied. We note that the classification of objects below is naturally somewhat arbitrary. Half light radii, in arcseconds, have been transformed into physical radii and apparent magnitudes into absolute ones, using distances from the original literature source for Milky Way and local volume (within 10 Mpc) objects. For more distant galaxies we use the cosmic microwave background corrected distance with H0 = 73 km s-1 Mpc-1 from NED. A full compilation of the object names, distances, half light radii, velocity dispersions and K-band magnitudes for our sample is available electronically (see Table 1).
3.1 Milky Way and M31 Globular Clusters
Central velocity dispersion measurements are taken from McLaughlin & van der Marel (2005) and Barmby et al. (2007) and references therein. For the Milky Way GCs, no aperture correction is required and we simply take the quoted central values. However for M31, at a distance of 780 kpc (Barmby et al. (2007)), a 1 arcsec slit corresponds to 3-4 pc (a typical GC half light radius) and so we increase the measured velocity dispersions by 10% as described in Section 2.1. Effective half light radii and distances for the Milky Way GCs come from the Harris (1996) catalog. Half light radii for M31 GCs are taken from Barmby et al. (2007). For M31 GCs the K-band magnitudes are taken directly from 2MASS. For the Milky Way GCs we use the V–K colours of Cohen et al. (2007), which is based on 2MASS data and the total extinction corrected V-band magnitudes of Harris (1996).
Our sample includes the Milky Way globular cluster NGC 2419. This is a very luminous, extended GC located in the Galaxy outer regions. Otherwise it appears to be a normal GC with no evidence of multiple stellar populations (Ripepi et al. (2007)). We also include 037-B327 located in M31. Although heavily extincted, Cohen (2006) argues this is a normal GC, albeit a massive one with a velocity dispersion of 20 km s-1.
3.2 Milky Way and M31 Possible Dwarf Galaxy Nuclei
Omega Centauri
Omega Centauri is the most
luminous GC in the Galaxy. It reveals evidence for multiple
age and metallicity stellar
populations and has been suggested as the remnant nucleus of a
stripped dwarf galaxy (e.g. Hilker &
Richtler (2000)). Here we use
V–K = 2.27 based on
the empirical metallicity vs V–K relation of Cohen et al. (2007) to
calculate the K-band magnitude.
M54
This object is traditionally classified as
a globular cluster but is also identified as the nucleus of the
accreted Sagittarius dwarf galaxy and has multiple stellar populations (Siegel
et al. (2007)).
NGC 2808
Normally classified as a GC, NGC 2808 may be the remnant nucleus of the
Canis Major dwarf galaxy (Forbes
et al. (2004)) and it reveals multiple stellar
populations (Piotto et al. (2007)).
G1
This massive star cluster in M31 has also been suggested
as the remnant nucleus of a stripped dwarf galaxy and reveals evidence
for multiple metallicity populations (Meylan et al. (2001)). We have taken
the aperture velocity dispersion for G1 from
Djorgovski et al. (1997), and corrected it following Section 2.1 to
give 27.6 km s-1. In this case, a comparison can be made to
the value from an HST/STIS measurement by
Gebhardt
et al. (2005) who derived a central velocity dispersion of
31.1 1.7 km s-1.
3.3 NGC 5128 Massive Globular Clusters
The velocity dispersions and half light radii for massive GCs around NGC 5128 are taken from Martini & Ho (2004) and Rejkuba et al. (2007) assuming a distance of 3.9 Mpc. Both of these studies quote aperture velocity dispersions which we correct to a central value following Section 2.1. Of the GCs in Rejkuba et al. (2007), those labelled HGHH92 (Harris et al. (1992)) do not contain K-band measurements in 2MASS. We therefore used the total V-band magnitude given in Rejkuba et al. (2007) and the colours given in Harris et al. (1992) to derive K-band magnitudes. All other NGC 5128 GCs were found in the 2MASS point source catalogue. We include the most massive GC highlighted in the Rejkuba et al. (2007) study, i.e. HCH99-18 with a mass of 107 M⊙.
3.4 Young Massive Star Clusters
W3 and W30
W3 and W30 are 400 Myr old, massive star
clusters located in the galaxy NGC 7252 (Maraston et al. (2004); Bastian et al. (2006)). Before
including these young clusters with our old stellar systems, we evolve
them by 10 Gyrs using the single stellar population (SSP) model
of Bruzual &
Charlot (2003) and a Chabrier (2003) IMF, which
implies a K-band fading of 2.66 mags.
3.5 Intermediate Mass Objects (IMOs)
Velocity dispersions and half light radii measurements for IMOs classified as UCDs and DGTOs are from Haşegan et al. (2005), Evstigneeva et al. (2007) and Hilker et al. (2007). We corrected the quoted aperture velocity dispersions from Haşegan et al. (2005) and Hilker et al. (2007) (their Table 5) following Section 2.1; for Evstigneeva et al. (2007) we use their estimated central value. The Evstigneeva et al. (2007) UCDs and UCD2 and UCD3 from Hilker et al. (2007) UCDs have K-band measurements from 2MASS. The Haşegan et al. (2005) dataset includes metallicities which we use to convert the quoted V magnitudes into K using V–K colours from the SSP model of Bruzual & Charlot (2003) and an assumed old age of 12 Gyrs. The average V–K colour of 2.84 is used to convert the V-band magnitudes of UCD4 and UCD5 from Hilker et al. (2007) to the K-band. We use a distance of 18.1 Mpc to the Virgo IMOs from Caon et al. (1993) (see Mei et al. (2007) for a recent SBF-based distance) and 19.0 Mpc to the Fornax IMOs from Hilker et al. (2007).
Three of the Fornax UCDs have been re-observed and their central velocity dispersions derived by modelling their light profiles (Mieske et al. (2008)). Despite our uniform 10% aperture correction, the values agree quite well (i.e. UCD2 27.2 vs 27.1 km s-1, UCD3 29.3 vs 29.5 km s-1 and UCD4 32.1 vs 30.3 km s-1). Mieske et al. also presented new measurements for a dozen additional Fornax UCDs, but unfortunately K-band magnitudes are not available for them in the 2MASS catalogue. They also lack age and metallicity estimates.
We also include the object M59cO. It is an old (9.3 Gyr), metal-rich (–0.03 dex) object that Chilingarian & Mamon (2008) suggest is a transition between a UCD and a compact elliptical-like galaxy. Using the Bruzual & Charlot (2003) SSP model and Chabrier (2003) IMF we estimate V–K = 3.1 and derive a K-band magnitude from their quoted V magnitude. We use their estimated central velocity dispersion.
3.6 Dwarf Elliptical Nuclei
Geha et al. (2002) give size, velocity dispersion and V-band magnitude data for several nucleated dwarf ellipticals (dE,N). They also derive properties for the nuclear component separately. In a study of 45 dE,N galaxies, Lotz et al. (2004) found the nuclei colours to corelate with global colours and be only slightly bluer than the rest of the galaxy (i.e. 0.15 in V–I). Côté et al. (2006) found no strong colour gradients in their sample of dwarf ellipticals in the Virgo cluster. Here we make the approximation that the nuclei have the same V–K colours as observed for the entire galaxy and hence we calculate MK for the nuclei based on their observed nuclei V-band magnitudes and total galaxy K-band magnitudes from 2MASS. We note that the use of the virial theorem to derive masses may not be strictly applicable to these systems as they are not isolated, but rather embedded within a host galaxy.
3.7 Dwarf Spheroidals
Velocity dispersion measurements and V-band magnitudes for the Local Group dwarf spheroidals are taken from Burstein et al. (1997), Mateo (1998), Gilmore et al. (2007), Lewis et al. (2007) and Belokurov & et al. (2006). Half light radii are from Gilmore et al. (2007). To convert V-band magnitudes into the K-band we use V–K colours which are based on the observed metallicity and an assumed old age (Grebel et al. (2003)) with the SSP model of Bruzual & Charlot (2003). The resulting colours are V–K 2.
3.8 Compact Ellipticals
We include M32 in our sample which is the prototype for the class of objects called compact ellipticals (cE). It is generally thought that M32 was originally a much larger galaxy that has been stripped of its outer stars hence reducing its total luminosity and size but with only a small effect on its central velocity dispersion (Valluri et al. (2005); Howley et al. (2008) and references therein). We take the central velocity dispersion value from van der Marel et al. (1998), the ‘bulge’ half light radius and bulge R band magnitude from Graham (2002), and R–K = 2.1 based on matched aperture values given in NED. If we had used the total K-band magnitude from 2MASS (which may be contaminated by light from M31) we would derive a value for MK which is half a magnitude more luminous. We assume a distance to M32 of 780 kpc.
3.9 Dwarf ellipticals
The central velocity dispersions for dwarf ellipticals come from Pedraz et al. (2002), Simien & Prugniel (2002), Geha et al. (2003) and van Zee et al. (2004). Total K-band magnitudes and half light radii (converted from R20 values) come from 2MASS.
The size and magnitude information for dwarf ellipticals is supplemented by the Virgo cluster dwarf elliptical sample of Binggeli & Jerjen (1998). To the best of our knowledge there is no velocity dispersion measurements for most of their sample. The quoted B-band magnitudes were converted into the K-band using the linear fit to the B–K colour-magnitude relation as described in Section 2.2. A distance of 18.1 Mpc to the Virgo cluster dwarfs is used (Caon et al. (1993)).
3.10 Normal and Giant Ellipticals
The division between normal and giant ellipticals is somewhat arbitrary. However, a transition around MB –20.5 (MK –24.5) separates the core profile giants from the power law profile ellipticals of lower mass.
We take the central velocity dispersions of normal and giant ellipticals from Bender & Nieto (1990), Bender et al. (1992), Burstein et al. (1997), Faber et al. (1989), Trager et al. (2000), Moore et al. (2002), Matković & Guzmán (2005) and Firth et al. (2008). Lenticular galaxies are excluded from our sample. Total K-band magnitudes come from 2MASS. Half light radii are calculated from the 2MASS R20 radii as per Section 2.2. We note that D08 used half light radii directly from Bender et al. (1992) which assumes H0 = 50 km s-1 Mpc-1 and that each galaxy is well fit by an R1/4 law (i.e. a fixed Sérsic n value of 4). Here we use the cosmic microwave background corrected distances with H0 = 73 km s-1 Mpc-1 from NED. We do not include the bulges of spirals from Bender et al. (1992) as done by D08. Such systems may have a substantial contribution from rotational support (which is not taken into account by D08).
4 Results and Discussion
4.1 Velocity Dispersion
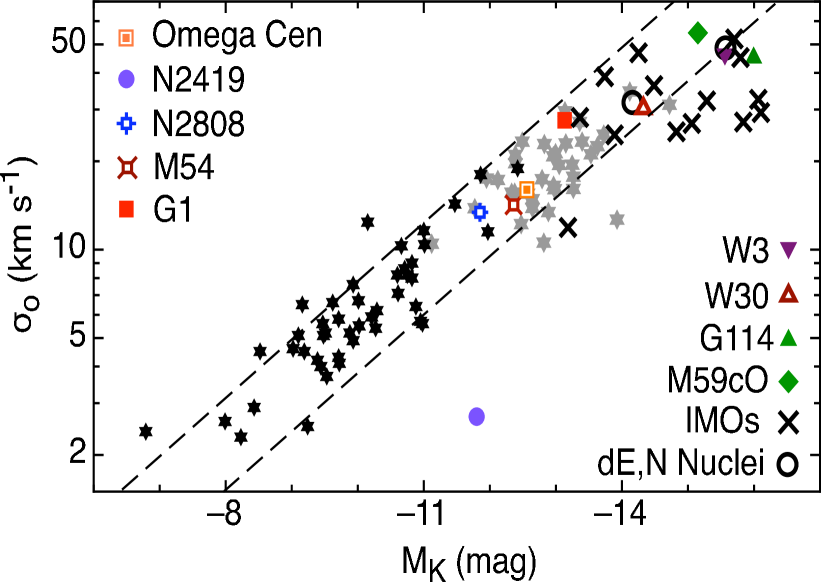
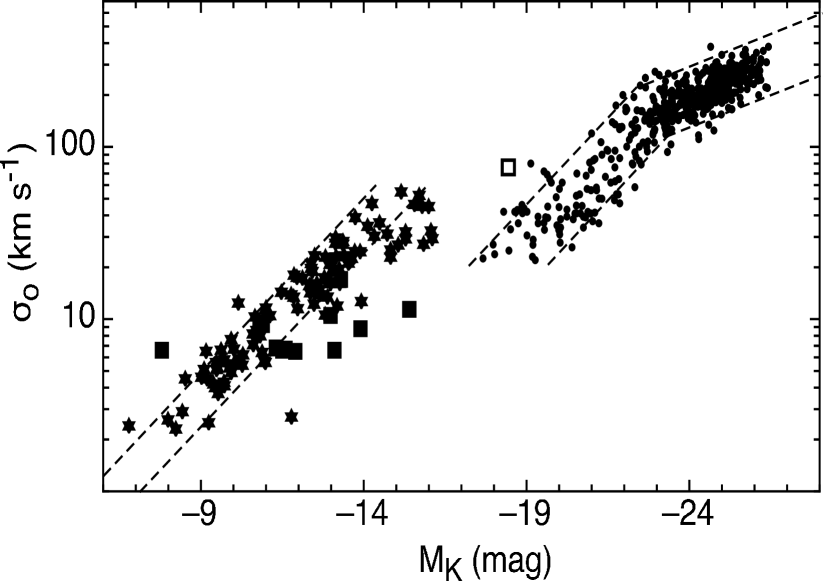
Figure 4 shows that the central velocity dispersion scales with absolute magnitude for objects with MK –16 mag. Here we show GCs, young massive star clusters (after 10 Gyrs evolution), possible remnants of dwarf galaxy nuclei, the nuclei of dE,N galaxies and IMOs (i.e. UCDs, DGTOs and M59cO). We also highlight the outer Galactic GC NGC 2419 which has a low velocity dispersion for its magnitude. For a relation of the type LK , the GCs have a slope consistent with = 2.0, as found by McLaughlin (2000) in the V band. This is expected from the virial theorem for objects with a constant size and M/L ratio. The plot shows that the GCs of M31 and NGC 5128 follow the general trend of Galactic GCs to brighter magnitudes. This supports the conclusion of Barmby et al. (2007) that GCs in these galaxies share common structural properties. The proposed remnants of dwarf galaxy nuclei (Omega Cen, M54, NGC 2808 and G1) occupy the high luminosity (mass) end of the GC sequence but are also consistent with the trend for GCs. The half dozen most luminous IMOs (i.e. MK –15 mag.) show some evidence for smaller velocity dispersions at a given K-band magnitude. However, more data are needed to verify if this is a systematic trend.
We note that most low luminosity dE galaxies contain nuclei (Binggeli & Jerjen (1998); Graham & Guzmán (2003); Côté et al. (2006)), and so may actually be classified as dE,N in good quality imaging. Thus to varying degrees, measurement of the velocity dispersion in such galaxies is being influenced by the presence of the nucleus. In the case of the Local Group dE,N galaxy NGC 205 the nucleus is ‘cold’ and the velocity dispersion profile reveals a prominent dip at the galaxy centre (Valluri et al. (2005); Howley et al. (2008)). However, the velocity dispersion profiles for a small sample of dE,N galaxies by Geha et al. (2002) reveals a range of profiles from central dips to peaks. Geha et al. derived an estimate of the nuclear properties including the velocity dispersion. These nuclear velocity dispersions and magnitudes are consistent with the massive GC and IMO trend (see Figure 4).
Figure 5 extends the central velocity dispersion versus absolute magnitude plot to include elliptical galaxies. Galaxies follow a LK relation that has 4 for giant ellipticals (the well known Faber-Jackson relation) which changes to 2 for dwarf ellipticals (e.g. de Rijcke et al. (2005); Matković & Guzmán (2005)). Thus extrapolation of the Faber-Jackson relation for giant ellipticals down to the luminosity of GCs and IMOs, as done in some studies, would seem inappropriate. We note that dwarf elliptical slope is the same as that for GCs, albeit with an offset in the relations of MK 5 mag. between low luminosity dwarfs and massive GCs. As has been long recognised, the rare cE galaxy M32 does not lie on either the giant or dwarf luminosity- sequences.
We also show the location of dSph galaxies in Figure 5. They have a range of absolute magnitudes that span from GCs to the most luminous IMOs, however they possess near constant velocity dispersions. The evolution of dark matter dominated dSph galaxies under the influence of tidal stripping has been explored by Penarrubia et al. (2008). They find that tidal stripping reduces the stellar luminosity, radius and central velocity dispersion while increasing the mass-to-light ratio. Their tidal evolutionary tracks can qualitatively explain the properties of the dSph galaxies, however the dSph galaxies in Figure 5 have a shallower trend than predicted by their models. An alternative scenario is that they are dynamically evolved tidal dwarf galaxies (Metz et al. (2008)).
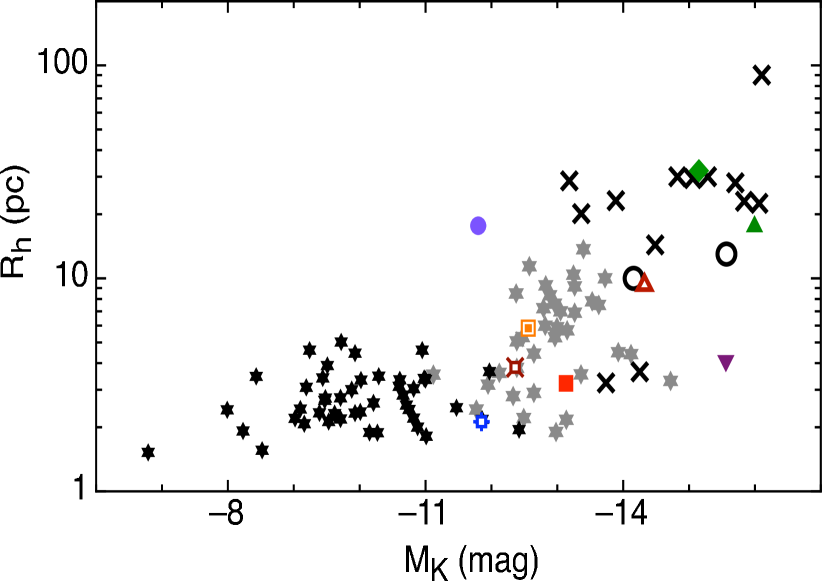
4.2 Half Light Radii
Figure 6 shows the half light radius, Rh, versus absolute K-band magnitude for objects with MK –16 mag. GCs with a luminosity of MK –12 mag. (which corresponds to a stellar mass of 106 M⊙) have a near constant size of 3-4 pc. More luminous GCs, young massive star clusters, remnants of dwarf galaxy nuclei, the nuclei of dE,N galaxies and IMOs, have sizes that scale roughly linearly with luminosity (e.g. Kissler-Patig et al. (2006)). This may also be interpreted as a lower envelope to the distribution of half light radii with magnitude (see Barmby et al. (2007)). The outer Galactic GC NGC 2419 has a very large size for its magnitude. We note that the so-called ‘faint fuzzy’ objects (Brodie & Larsen (2002)) have larger sizes than typical low mass GCs but are not included in this analysis as they lack internal velocity dispersion measurements.
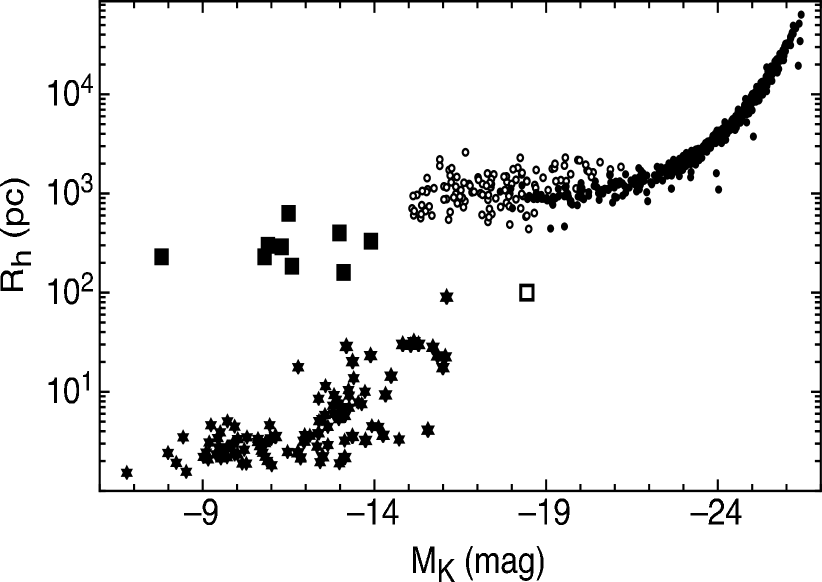
Figure 7 shows the half light radius versus absolute magnitude including elliptical and dSph galaxies. The giant ellipticals have a linear slope similar to that found by Fish (1964), this relation flattens for lower luminosity ellipticals to a roughly constant half light radius of 1 kpc. The dSph galaxies have a range of half light radii, which is generally smaller than the lowest luminosity dwarf elliptical.
D08 also examined the luminosity-size relation and to quote them “It is surprising that the MCOs [IMOs] lie on the same relation between mass and radius as massive elliptical galaxies with masses 1011 M⊙, while elliptical galaxies with lower masses (i.e. objects in the intermediate mass range) mostly lie on a different relation, which points towards the parameter space of dSphs.”
Figure 7 does indeed show that giant ellipticals and massive GCs/IMOs have a similar luminosity-size relation slope However, we consider this as coincidental as the elliptical galaxy relation extends continously from giants to dwarfs with no obvious break. In other words, no single linear luminosity-radius relation is suitable for elliptical galaxies over a wide range of luminosity.
As for the dSph galaxies, Figure 7 indicates that their half light sizes are smaller than a simple extrapolation of the dwarf elliptical relation to lower masses. We note that D08 have used data directly from Bender et al. (1992) which assumes sizes based on H0 = 50 km s-1 Mpc-1 and that R1/4 models are good fits to the light profiles of dwarf galaxies (which they are not). Here we have used H0 = 73 km s-1 Mpc-1 and calculated half light radii from Sérsic models (using equations 8 and 9). In order to illustrate the dwarf sequence to lower luminosities we include the half light radii mured by Binggeli & Jerjen (1998) who fit Sérsic models to their data. The K-band absolute magnitudes are determined from a linear fit to our B–K colour-magnitude relation (Section 2.2),so the uncertainty in the B–K colours at MK = –16 may cause a 0.5 mag. change in the Binggeli & Jerjen (1998) MK values plotted, i.e. a horizontal shift only. We note that the Binggeli & Jerjen (1998) data scatters evenly about an extrapolation of our sample to lower luminosities. This indicates that our half light radii conversion from 2MASS R20 radii is reasonable even at low luminosities. We conclude that dE sizes remain roughly constant at a value some 5-10 greater than the typical size of dSph galaxies. The possible systematic underestimate of our half light radii by 40%, or 0.15 dex at MK –19 (see Figure 2) would only serve to increase the gap in sizes between low luminosity dEs and dSph galaxies. The possibility that larger size dSph galaxies exist, but have yet to be discovered, can not be ruled out.
The general lack of objects with sizes around 50-100 pc appears to be a real feature rather than a selection effect. The tidally stripped galaxy M32 and UCD number 3 from the study of Hilker et al. (2007) are notable exceptions. Gilmore et al. (2007) have argued that the gap represents a physical divide between dark matter free star clusters and IMOs, and the dark matter dominated galaxies. To address this, and related issues, we investigate the stellar and total virial masses for our sample below.
4.3 Masses
Figure 8 shows Rh (a measure of dynamical mass) versus absolute K-band magnitude. This figure reveals a continuous relation including GCs, young massive star clusters, remnants of dwarf galaxy nuclei, the nuclei of dE,N galaxies and IMOs. The ‘wiggles’ seen in Figures 4 and 6 have largely been removed by considering Rh. Similarly, the GC NGC 2419 with a large size and low velocity dispersion is no longer an extreme outlier. Ripepi et al. (2007) note that the half light radius in Harris (1996) may be underestimated, and hence the data point for NGC 2419 may move upward in Figure 8 to join the general trend.
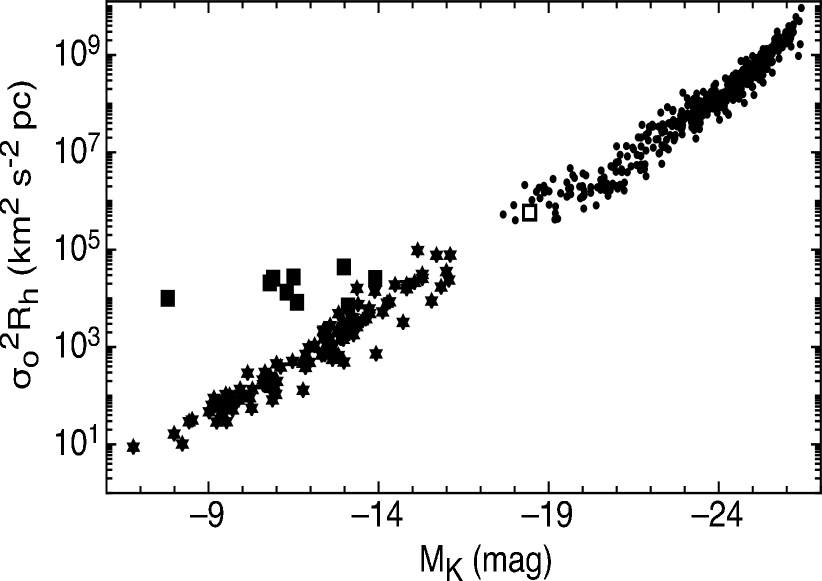
Figure 9 extends Figure 8 to include elliptical and dSph galaxies. A general sequence is seen over 18 magnitudes in MK from GCs to giant ellipticals (including the cE galaxy M32), with a notable gap in the data at –16 MK –18. This gap can be filled by dwarf galaxies (e.g. from the Binggeli & Jerjen (1998) sample) when their velocity dispersions are known. If the LK dE galaxy scaling holds then such galaxies, with constant half light radii of about 1 kpc, will extend the galaxy trend in Figure 9 down in mass to join the massive GCs and IMOs. If however, lower luminosity dwarf galaxies reveal relatively constant central velocity dispersions of 30 km s-1 then they will not join up with the GC/IMO trend but rather have a constant dynamical mass (a horizontal line at km2 s-2 pc in Figure 9). We note that although dSph galaxies have similar Rh values to the IMOs, they have a range of luminosities and hence occupy a different sequence to the other objects.
4.3.1 Virial and Stellar Masses
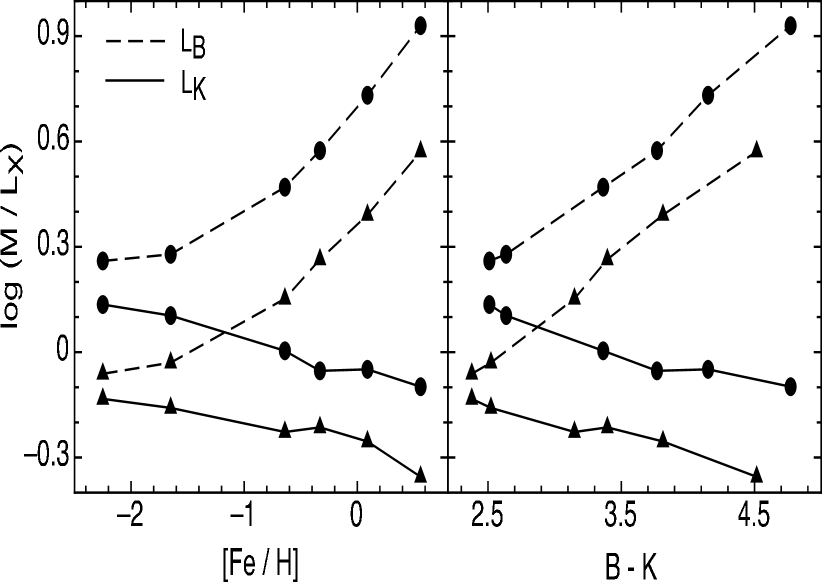
We now probe the relationship between virial and stellar mass. The total stellar mass, in solar masses, is calculated from the absolute K-band magnitude using MK⊙ = +3.28 and a K-band stellar mass-to-light ratio. We use the K-band stellar M/L ratios from the stellar population models of Bruzual & Charlot (2003) with a Chabrier (2003) IMF and an assumed age of 12 Gyr. We note that the Chabrier IMF is essentially identical to the Kroupa (2002) IMF, which is a good representation of the mass function of resolved young star clusters. Figure 10 shows the M/LK variation as a function of metallicity and B–K colour for an old (12 Gyr) and intermediate age (5 Gyr) stellar system. We have derived the best fit relation for M/LK over the metallicity/colour range from metal-poor GCs to giant red ellipticals. Thus for a given observed colour, or metallicity, we assign a unique stellar M/LK to the object in question. This effectively removes any metallicity differences between objects and allows us to compare the resulting stellar masses. One advantage of using the K-band is that M/LK is a weak function of metallicity and colour (and hence system mass) for old stellar systems, varying by only 0.2 dex for our sample. Although shifted to lower M/L ratios by a factor of about two relative to the 12 Gyr track, the 5 Gyr old track reveals a similar variation with metallicity and colour. For either old or intermediate-aged systems, the M/L variations in the K-band are substantially less than that in the B-band. Most previous work has used optical wavelengths for which the M/L ratio correction can vary by 0.5 dex with metallicity or age and hence adds a significant source of uncertainty in any stellar mass estimate (see discussion by D08).
To calculate stellar masses we have assumed an age of 12 Gyrs when deriving the K-band M/L ratio. Galactic GCs are uniformly older than 10 Gyrs (de Angeli et al. (2005)) and the globular clusters with multiple stellar populations appear to be dominated by the oldest population (e.g. Piotto et al. (2007); Siegel et al. (2007)). Direct age measurements of IMOs are very rare in the literature, however their colours and limited spectra are generally consistent with old ages (Haşegan et al. (2005); Evstigneeva et al. (2007)). Dwarf ellipticals reveal a range of central ages (Caldwell et al. (2003)). If these systems were dominated by a younger (e.g. 5 Gyr) population, then the M/LK ratio would be lower by a factor of 2, and hence the log stellar mass lower by 0.3 dex. Although some giant ellipticals reveal evidence for young stars at their cores, global averages typically support very old ages (Proctor et al. (2008)). We refer the reader to D08 for an extensive discussion on alternative stellar population models and IMFs.
The virial mass is calculated as Rh / and is an estimator of total mass within the virial radius (e.g. Prugniel & Simien (1997)). Here is the universal gravitational constant and is the virial coefficient which incorporates various factors such as degree of virialisation, conversion of light-weighted into mass-weighted quantities, projection effects, stellar orbits, etc. See Zibetti et al. (2002) and Trujillo et al. (2004) for an alternative approaches.
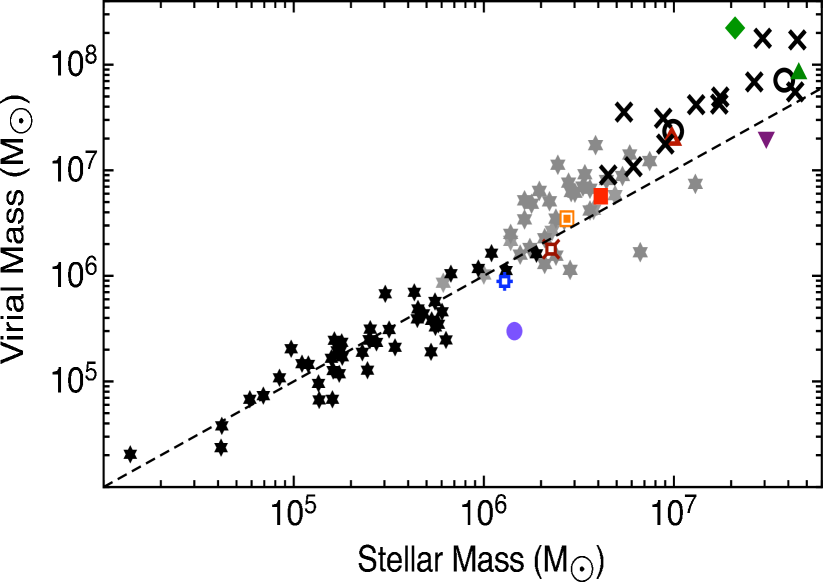
In Figure 11 we show the virial mass against the total stellar mass for globular clusters and IMOs. A virial coefficient of = 10 is used for these objects. It has the property that the virial mass is roughly equal to the stellar mass for the low mass GCs, which are thought to be free of dark matter today (Moore (1996); Brodie 2008, priv. comm.) but may have originally formed in dark matter minihalos (Mashchenko & Sills (2005)). We note that Haşegan et al. (2005) has calculated dynamical masses for their DGTOs assuming their surface brightness profiles are well fit by King laws. For the six DGTOs in common, we find differences to our virial masses of between 1% and 26%. Thus at the extreme, the 0.1 dex difference in mass is within the scatter of Figure 11.
Globular clusters, young star clusters and IMOs have an upper mass limit in Figure 11 of about 108 M⊙. This may be a physical limit associated with local conditions within a galaxy, i.e. a peak in the star formation rate per unit area (Larsen & Richtler (2000)) and the internal galaxy pressure (Billett et al. (2002)). There is also a size-of-sample effect so that the galaxies with the most star clusters host the highest mass clusters (Whitmore (2000)). For such galaxies, star clusters are observed in the local universe to have an upper limit of 108 M⊙ (see compilation by Whitmore (2000)). To date the known IMOs are within this upper mass limit for star clusters. This is consistent with the idea that IMOs are massive star clusters.
Figure 11 also shows that the high mass GCs and IMOs start to deviate systematically from a one-to-one line to slightly higher virial-to-stellar mass ratios (equivalently higher inferred M/L ratios) assuming the same virial coefficient of 10 is appropriate. For the high mass GCs the two-body relaxation time is longer than their inferred age (D08). This fact may be reflected in the appearance of a luminosity-radius relation for massive GCs (Figure 6), a change in slope of the luminosity- relation (Figure 4), the presence of multiple stellar populations (Piotto et al. (2007)) and extended light profiles (McLaughlin et al. (2008)). A similar change in the virial-to-stellar mass ratio at a few times 106 M⊙ is found by Mieske et al. (2008).
For the massive globular clusters and IMOs, the ratio of virial-to-stellar mass is 3:1. However the dark matter fraction of 2/3 suggested by this relation is at odds with our understanding of massive GCs as being dark matter free like their low mass counterparts (Moore (1996); Brodie 2008, priv. comm.). This can be reconciled for the massive GCs (and IMOs) if the virial masses are overestimated or if the stellar masses underestimated by a factor of about three (0.48 in log mass). Kouwenhoven & de Grijs (2008) have found that the presence of binaries can lead to an overestimation of the virial mass by up to a factor of two, however this effect is strongest for low mass GCs and largely insignificant for star clusters of mass 107 M⊙. Kundu (2008) has recently suggested that the current samples of massive GCs and IMOs are preferentially drawn from large galactocentric radii and are hence intrinsically larger, as seen in the Milky Way (van den Bergh et al. (1991)). We have tested this hypothesis on the 16 GCs in NGC 5128 from Rejkuba et al. (2007) which have a mean size of Rh = 5.9 pc for a mean projected galactocentric distance of 9.4 kpc. Using the scaling method of Barmby et al. (2007) we find that these GCs are some 50 per cent larger than equivalent Milky Way GCs. Thus this selection effects may lead to an overestimate of the virial mass (assuming an unchanged velocity dispersion) of 0.18 dex in the log, which is insufficient to account for the trend observed. Another possibility is if the massive GCs and IMOs are not fully relaxed as suggested by D08, then using their measured velocity dispersions may overestimate the virial mass. The alternative approach is to explore reasons why the stellar mass may be underestimated. For example, we could appeal to a different IMF than used here, e.g. one with a higher stellar mass-to-light ratio such as a Salpeter IMF. This which would increase the stellar mass (by about 0.2 dex in log mass). However, there is little observational support for a Salpeter-like IMF in resolvable star clusters (Chabrier (2003)).
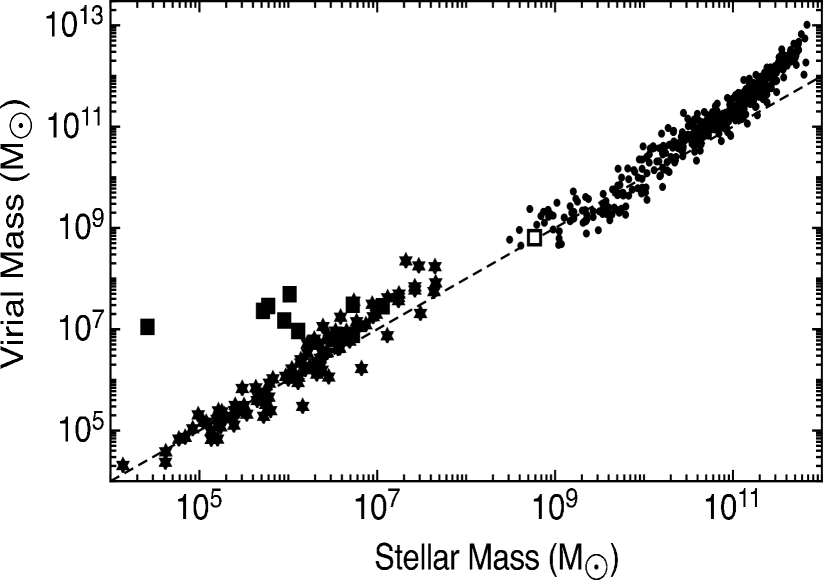
Figure 12 extends Figure 11 to include elliptical and dwarf spheroidal galaxies. As seen in Figure 9, Figure 12 reveals a gap in virial mass at a few 108 to 109 M⊙. Dwarf spheroidal galaxies have near constant virial masses of 107 M⊙ and do not appear to follow the GC/IMO or galaxy sequences. Elliptical galaxies are offset from the one-to-one relation to higher virial-to-stellar mass ratios. Below we explore the effects of using more realistic virial coefficients for elliptical galaxies. We initially set the virial coefficient = 5 following Cappellari et al. (2006). In their dynamical study of several normal ellipticals they concluded “… that the simple virial mass estimate of M/L, and correspondingly of galaxy mass, is virtually unbiased, in the sense that it produces estimates that follow a nearly one-to-one correlation with the M/L computed from much more ‘expensive’ dynamical models.”
4.3.2 Correcting for the Effects of Non-Homology in Elliptical Galaxies
Figure 12 assumes a virial coefficient that is the same for all galaxies (i.e. homology). However, elliptical galaxies have luminosity-dependent light profile shapes (e.g. Caon et al. (1993); Ferrarese et al. (2006); Ball et al. (2008)). This structural non-homology implies an associated luminosity-dependent, dynamical non-homology. Parameterisation by a Sérsic law has revealed that profiles vary from n 0.5 to 10 (Caon et al. (1993)). The associated dynamical non-homology in the velocity dispersion profile influences the tilt of the fundamental plane (FP). If homology effects are left uncorrected, they cause the standard FP to depart from the virial plane which may result in erroneous mass-to-light trends with mass (Capelato et al. (1995); Graham & Colless (1997)). In this paper we take non-homology effects into account using the virial coefficient from Bertin et al. (2002) (see also Prugniel & Simien (1997)). They created a spherical, non-rotating, isotropic model galaxy with various light profile shapes. Their resulting virial coefficient is appropriate for use with the half light radius and a velocity dispersion measured within Re/8 (which is similar to the central values given in the literature). Using their eq. 11 which relates the virial coefficient to the Sérsic index n, and the known relationship of n with magnitude (equation 5), we can effectively correct the virial mass of galaxies for the effects of non-R1/4 light profiles. The result of applying this correction is shown in Figure 13, along with the variation of with stellar mass. We note that for those normal elliptical galaxies, for which the R1/4 model is a reasonable fit to the light profiles, 5 (Cappellari et al. (2006)). Relative to Figure 12 (which has = 10), the galaxy data have moved 0.3 dex closer to the one-to-one line. Giant ellipticals with a small virial coefficient ( 3) have been corrected downwards the most in this plot. The scatter about the one-to-one line is 0.3 dex, however we note the caveat from Mamon & Lokas (2005), that even if the velocity dispersion profile were known to high accuracy out to 5 half light radii, unconstrained mass and stellar anisotropy profiles could make the total mass uncertain by a systematic factor of 3 (0.48 dex in log mass). We further caution that if there is a conspiracy between the radial distribution of stars and dark matter, such that their combined density profile is isothermal irrespective of galaxy mass (Bolton et al. (2008)), then the virial coefficient should also be constant with galaxy mass.
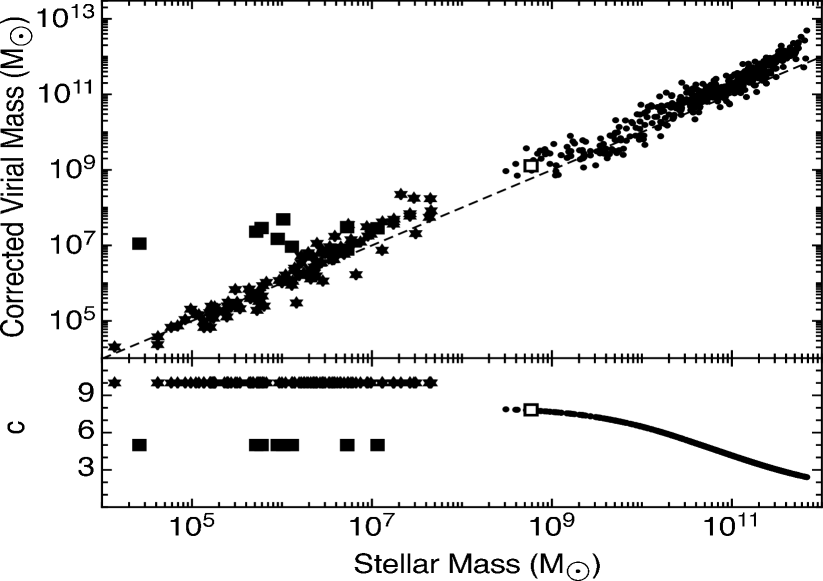
After accounting for non-homology, we find that over the K-band (B-band) magnitude interval (), our elliptical galaxy sample appear consistent with the expectation of the virial theorem. That is, after allowing for the primary effects which introduce a “tilt” into the regular FP, our results are in agreement with the virial plane. Figure 13 reveals that the virial-to-stellar mass ratio does not strongly vary with galaxy mass for masses less than about 1011 M⊙. A fit to the elliptical galaxy data below masses of 1011 M⊙ is fully consistent with a slope of unity, i.e. the virial mass scales directly with the stellar mass, with the ratio of virial-to-stellar mass being 2:1 on average. This suggests that about half of the mass in dwarf to normal elliptical galaxies is in the form of dark matter. A similar conclusion was reached by Rijcke et al. (2005) in a dynamical study of dwarf ellipticals. The lack of variation in the ratio over this mass regime suggests that claims of a varying mass-to-light ratio, e.g. (with a non-zero value of ) derived from a standard FP analysis with R1/4 light profile fits, should be reconsidered.
For the most massive (above 1011 M⊙) elliptical galaxies the slope of the relation becomes steeper than unity. Could this effect be due to the presence of an additional baryonic component, i.e. hot gas, that is not accounted for in our stellar mass estimates? Most galaxies we have considered have little if any cold or hot gas, so that the stellar mass is essentially the same as the baryon mass content. However, the main exception to this is that the most massive ellipticals may contain a substantial halo of hot gas (O’Sullivan et al. (2001)). Matsushita (2001) has shown that the hot gas content in ellipticals, as traced by X-rays, within 4 half light radii is typically 0.1% of the stellar mass for a 1011 M⊙ elliptical rising to 10% for a 1012 M⊙ one. Thus corrections for the hot gas mass in giant ellipticals would tend to flatten the slope but this effect is not strong enough to reduce the slope to unity, i.e. the most massive ellipticals have higher virial-to-baryon mass ratios than lower mass galaxies. Thus the dark matter fraction appears to increase in the most massive ellipticals. This is consistent with results of Gallazzi et al. (2006) who find evidence for higher virial-to-stellar mass ratios in a sample of 26 000 galaxies from the Sloan Digital Sky Survey. It is also supported by strong lensing studies (Ferreras et al. (2005)), which have probed the enclosed mass out to 5 half light radii, finding the virial-to-stellar mass ratio varies from about 1:1 in 1010 M⊙ ellipticals to 5:1 in 1012 M⊙ galaxies. We note that weak lensing results tend to find higher virial-to-stellar mass ratios (e.g. Mandelbaum et al. (2006)).
The Bertin et al. model assumes a non-rotating galaxy, however lower mass ellipticals are known to have a larger contribution to their dynamics from rotation than high luminosity ellipticals (e.g. Bender et al. (1992)). Ignoring rotation and flattening tends to underestimate the virial mass and hence the resulting M/L ratios. For (rotating) normal ellipticals, Bender et al. (1992) estimate the effect is up to 0.13 dex in log virial mass. From the samples of the lowest luminosity dwarf ellipticals (MV –16 mag.) studied to date (e.g. Pedraz et al. (2002); Geha et al. (2002); van Zee et al. (2004)), some show hints of rotation while others show none. For giant ellipticals, the contribution from rotation is minor. Thus the correction due to rotation appears to be small for most elliptical galaxies (see also Matković & Guzmán (2005)) and we do not include it here. We remind the reader that our sample consists of only elliptical galaxies and does not include obvious lenticular galaxies.
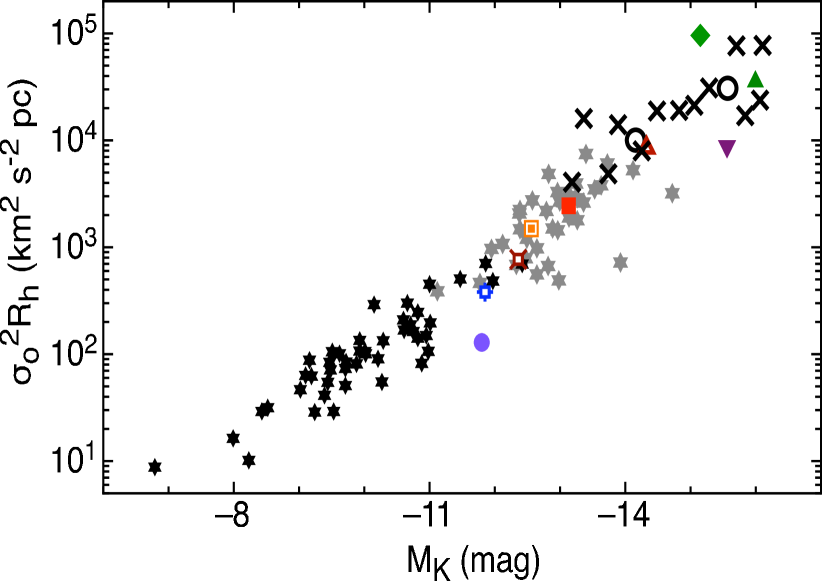
4.4 Trends with Velocity Dispersion
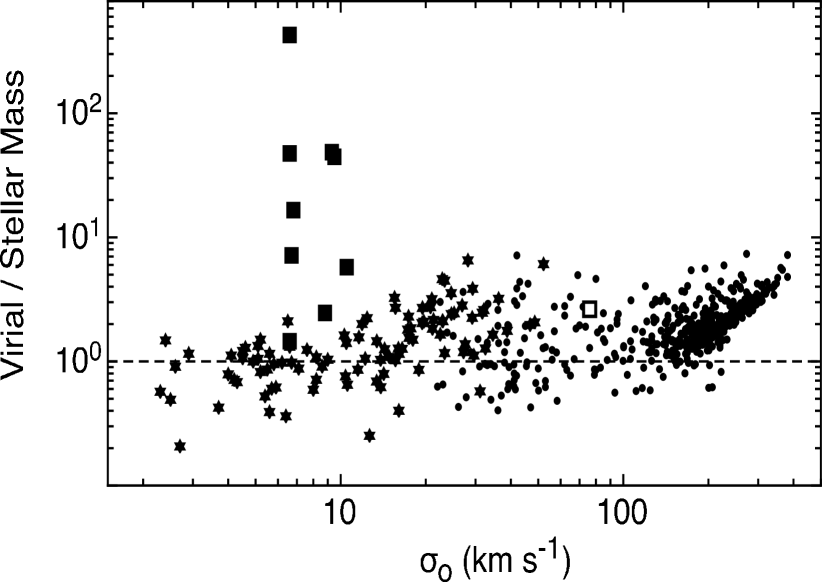
Zaritsky et al. (2006) first present the unification of spheroidal stellar systems in what they refer to as the Fundamental Manifold of spheroids. They argue for the existence of a continuous ‘U-shaped’ trend between M/L and , with large M/L ratios for both low mass dwarf spheroidal and high mass giant elliptical galaxies and clusters of galaxies. They do not include IMOs or GCs in their analysis.
In Figure 14 we show a similar plot to Zaritsky et al. (2006) which includes GCs and IMOs but excludes systems of galaxies, i.e. groups and clusters of galaxies. It shows virial-to-stellar mass ratios that scatter about a ratio of 1 (for low mass GCs) and 2 up to 200 km s-1 at which point the ratio increases rapidly for the most massive ellipticals. Dwarf spheroidals appear distinct in Figure 14 with a large range in their virial-to-stellar mass ratios for relatively similar velocity dispersions. Figure 14 is qualitatively similar to figure 9 of Zaritsky et al. for systems with velocity dispersions greater than 30 km s-1. However GCs, and some IMOs, are inconsistent with the Zaritsky et al. (2006) unification which have relatively constant virial-to-stellar mass ratios, of roughly unity, as their velocity dispersions decrease. Neither the simple U-shaped quadratic form as advocated by Zaritsky et al. (2006), or the revised Fundamental Manifold of Zaritsky et al. (2007), provides a good representation for our sample which includes GCs and IMOs.
Mieske et al. (2008) also discuss whether GCs and UCDs fit the Zaritsky et al. Fundamental Manifold, reaching a similar conclusion to us that GCs deviate from the manifold.
5 Conclusions and Future Work
We have collected various data samples from the literature for old, pressure-supported systems which includes globular clusters, massive star clusters, intermediate mass objects (such as ultra compact dwarfs), dwarf spheroidals, dwarf ellipticals and giant ellipticals, and covers a range in mass from 104 to 1012 M⊙. We have applied several improvements on past work that has examined their virial and stellar masses. We have employed aperture corrections to the velocity dispersion measurements of GCs and intermediate mass objects. We have also derived new half light radii for elliptical galaxies based on their sizes and ellipticities from the homogeneous 2MASS survey. Near-infrared magnitudes from the 2MASS survey are converted into total stellar masses using a K-band mass-to-light ratio that depends on the metallicity or colour of the object. Virial masses are calculated taking into account non-homology effects for galaxies.
Although the scalings of velocity dispersion and half light radius with absolute K-band magnitude vary depending on the mass regime probed, these scalings combine to give a virial versus stellar mass relation that shows a remarkable near continuous trend from GCs to ellipticals. We find that the Fundamental Manifold of Zaritsky et al. (2006) is not a good representation for GCs. Dwarf and normal elliptical galaxies are found to have virial-to-stellar mass ratios of 2:1. This ratio only increases in the very most massive ellipticals, with masses greater than 1011 M⊙. Our results are subject to systematic effects from remaining uncertainties, e.g. in the distribution of dark matter, the accuracy of 2MASS total K-band magnitudes, the appropriate IMF to use etc. However, such trends are generally consistent with results from strong lensing studies.
The recently discovered intermediate mass ( 107 M⊙) objects, e.g. Ultra Compact Dwarfs and Dwarf Globular Transition Objects, cover the same parameter space of velocity dispersion, half light radius and mass as massive globular clusters, possible dwarf galaxy nuclei, massive star clusters and the nuclei of dE,N galaxies. To date, these intermediate mass objects do not exceed the maximum mass of known star clusters in galaxies (Whitmore (2000)) and they are spatially concentrated near large galaxies (Wehner & Harris (2007)). All of these facts would support an interpretation that intermediate mass objects are essentially massive star clusters. Given that there is no evidence in the literature for dark matter in massive GCs, this would also argue against dark matter in intermediate mass objects as they occupy a similar parameter space. However a mystery remains, in that intermediate mass objects (and massive GCs) exhibit higher virial-to-stellar mass ratios, when we apply the same virial coefficient and Chabrier IMF as low mass GCs. Possible solutions to this mystery may include a different virial coefficient due to a longer relaxation timescale in these systems, or that a bottom heavy Salpeter-like IMF is more appropriate in these objects.
In general agreement with D08, we find dwarf spheroidal galaxies to be distinct in terms of their scaling parameters, following neither an obvious extension of the elliptical galaxy or globular cluster relations. Their virial-to-stellar mass ratios reach one thousand.
Although we have probed mass scales from 104 to 1012 M⊙, there is a mass regime which remains largely unexplored observationally, i.e. 108 M⊙. This is greater than the most massive star clusters and intermediate mass objects known but less than the mass of dwarf ellipticals for which velocity dispersions are available. It is not clear if the virial versus stellar mass relation will connect smoothly across this mass gap between dwarf ellipticals and globular clusters. Thus an observational campaign to measure central velocity dispersions for a sample of very low mass dwarf ellipticals is needed. Observations are also needed to determine whether the radial velocity dispersion profiles in intermediate mass objects are flat or fall with radius, like their light profiles. Obtaining both high spectral and spatial resolution for such small, low surface brightness systems will be observationally challenging. Near-infrared spectra that could constrain the IMF would also be useful (Mieske & Kroupa (2008)).
On the theoretical side, for massive globular clusters and intermediate mass objects we require a detailed understanding of how the virial coefficient varies with the mass and/or type of stellar system, and the expected stellar mass-to-light ratio that includes the effects of multiple stellar populations and dynamical evolutionary processes.
6 Acknowldegements
We thank R. Proctor, J. Hurley, M. Hilker and P. Kroupa for useful discussions. We also thank the referee for a careful reading of the paper and several useful comments. DF thanks the Faculty of ICT and the ARC for financial support. AG thanks the Faculty of ICT and Swinburne University for their financial support. This research has made use of the NASA/IPAC Extragalactic Database (NED). This research made use of the Two Micron All Sky Survey (2MASS).
References
- Ball et al. (2008) Ball N., Loveday J., Brunner R., 2008, Mon. Not. R. Astron. Soc., 383, 907
- Barmby et al. (2007) Barmby P., McLaughlin D. E., Harris W. E., Harris G. L. H., Forbes D. A., 2007, AJ, 133, 2764
- Bastian et al. (2006) Bastian N., Saglia R. P., Goudfrooij P., Kissler-Patig M., Maraston C., Schweizer F., Zoccali M., 2006, A&A, 448, 881
- Bekki et al. (2003) Bekki K., Couch W. J., Drinkwater M. J., Shioya Y., 2003, Mon. Not. R. Astron. Soc., 344, 399
- Bekki et al. (2004) Bekki K., Couch W. J., Drinkwater M. J., Shioya Y., 2004, ApJ, 610, 13
- Belokurov & et al. (2006) Belokurov V., et al. 2006, ApJ, 647, L111
- Bender et al. (1992) Bender R., Burstein D., Faber S. M., 1992, ApJ, 399, 462
- Bender & Nieto (1990) Bender R., Nieto J. L., 1990, Astron. Astrophys., 239, 97
- Bertin et al. (2002) Bertin G., Ciotti L., Del Principe M., 2002, A&A, 386, 149
- Billett et al. (2002) Billett O. H., Hunter D. A., Elmegreen B. G., 2002, AJ, 123, 1454
- Binggeli & Jerjen (1998) Binggeli B., Jerjen H., 1998, A&A, 333, 17
- Böker (2008) Böker T., 2008, ApJ, 672, 111
- Bolton et al. (2008) Bolton A., Treu T., Koopmans L., et al. 2008, arXiv:0805.1932
- Brodie & Larsen (2002) Brodie J. P., Larsen S. S., 2002, AJ, 124, 1410
- Bruzual & Charlot (2003) Bruzual G., Charlot S., 2003, Mon. Not. R. Astron. Soc., 344, 1000
- Burstein et al. (1997) Burstein D., Bender R., Faber S. M., Nolthenius R., 1997, AJ, 114, 1365
- Caldwell et al. (2003) Caldwell N., Rose J., Concannon K., 2003, AJ, 125, 2891
- Caon et al. (1993) Caon N., Capaccioli M., D’Onofrio M., 1993, Mon. Not. R. Astron. Soc., 265, 1013
- Capelato et al. (1995) Capelato H., de Carvalho R., Carlberg R., 1995, ApJ, 451, 525
- Cappellari et al. (2006) Cappellari M., Bacon R., Bureau M., Damen M. C., Davies R. L., de Zeeuw P. T., Emsellem E., Falcon-Barroso J., Krajnović D., Kuntschner H., McDermid R. M., Peletier R. F., Sarzi M., van den Bosch R. C. E., van de Ven G., 2006, Mon. Not. R. Astron. Soc., 366, 1126
- Chabrier (2003) Chabrier G., 2003, AJ, 586, L113
- Chilingarian & Mamon (2008) Chilingarian I., Mamon G. A., 2008, Mon. Not. R. Astron. Soc., 385, 83
- Cohen (2006) Cohen J. G., 2006, ApJ, 653, L21
- Cohen et al. (2007) Cohen J. G., Hsieh S., Metchev S., Djorgovski S. G., Malkan M., 2007, AJ, 133, 99
- Côté et al. (2006) Côté P., Slawomir P., Ferrarese L., Andrés J., Merritt D., Peng E. W., Hasegan M., Blakeslee J. P., Mei S., West M. J., Milosavljević M., Tonry J. L., 2006, ApJS, 165, 57
- Dabringhausen et al. (2008) Dabringhausen J., Hilker M., Kroupa P., 2008, Mon. Not. R. Astron. Soc., 386, 864 (D08)
- de Angeli et al. (2005) de Angeli F., Piotto G., Cassisi S., Busso G., Recio-Blanco A., Salaris M., Aparicio A., Rosenberg A., 2005, AJ, 130, 116
- Djorgovski & Davis (1987) Djorgovski S., Davis M., 1987, ApJ, 313, 59
- Djorgovski et al. (1997) Djorgovski S. G., Gal R. R., McCarthy J. K., Cohen J. G., de Carvalho R. R., Meylan G., Bendinelli O., Parmeggiani G., 1997, ApJ, 474, L19
- D’Onofrio et al. (1994) D’Onofrio M., Capaccioli M., Caon N., 1994, Mon. Not. R. Astron. Soc., 271, 523
- Drinkwater et al. (2003) Drinkwater M. J., Gregg M. D., Hilker M., Bekki K., Couch W. J., Ferguson H. C., Jones J. B., Phillipps S., 2003, Nature, 423, 519
- Drinkwater et al. (2000) Drinkwater M. J., Jones J. B., Gregg M. D., Phillipps S., 2000, PASA, 17, 227
- Evstigneeva et al. (2008) Evstigneeva E., Drinkwater M., Peng C., Hilker M., 2008, AJ, 136, 461
- Evstigneeva et al. (2007) Evstigneeva E. A., Gregg M. D., Drinkwater M., Hilker M., 2007, AJ, 133, 1722
- Faber et al. (1989) Faber S. M., Wegner G. A., Burstein D., Davies R. L., Dressler A., Lynden-Bell D., Terlevich R. J., 1989, ApJS, 69, 763
- Fellhauer & Kroupa (2002) Fellhauer M., Kroupa P., 2002, Mon. Not. R. Astron. Soc., 330, 642
- Ferrarese et al. (2006) Ferrarese L., Côté P., Jordán A., Peng E. W., Blakeslee J. P., Piatek S., Mei S., Merritt D., Milosavljević M., Tonry J. L., West M. J., 2006, ApJS, 164, 334
- Ferreras et al. (2005) Ferreras I., Saha P., Williams L. L. R., 2005, ApJ, 623, L5
- Firth et al. (2008) Firth P., Drinkwater M. J., Evstigneeva E. A., Gregg M. D., Karick A., Jones J. B., Phillipps S., 2008, Mon. Not. R. Astron. Soc., 382, 1342
- Fish (1964) Fish R. A., 1964, ApJ, 139, 284
- Forbes et al. (2004) Forbes D., Strader J., Brodie J., 2004, AJ, 127, 3394
- Gallazzi et al. (2006) Gallazzi A., Charlot S., Brinchmann J., White S., 2006, Mon. Not. R. Astron. Soc., 370, 1106
- Gebhardt et al. (2005) Gebhardt K., Rich R., Ho L., 2005, ApJ, 634, 1093
- Geha et al. (2002) Geha M., Guhathakurta P., van der Marel R. P., 2002, AJ, 124, 3073
- Geha et al. (2003) Geha M., Guhathakurta P., van der Marel R. P., 2003, AJ, 126, 1794
- Gilmore et al. (2007) Gilmore G., Wilkinson M. I., Wyse R. F. G., Kleyna J. T., Koch A., Evans N. W., Grebel E. K., 2007, ApJ, 663, 948
- Goerdt et al. (2008) Goerdt T., Moore B., Kazantzidis S., Kaufmann T., Macció A. V., Stadel J., 2008, Mon. Not. R. Astron. Soc., 385, 2136
- Goudfrooij et al. (2001) Goudfrooij P., Victoria A. M., Maraston C., Dante M., 2001, Mon. Not. R. Astron. Soc., 328, 237
- Graham & Colless (1997) Graham A., Colless M., 1997, Mon. Not. R. Astron. Soc., 287, 221
- Graham et al. (2007) Graham A., Driver S., Allen P., Liske J., 2007, Mon. Not. R. Astron. Soc., 378, 198
- Graham & Worley (2008) Graham A., Worley C., 2008, arXiv:0805.3565
- Graham (2002) Graham A. W., 2002, ApJ, 568, L13
- Graham & Guzmán (2003) Graham A. W., Guzmán R., 2003, AJ, 125, 2936
- Grebel et al. (2003) Grebel E. K., J. S. Gallagher I., Harbeck D., 2003, AJ, 125, 1926
- Haşegan et al. (2005) Haşegan M., Jordán A., Côté P., Djorgovski S. G., McLaughlin D. E., Blakeslee J. P., Mei S., West M. J., Peng E. W., Ferrarese L., abd J. L. Tonry M. M., Merritt D., 2005, ApJ, 627, 203
- Harris et al. (1992) Harris G. L. H., Geisler D., Harris H. C., Hesser J. E., 1992, AJ, 104, 613
- Harris (1996) Harris W. E., 1996, AJ, 113, 1487
- Hilker et al. (2007) Hilker M., Baumgardt H., Infante L., Drinkwater M., Evstigneeva E., Gregg M., 2007, A&A, 463, 119
- Hilker et al. (1999) Hilker M., Infante L., Vieira G., Kissler-Patig M., Richtler T., 1999, A&AS, 134, 75
- Hilker & Richtler (2000) Hilker M., Richtler T., 2000, A&A, 362, 895
- Howley et al. (2008) Howley K. M., Geha M., Guhathakurta P., Montgomery R. M., Laughlin G., Johnston K. V., 2008, arXiv:08004.0798
- Jarrett et al. (2003) Jarrett T. H., Chester T., Cutri R., ad J. P. Huchra S. E. S., 2003, AJ, 125, 525
- Jarrett et al. (2000) Jarrett T. H., Chester T., Cutri R., Schneider S., Sktutskie M., Huchra J. P., 2000, AJ, 119, 2498
- Kissler-Patig et al. (2006) Kissler-Patig M., Jordán A., Bastian N., 2006, A&A, 448, 1031
- Kormendy (1985) Kormendy J., 1985, ApJ, 295, 73
- Kouwenhoven & de Grijs (2008) Kouwenhoven M., de Grijs R., 2008, A&A, 480, 103
- Kroupa (2002) Kroupa P., 2002, Science, 295, 82
- Kundu (2008) Kundu A., 2008, arXiv:0805.0376
- Larsen & Richtler (2000) Larsen S. S., Richtler T., 2000, A&A, 354, 836
- Lewis et al. (2007) Lewis G. F., Ibata R. A., Chapman S. C., McConnachie A., Irwin M. J., Tolstoy E., Tanvir N. R., 2007, Mon. Not. R. Astron. Soc., 375, 1364
- Lotz et al. (2004) Lotz J., Miller B., Ferguson H., 2004, ApJ, 613, 262
- McLaughlin et al. (2008) McLaughlin D., Barmby P., Harris W., Forbes Harris G., 2008, Mon. Not. R. Astron. Soc., 384, 563
- McLaughlin (2000) McLaughlin D. E., 2000, AJ, 539, 618
- McLaughlin & van der Marel (2005) McLaughlin D. E., van der Marel R. R., 2005, ApJS, 161, 304
- Mamon & Lokas (2005) Mamon G., Lokas E. L., 2005, Mon. Not. R. Astron. Soc., 363, 705
- Mandelbaum et al. (2006) Mandelbaum R., Seljak U., Kauffmann G., Hirata C., Brinkmann J., 2006, Mon. Not. R. Astron. Soc., 368, 715
- Maraston et al. (2004) Maraston C., Bastian N., Saglia R. P., Kissler-Patig M., Schweizer F., Goudfrooij P., 2004, A&A, 416, 467
- Martini & Ho (2004) Martini P., Ho L. C., 2004, ApJ, 610, 233
- Mashchenko & Sills (2005) Mashchenko S., Sills A., 2005, ApJ, 619, 243
- Mateo (1998) Mateo M., 1998, Annu. Rev. Astron. Astrophys., 36, 435
- Matković & Guzmán (2005) Matković A., Guzmán R., 2005, Mon. Not. R. Astron. Soc., 362, 289
- Matsushita (2001) Matsushita K., 2001, ApJ, 547, 693
- Mei et al. (2007) Mei S., Blakeslee J., Cote P., et al. 2007, ApJ, 655, 144
- Metz et al. (2008) Metz M., Kroupa P., Libeskind N., 2008, ApJ, 680, 287
- Meylan et al. (2001) Meylan G., Sarajedini A., Jablonka P., Djorgovski S. G., Bridges T., Rich R. M., 2001, AJ, 122, 830
- Michard (2005) Michard R., 2005, A&A, 441, 451
- Mieske et al. (2008) Mieske S., Hilker M., et al. A. J., 2008, arXiv:0806.0374
- Mieske et al. (2002) Mieske S., Hilker M., Infante L., 2002, A&A, 383, 823
- Mieske & Kroupa (2008) Mieske S., Kroupa P., 2008, ApJ, 677, 276
- Mobasher et al. (1986) Mobasher B., Ellis R. S., Sharples R. M., 1986, Mon. Not. R. Astron. Soc., 223, 11
- Moore (1996) Moore B., 1996, ApJ, 461, 13
- Moore et al. (2002) Moore S. A. W., Lucey J. R., Kuntschner H., Colless M., 2002, Mon. Not. R. Astron. Soc., 336, 382
- O’Sullivan et al. (2001) O’Sullivan E., Forbes D. A., Ponman T. J., 2001, Mon. Not. R. Astron. Soc., 328, 461
- Pedraz et al. (2002) Pedraz S., Gorgas J., Cardiel N., Sánchez-Blázquez P., Guzmán R., 2002, Mon. Not. R. Astron. Soc., 332, L59
- Penarrubia et al. (2008) Penarrubia J., Navarro J. F., McConnachie A. W., 2008, ApJ, 673, 226
- Piotto et al. (2007) Piotto G., Bedin L. R., Anderson J., King I. R., Cassisi S., Milone A. P., Villanova S., Pietrinferni A., Renzini A., 2007, ApJ, 661, L53
- Proctor et al. (2008) Proctor R., Lah P., Forbes D. A., Colless M., Couch W. J., 2008, arXiv:0803.4032
- Prugniel & Simien (1997) Prugniel P., Simien F., 1997, Astron. Astrophys., 321, 111
- Rejkuba et al. (2007) Rejkuba M., Dubath P., Minniti D., Meylan G., 2007, A&A, 469, 147
- Rijcke et al. (2005) Rijcke S. D., Michielsen D., Dejonghe H., Zeilinger W. W., Hau G. K. T., 2005, A&A, 438, 491
- Ripepi et al. (2007) Ripepi V., Clementini G., Criscienzo M. D., Smith A., 2007, ApJ, 667, 61
- Siegel et al. (2007) Siegel M. H., Dotter A., Majewski S. R., Sarajedini A., Chaboyer B., Nidever D. L., Anderson J., Marín-Franch A., Rosenberg A., Bedin L. R., Aparicio A., King I., Piotto G., Reid I. N., 2007, ApJ, 667, L57
- Simien & Prugniel (2002) Simien F., Prugniel P., 2002, A&A, 384, 371
- Trager et al. (2000) Trager S. C., Faber S. M., Worthey G., González J. J., 2000, AJ, 120, 165
- Trujillo et al. (2004) Trujillo I., Burkert A., Bell E., 2004, ApJ, 600, 39
- Trujillo et al. (2001) Trujillo I., Graham A., Caon N., 2001, Mon. Not. R. Astron. Soc., 326, 869
- Valluri et al. (2005) Valluri M., Ferrarese L., Merritt D., Joseph C., 2005, ApJ, 628, 137
- van den Bergh et al. (1991) van den Bergh S., Morbey C., Pazder J., 1991, ApJ, 375, 594
- van der Marel et al. (1998) van der Marel R. P., Cretton N., de Zeeuw P. T., Rix H., 1998, ApJ, 493, 613
- van Zee et al. (2004) van Zee L., Skillman E. D., Haynes M. P., 2004, AJ, 128, 121
- Wehner & Harris (2007) Wehner E. M. H., Harris W. E., 2007, ApJ, 668, L35
- Whitmore (2000) Whitmore B. C., 2000, arXiv:0012546
- Zaritsky et al. (2006) Zaritsky D., Gonzalez A. H., Zabludoff A. I., 2006, ApJ, 638, 725
- Zaritsky et al. (2007) Zaritsky D., Zabludoff A., Gonzalez A., 2007, arXiv:0711.2071
- Zibetti et al. (2002) Zibetti S., Gavazzi G., Scodeggio M., Franzetti P., Boselli A., 2002, ApJ, 579, 261
Table 1. Data Parameters
Milky Way and M31 Globular Clusters
| Name | Distance | Reference | |||
|---|---|---|---|---|---|
| (Mpc) | (km s-1) | (arcsec) | (mag.) | ||
| NGC 104 | 0.005 | 11.5 | 167.4 | 1.30 | 1, 2 |
| NGC 1851 | 0.012 | 10.4 | 31.2 | 4.39 | 1, 2 |
| NGC 1904 | 0.013 | 5.2 | 48.0 | 5.67 | 1, 2 |
| NGC 3201 | 0.005 | 5.2 | 160.8 | 3.98 | 1, 2 |
| … | …. | …. | … | … | … |
An asterisk implies the velocity dispersion has been corrected to a central value following Section 2. References are for the velocity dispersion and the half light radii respectively. They are 1. Mc Laughlin & van der Marel (2005), 2. Harris (1996),