Impact of Rotation on Neutrino Emission
and Relic Neutrino Background from Population III Stars
Abstract
We study the effects of rotation on the neutrino emission from Population III (Pop III) stars by performing a series of two-dimensional rotational collapse simulations of Pop III stellar cores. Our results show that rotation enhances the neutrino luminosities and the average energies of emitted neutrinos. This is because the thermalized inner core, which is the dominant neutrino source from Pop III stars, can be enlarged, due to rotational flattening, enough to extend the inner core outside the neutrinospheres. This is in sharp contrast to the case of spherical collapse, in which the case of inner core shrinks deeper inside the neutrinospheres before black hole formation, which hinders the efficient neutrino emission. In the case of rotational core-collapse, the emitted neutrino energies are found to become larger in the vicinity near the pole than the ones near the equatorial plane. These factors make the emergent neutrino spectrum broader and harder than the spherical collapse case. By computing the overall neutrino signals produced by the ensemble of individual rotating Pop III stars, we find that the amplitudes of the relic neutrinos, depending on their star formation rates, can dominate over the contributions from ordinary core-collapse supernovae below a few MeV. A detection of this signal could be an important tool to probe star formation history in the early universe.
1 Introduction
One of the most important goals in modern cosmology is to understand how the first stars formed at the end of the dark ages, and how they transformed the initially simple, homogeneous universe into a state of ever increasing complexity (e.g., Barkana & Loeb, 2001; Bromm & Larson, 2004; Loeb, 2006). The first stars, so called Population III (Pop III), are predicted to have been predominantly very massive with (e.g., Nakamura & Umemura, 2001; Abel et al., 2002; Bromm et al., 2002; Yoshida et al., 2006; O’Shea & Norman, 2007). During their evolutions, the central core is thought to experience an electron-positron pair creation instability after carbon burning, which reduces the thermal energy of the core and eventually triggers gravitational core-collapse. For stellar masses less than , rapid nuclear burning releases a large amount of energy sufficient to entirely disrupt the star as pair-instability supernovae. More massive stars, which also encounter pair-instability, are so tightly bound that the fusion of oxygen is unable to reverse infall. Such stars are thought to collapse into black holes (BHs) (Bond et al., 1984; Fryer et al., 2001), which we investigate in this paper. Information about the formation and evolution of the Pop III stars might be observationally obtained from reionization (Alvarez et al., 2006), the infrared background (Dwek et al., 2005), nucleosynthesis yields (Heger & Woosley, 2002; Iwamoto et al., 2005), gamma-ray bursts (Schneider et al., 2002; Bromm & Loeb, 2006), and gravitational waves (Buonanno et al., 2005; Suwa et al., 2007a). However at present, it is still unclear whether or not one can obtain clear information about Pop III stars directly from observations.
Recently, neutrinos, which should have been emitted in large numbers at the phase of core-collapse, are expected to be new eyes to unveil the mysteries of the first stars. Since the direct detection is unlikely because of their large distances, a diffuse background as relic neutrinos could potentially be observable. In an analogous context, the relic neutrino background from ordinary core-collapse supernovae have been studied elaborately (Bisnovatyi-Kogan & Seidov, 1984; Totani et al., 1996; Kaplinghat et al., 2000; Ando et al., 2003; Ando & Sato, 2004). Since the physics involved in relic neutrinos covers a very wide range of topics, e.g., cosmic star formation rate and the collapse dynamics, detecting the relic neutrinos or even setting limits on their flux are expected to give us quite useful and unique implications not only for the understanding of the collapse physics itself, but also for various fields of astrophysics and cosmology.
The detectability of the relic neutrinos from Pop III stars has been discussed by several papers. Iocco et al. (2005) estimated the amplitudes of the relic neutrinos produced during the nuclear burning phases as well as the core collapse phase, assuming a baryonic fraction of Pop III stars of and monochromatic progenitors with a mass of . Daigne et al. (2005) investigated the relic neutrino background produced by an early burst of Pop III stars taking into account a “normal mode” of the star formation at low redshift. The framework of hierarchical structure formation, on which their computation relies, is based on the cosmic star formation histories, which are constrained by the observed star formation rate at redshift , the observed chemical abundances in damped Lyman absorbers and in the IGM, and allow for an early reionization of the Universe at . Regardless of the differences in the treatment of the star formation histories, these studies concluded that the typical energy of the relic neutrino background is lowered as low as MeV or sub-MeV due to the cosmological redshift so that the detection is out of the question with presently known experimental techniques. However it should be noted that in their studies, the neutrino flux and energy emitted from the Pop III stars are set by hand due to the lack of Pop III star collapse simulations.
For more precise estimates of relic neutrinos from Pop III stars, we have to perform the hydrodynamical simulations. So far, there have been only a few simulations studying the gravitational collapse of Pop III stars with BH formation including appropriate microphysical treatment (Fryer et al., 2001; Nakazato et al., 2006; Suwa et al., 2007b). Nakazato et al. (2006) performed a spherically symmetric general relativistic simulation in a wide range of masses (), in which the state-of-the-art neutrino physics are taken into account. Their detailed calculations revealed the properties of the emergent neutrino spectrum, and based on that, they estimated the relic neutrino background and found that the detection for the spherically collapsing Pop III stars is difficult for the currently operating detectors. Meanwhile current wisdom tells us that very metal poor stars lose very small amounts of mass and angular momentum through radiatively driven stellar winds so that Pop III stars may collapse with large angular momentum (Heger et al., 2003). So stellar rotation might vary the spectrum of emitted neutrinos and affect its potential observability, which is the motivation of this study. Fryer et al. (2001) investigated the collapse of a rotating Pop III star of mass with gray neutrino transport simulations and discussed effects of rotation on the emitted luminosities. They, however, investigated only one rotational model. Considering the uncertainty of the angular momentum distributions of the Pop III stars, a more broad study is required. More recently, we implemented a series of two-dimensional magnetorotational core-collapse simulations of Population III stars (Suwa et al., 2007b), in which our interest was placed on the MHD effects on the formation of the jets.
In this study, we focus on the effects of rotation on the neutrino emission during the core-collapse phase of Pop III stars. For this purpose, we carry out two-dimensional simulations of rotational core-collapse of Pop III stars, changing the initial strength of the angular momentum in a parametric manner. By so doing, we systematically investigate the dependence of the luminosity, the average energy, and the spectrum of neutrinos upon the rotation strength. We also pay attention to the anisotropy of the emergent neutrino energies, that is, the neutrino emission at polar direction and in the equatorial plane. Using the spectrum of single Pop III stars, we calculate the number flux of the relic neutrino background by summing up the contribution from individual Pop III stars and discuss their detectability.
This paper is organized as follows: In the next section, we briefly introduce our numerical methods and the initial models. In §3 and §4, we present the numerical results. We start with the outline of the dynamics and neutrino emission in the case of spherical collapse (§3) and then move on to discuss the effects of rotation on the dynamics and the neutrino luminosity (§4.1), the neutrino energies (§4.2) and the spectrum (§4.3). §5 is devoted to summary and discussion.
2 Numerical Techniques and Initial Models
As for the hydro solver, we employ the ZEUS-2D code (Stone & Norman, 1992) as a base and added major changes to include the microphysics appropriate for the simulation of Pop III stars. First we have added an equation for the electron fraction in order to treat electron and positron captures and have approximated the neutrino transport by the so-called leakage scheme (Ruffert et al., 1996; Kotake et al., 2003; Rosswog & Liebendörfer, 2003; Takiwaki et al., 2007). We consider three neutrino flavours: electron neutrinos, , electron anti-neutrinos, , and the heavy-lepton neutrinos, , which are collectively referred to as . Reactions of , pair, photo, and plasma processes are included using the rates by Itoh et al. (1989). As for the equation of state, we have incorporated the tabulated one based on relativistic mean field theory (see, Shen et al., 1998). In our 2D calculations, axial symmetry and reflection symmetry across the equatorial plane are assumed. Spherical coordinates are employed with logarithmic zoning in the radial direction and linear zoning in . One quadrant of the meridian section is covered with 300 () 30 () mesh points. We also calculated some models with 60 angular mesh points, however, there was no significant difference. Therefore, we report only the results obtained from the models with 30 angular mesh points. General relativistic gravity is taken into account approximately by an “effective relativistic potential” according to Marek et al. (2006), which is newly added in our code.
In this paper, we set the mass of the Pop III star to be . This is consistent with the recent simulations of the star-formation phenomena in a metal free environment, providing an initial mass function peaked at masses (see, e.g., Nakamura & Umemura, 2001). We choose the value because we do not treat the nuclear-powered pair instability supernovae () and also to facilitate the comparison with the previous study, which employed the same stellar mass (Fryer et al., 2001).
We start the collapse simulations with a core for the star. The core, which is the initial condition of our simulations, is produced in the following way. According to the prescription in Bond et al. (1984), we set the polytropic index of the core to and assume that the core is isentropic with per nucleon (Fryer et al., 2001) with a constant electron fraction of . We adopt a central density of at which the temperature of the central regions become high enough to photodisintegrate the iron (K), thus initiating the collapse. Given the central density, the distribution of electron fraction, and the entropy, we numerically construct the hydrostatic structures of the core.
Since we know little about the angular momentum distribution in the cores of Pop III stars, we assume the shellular rotation follows the initial rotation law:
| (1) |
where is an angular velocity, is a radius, and and are model parameters, which determines a total angular momentum and the degree of differential rotation, respectively. In this paper, we fixed the value of as cm. Since the radius of the outer edge of the core is taken to be as large as cm, the above profile represents a mildly differentially rotating core. Changing the initial rotational energies by varying the values of , we compute 8 models, namely, one spherical and 7 rotational models. By so doing, we hope to see clearly how the dynamics and the neutrino emission deviate from those in the spherical case. We change the initial values of from 0.01 to 2 , where represents the ratio of the rotational to the gravitational energy. We take the model with 0.5 as the canonical rotating model. This is because the rotation rate is taken from the stellar evolution calculations of extremely rapidly rotating cores of massive stars (Heger et al., 2000) pushed by the study that Pop III stars could rotate rapidly due to insufficient mass-loss in the main sequence stage (Heger et al., 2003).
The shape of the neutrino spheres is important for analyzing the properties of neutrino emission. Following the common practice, we define the neutrinosphere, , satisfies the condition
| (2) |
where is the mean free path of neutrinos. We perform the integration for each angular bin to obtain . It should be noted that the notion of neutrinosphere is rather ambiguous. Neutrino reactions are highly energy dependent, and so the neutrinosphere should be as well. In theory, we should distinguish the last scattering surface from the surface of last energy exchange (Janka, 1995). However, we stick to this approximate notion here for simplicity.
3 Spherical Collapse
We first outline collapse dynamics in the case of spherical symmetry. In Figure 1, we show the time evolution of density (top left), temperature (top right), and radial velocity (bottom left) as a function of radius. Also shown is the radial velocity as a function of the mass coordinate (bottom right). We show the results for five time slices before BH formation (see figure for detail). As indicated in this figure, the core collapse of a very massive star can be divided into two phases; the infall phase ( and ms) and the accretion phase (from to ms).
The infall phase sets in due to the gravitational instability induced by the photodisintegration of iron and the neutronisation that have the effect of reducing the pressure support at the core of the star, triggering a rapid collapse of the core just as an ordinary supernovae progenitor. However, there are several important differences between the structures of very massive stars and ordinary supernovae. As noted by previous works (e.g., Bond et al., 1984; Fryer et al., 2001; Nakazato et al., 2007), the entropy in the more massive core is larger and thus favors more complete photodisintegration of heavy elements and -particles so that the source of instability is reduced. This leads a thermally stabilized core 111 The stability of the core depends on the adiabatic index. If the average adiabatic index is less than , the star is unstable (Shapiro & Teukolsky, 1983). In the case of very massive stars, the pressure is dominated by radiation pressure, whose adiabatic index is . Since there are additional components such as the non-relativistic nucleon, whose adiabatic index is , the mean adiabatic index is between and so that the core is mildly stabilized. unlike ordinary supernovae, whose core is stabilized by nuclear forces and neutron degeneracy pressure. The core is divided into two distinct regions: the subsonic, “homologous” inner core and the supersonic outer core. The inner core becomes thermalized and stabilized.
In the accretion phase, material in the outer core accretes onto the inner core after the thermal stabilization of the inner core, leading to the increase in mass of the inner core. We here note that the inner core continues to shrink after stabilization due to the accretion from the outer core. These features are seen in Figure 1. In the top panels and bottom left panel, the accretion shock can be seen at cm for ms and cm for ms before BH formation. The bottom right panel shows the increasing mass of the inner core. Because the outer core is out of sonic contact with its inner counterpart, an accretion shock is formed between the two regions 222This accretion shock is similar to the stalled and hydrostatic shock front in the framework of ordinary core collapse supernovae. The difference is that there is no outgoing shock wave for very massive stars due to the softness of the equation of state inside the inner core.. It should be noted that the region just behind the accretion shock, that is the surface of the inner core, is the main source of neutrinos. This can be seen in Figure 2, which shows snapshots of the cooling rate of neutrinos, , as a function of the mass coordinate. Comparing with Figure 1, we find that the maximum cooling rate is just behind the accretion shock.
In the case of very massive stars, the inner core is more massive than the maximum mass of neutron stars so that these stars collapse to black holes directly. As for the non-rotating model, the initial mass of the BH is . This is significantly smaller than our previous result, for the non-rotating model in Suwa et al. (2007b), because of general relativistic effects, newly implemented in this study. Although the core is stable in Newtonian gravity, the hot core is not stable when general relativistic effects are considered because the thermal energy also contributes to the gravitational potential. In our case the temperature is so high that general relativistic effects become important because the critical temperature, above which the core becomes unstable, is , where is the core mass (Shapiro & Teukolsky, 1983). Our results show the inner core mass is and the central temperature is K (see the discontinuity of bottom right panel in Figure 1 for core mass and top right panel for temperature). This instability drives further collapse of the inner part of the inner core, which can be seen in the radial velocity profile (see again bottom panels in Figure 1). This feature is also seen in Nakazato et al. (2006), which is a fully general relativistic simulation (see Figure 2 in their result). Although the BH is smaller than the inner core at first, the inner core will be soon swallowed completely. Here we note that following Fryer et al. (2001); Suwa et al. (2007b), BH formation is ascribed to the condition , where are the speed of light, the gravitational constant, and the mass coordinate, respectively. After formation, we excise the region inside and then treat it as an absorbing boundary. Then, we enlarge the boundary of the excited region to take into account the growth from the mass infalling into the central region. Although it is not accurate at all to refer to the central region as a BH, we adhere to this simplification in order to follow and explore the dynamics later on.
Next, we mention the neutrino emission and its relation to dynamics. The time evolution of the neutrino luminosity, , is shown in Figure 3. As the collapse proceeds, the density and temperature of the central both increase, increasing the neutrino luminosity. As the density increases during core collapse, the opacity rises and the neutrinosphere is formed, in which neutrino emission-absorption equilibrium is achieved. The relation of the radii of the inner core surface, , and neutrinosphere, , is very important for the luminosity of neutrinos because the inner core is the main source of neutrino emission as already shown in Figure 2. Roughly speaking, if , the emissivity is the largest just behind the shock so that the luminosity is also large. On the other hand, the luminosity becomes small if because the emitted neutrinos can not escape directly and interact with matter. In this case, the maximum value of the emissivity appears between the inner core surface and the neutrinosphere. In Figure 4 we show the evolution of radii of the inner core, neutrinospheres, and black hole as a function of time. The inner core surface goes down inside the neutrinospheres, which results in the peak in the evolution of luminosity shown in Figure 3 (see dots A and B in Figure 3 and 4). In addition, after BH formation the luminosity decreases due to the absorption of neutrino emitting matter. Finally, the neutrinosphere gets swallowed by the BH and the emission of neutrinos almost terminates.
4 Rotational Collapse
4.1 Features of Neutrino Luminosity
We now investigate how rotation affects the properties of the neutrino emission. Peak luminosity and total energy emitted by neutrinos for different values of the initial rotation rate, , are shown in Table 1. Interestingly and maybe against the intuition, it is found that the peak neutrino luminosity increases with the initial rotation rate (see Table 1). We point out that this is because the inner core can partly extend outside the neutrinosphere due to rotation so that is achieved, and the degree of the deformation becomes larger for more rapidly rotating models. In the following, we explain this feature in more detail.
Figures 4 and 5 show the time evolution of radii of neutrinospheres and inner core for non-rotating model and rotating model (), respectively. Note again that we set the model with to be the reference rotating model according to Heger et al. (2000, 2003). For the non-rotating model (Figure 4), the inner core becomes smaller than the surfaces of all of the neutrinospheres just before BH formation (see evolutions after B in Figure4). On the other hand, for the rotating model, the inner core is broadened in the equatorial plane due to the centrifugal forces (see left panel of Figure 5) and exists outside of the neutrinosphere of . Moreover, the inner core surface is located outside of the neutrinosphere of along the polar axis (right panel). The above effects make the neutrino luminosities larger for the rotating models. In Figure 6, the global shapes of neutrinospheres of and , and the inner cores for spherical model and the rotating models with , and are presented. It is clearly seen from the comparison with the non-rotating model that neutrinospheres are more deformed for more rapidly rotating models. As the initial rotation rate becomes larger, the deformed inner core is shown to have larger surfaces approaching the neutrinospheres than the non-rotating model. As for the model with , the inner core extends outside the neutrinosphere of entirely.
The time evolution of the neutrino luminosity for models with different initial strength of rotation are shown in Figure 7. For slow rotation models (), the luminosity properties of and are shown not to depend on the strength of rotation. On the other hand, the luminosity of gets larger as the initial rotation gets faster. This is because the radius of the neutrinosphere of is smaller than those of and so that is most sensitive to the rotation. The inner core surface, which is in the neutrinospheres for the non-rotating model, is enlarged by rotation and falls close to the neutrinosphere of on the equatorial plane, which leads to the increase of luminosity. In fast rotation models (), the luminosity of and also get larger with rotation for the same reasons as for the case. The luminosity of , however, gets smaller as the rotation gets faster. This feature was already seen in Suwa et al. (2007b). This is because rapid rotation suppress the contraction of the most inner part causing the density and temperature not to increase as much as in the case of slower rotation. Therefore, the emissivity of neutrinos also does not increase very much. This suppression affects the and emission less because neutrinospheres of these species are located at larger radii.
From Figure 7, we can see drastic decreases in neutrino luminosities near the epoch of black hole formation, particularly for the rapidly rotating models. The slope of the neutrino luminosity depends on the relative position of the neutrinospheres and the inner core. For slow rotation models, only shows such a decrement because the neutrinosphere of is the smallest so that it is absorbed first and is inside of the BH when the BH forms. On the other hand, the neutrinospheres of and remain outside of the BH at the onset of BH formation and are absorbed as the BH grows. The luminosity of and decrease with the dynamical timescale ( ms) of the region of the neutrinospheres. For fast rotation models, all species show the drastic decrease because all neutrinospheres are partly or entirely in the BH region when it forms (see Figure 5, again) because the rapid rotation leads to a larger initial mass of the BH (see Suwa et al., 2007b).
We find that rotation enhances the total energy released by neutrinos. The total energy emitted in the form of neutrinos during the collapse is summarized in Table 1. It can be seen that for the non-rotating model the total radiated energy amounts to ergs. This result is in good agreement with the simulation of Nakazato et al. (2006), who included neutrino transport during the collapse of a 300 Pop III star. They found a total energy output of ergs. The stronger rotation models show larger energy emission. This is because the rotation enhances the neutrino luminosity as already described. In addition the rotation delays BH formation by the centrifugal force, which leads to a longer duration of neutrino emission. These two effects account for the increase of radiated energy by neutrinos as the strength of rotation increases.
4.2 Features of Neutrino Energy
We discuss the effects of rotation on the emitted neutrino energies in this subsection. We consider the averaged neutrino energy, , where is number density of emitted neutrinos. Figure 8 shows the difference of the average energy as a function of . It can be seen that the average energies increase with the initial rotation rate for irrespective of the flavors, which is basically the same reason as discussed in the previous subsection. It should be noted that the energy of is more sensitive to the rotation strength than the other species because the neutrinosphere of forms the deepest in the core. In fact, only is affected for relatively slow rotation (). As the rotation becomes stronger, the energies of and are gradually changed. Although the average energies of neutrinos basically follow the standard order sequence, namely as described in Iocco et al. (2005), is found to be smaller than for the model with . The strong centrifugal force interrupts the contraction of the inner part of the core, leading to the suppression of the releasable gravitational energy and thus smaller energy of neutrinos.
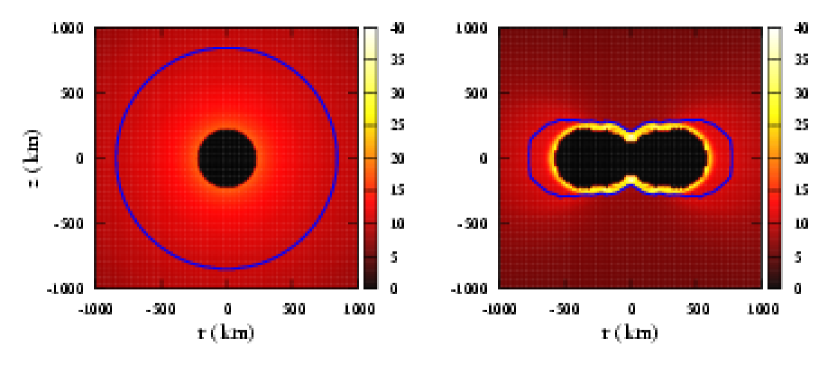
Next, we focus on the anisotropy of the neutrino energies and emission. The spatial distribution of the average energy of just before BH formation, with and without rotation are depicted in Figure 9. It can be seen that due to the rotational flattening of the neutrinosphere (blue line) near the polar regions (bottom panel), the neutrinos achieve the higher temperature just inside the neutrinosphere, leading to the emission of higher energy neutrinos. In addition, the direction of anisotropy of the energies can be seen in the rotating model. In the polar direction, the inner core surface is almost coincident with the neutrinosphere (see Figure 5 and 6, again) so that neutrinos with high energy produced just inside the inner core can escape. On the other hand, the optical depth is at the inner core on the equatorial plane and few neutrino with high energy can escape. These effects, irrespective of the neutrino flavors, make the neutrino spectrum of the rotating model broader and harder than the non-rotating model, which will be useful for the discussion in the following subsection.
4.3 Neutrino Spectrum and Relic Background
In this subsection, we discuss the features of the neutrino spectrum and the effects of rotation. We calculate the neutrino luminosity spectrum as follows:
| (3) |
where is the emissivity for ( and ) and is the normalized Fermi-Dirac distribution,
| (4) |
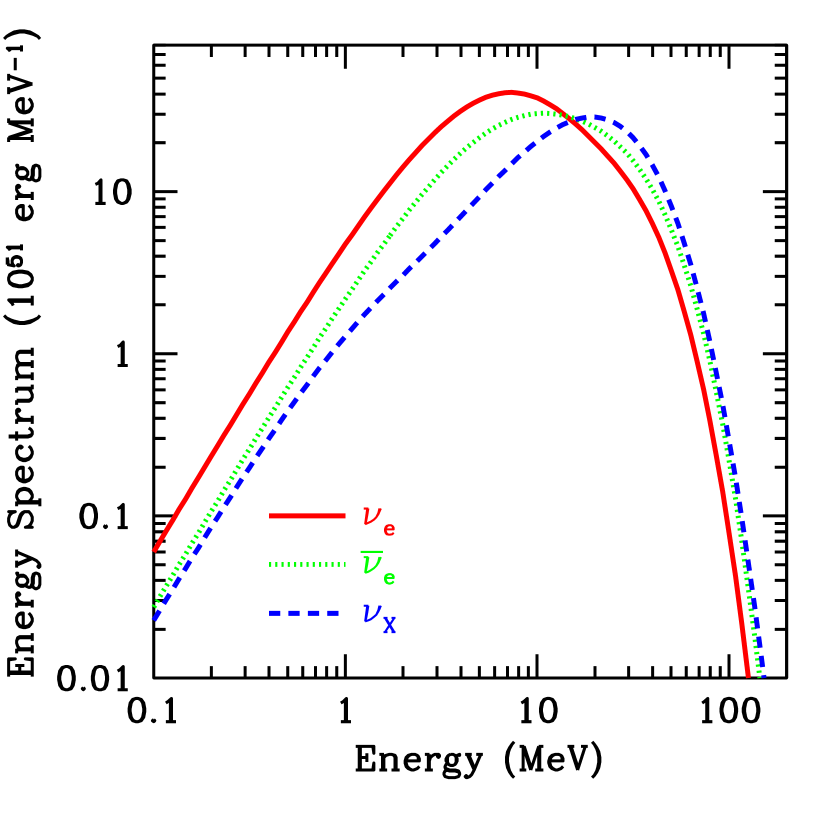
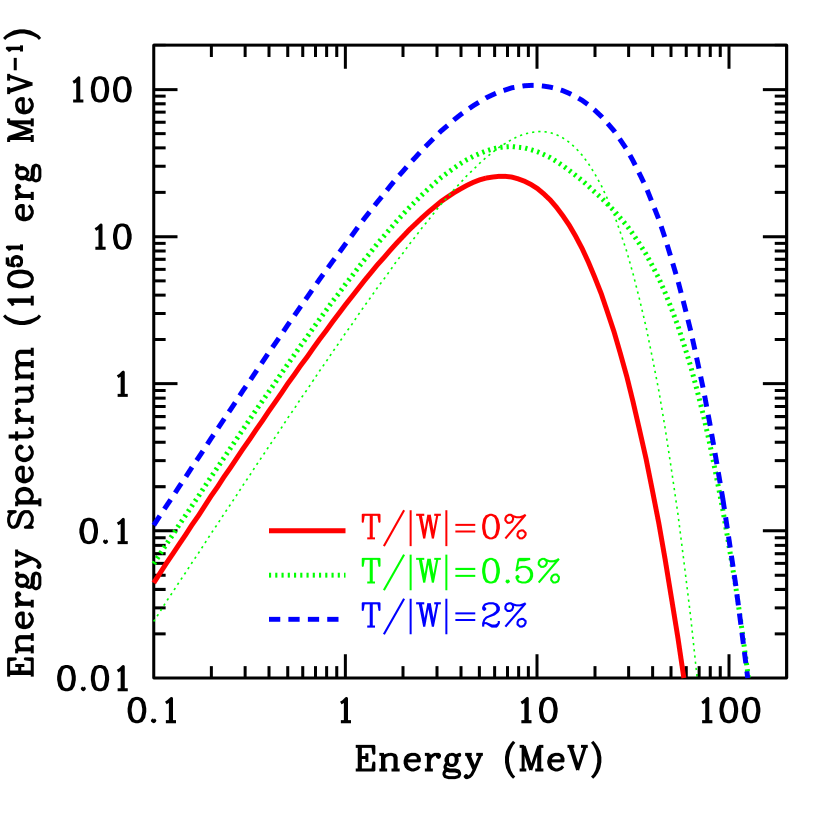
where is the energy of emitted neutrinos in the source frame and is the effective neutrino temperature with being the local average energy of . Figure 10 shows the time integrated energy spectrum, , of , and for the model with . It can be seen that the spectrum of (dashed line) is harder than (solid line) and (dotted line) as already described in the previous subsection. Figure 11 shows time integrated energy spectrum of for models with and . It is obvious that the spectra of rotating models (dashed and thick dotted lines) are higher and harder than non-rotating model (solid line). In this figure, the thin dotted line represents the single energy spectrum. We use the total energy emitted by , , and total average energy, , of the model with for this spectrum to compare the spectrum of the model with the same rotation strength. By making the comparison between thin and thick dotted lines, it can be seen that the calculated spectrum (thick dotted line) is harder than one with a single energy. This is because the neutrino temperature is not a simple, single temperature component, but rather consists of multiple temperature components, depending on the time and position. It should be noted that the time evolution of the average energy from Pop III stars is drastic unlike the ordinary core-collapse supernovae, which do not show significant change of the average energy on the cooling phase of proto-neutron stars (see, e.g., Liebendörfer et al., 2005), so that the spectrum becomes broader than the ordinary supernovae. The single energy spectrum employed in previous works (Iocco et al., 2005; Daigne et al., 2005) should have led to underestimates in the neutrino number in the high energy regime.
We are now in a position to discuss the relic neutrino background from Population III stars. For simplicity, we assume that all Pop III have identical emission characteristics. According to Iocco et al. (2005) the differential flux expected at Earth can be written as
| (5) |
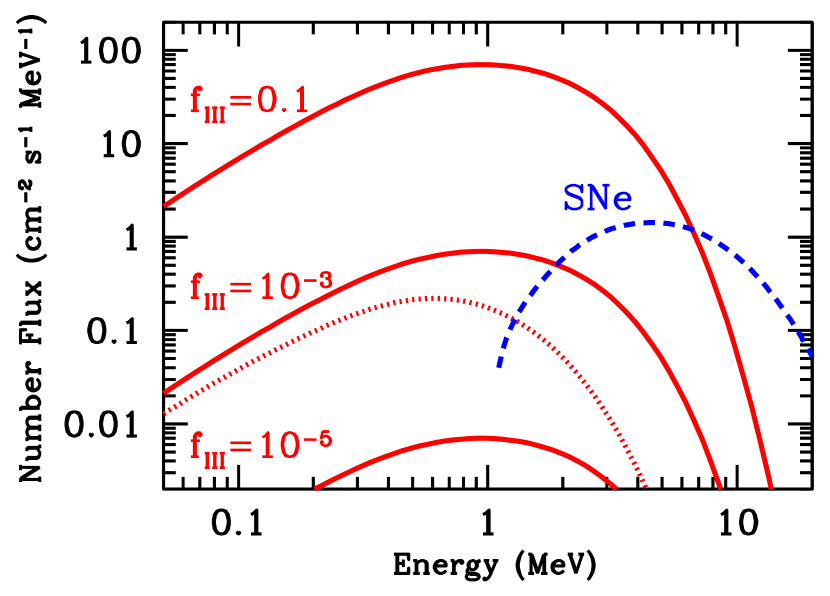
where is the observed energy of neutrinos, is the fraction of all baryons going through Pop III, is the cosmic microwave background photon density at redshift zero, is the cosmic baryon-photon ratio, is the nucleon mass, is the mass of Pop III stars, is normalized star formation rate, and represents the number spectra at the source frame, which is also calculated by volume integration with the normalized Fermi-Dirac distribution (Eq. (4)). We assume that the star formation rate is concentrated around a redshift , that is, . In addition, we assume that all Pop III stars have the same mass, . We used the result of the model to calculate the relic neutrino flux. Since star formation history is not well constrained observationally at high z, we consider samples of as , , and . Figure 12 shows the calculated number flux spectrum of . If we adopt the largest value for , the diffuse anti-electron neutrinos from Pop III dominates those from ordinary supernovae (dashed line) below 7 MeV. The dotted line represents the flux from the model with and . Comparing with the second solid line from the top, we can see the amplification of the relic neutrino flux by the stellar rotation.
5 Summary and Discussion
We performed a series of 2D hydrodynamic simulations of rotational collapse of Pop III stars. We computed 8 models, changing the initial strength of the angular momentum in a parametric manner. We studied systematically the deformation of neutrinospheres and investigated the degree of anisotropic neutrino emission from the point of view of the neutrino luminosity and the average energy, and their impacts on the neutrino spectrum. Then we found the following,
-
1.
The neutrino luminosity increases for more rapidly rotating cores. This is because the inner core, which is the dominant neutrino source, is deformed due to the rotation and can extend outside the neutrinospheres. In particular, is most sensitive to the rotation because its neutrinosphere is located at the smallest radius and nearest to the inner core. The total energy emitted by neutrinos also increases with the strength of rotation.
-
2.
The average energy of emitted neutrinos gets larger as rotation becomes faster. In addition, the energy is larger in the polar direction than in the equatorial plane due to the rotation. The neutrino spectrum gets broader and harder for rotating models. As a result, the number spectrum of the relic neutrinos also gets harder so that the relic neutrinos from Pop III stars overwhelm those from ordinary core-collapse supernova below MeV, provided a fraction of all baryons forms Pop III stars.
As for our numerical computations, we shall address a few of our assumptions. In this study, we mimicked the neutrino transfer by the leakage scheme. Although the scheme is a radical simplification, we checked that in the case of spherical collapse, the obtained integral quantities such as the total energy emitted by neutrinos and their average energy are very close to the results by Nakazato et al. (2006), in which the Boltzmann neutrino transport was solved. We ignored the angle dependence of the neutrino emission, assuming that the neutrino track is radial. This approximation will break down just before BH formation because the neutrinosphere becomes oblate and the neutrino emission would be highly aspherical. Nonetheless, the multi-angle and multi-dimensional neutrino transfer is still computationally prohibitive (recently reported by Ott et al., 2008, in the framework of core-collapse supernova). The angle dependence is expected to make the neutrino spectrum harder. This is because the neutrinos produced in the vicinity of the equatorial plane might be able to escape to the polar direction even if they cannot escape radially, thus it should be taken into account. Furthermore the Newtonian simulation in this paper, albeit with the general relativistic corrections, is nothing but an idealized study to describe the dynamics with BH formation. It is by no means definitive. In order to explore these phenomena in more detail will require fully general relativistic simulations (e.g., Shibata, 2003; Sekiguchi & Shibata, 2005; Liu et al., 2007, for BH formation of massive stars) but with the microphysical ingredients at least at the same level of this study, which is beyond the scope of this paper.
Bearing these caveats in mind, we state some discussions and speculations about the relic neutrinos from Pop III stars. In estimating the relic neutrino background, we employed a parameter , the baryon fraction of Pop III stars. Because this parameter is entirely unknown so far, we employed three values of , , and . The largest value is obtained for the explanation of the infrared background excess by UV photons from Pop III stars (Santos et al., 2002; Dwek et al., 2005). So our estimation should be interpreted as giving an upper bound. As for the star formation history, we employed only the delta function one because the baryon fraction dominates the uncertainty and the other ones such as the evolution of star formation rate are minor corrections (see, Iocco et al., 2005; Daigne et al., 2005; Nakazato et al., 2006, for the discussion of the dependence on the star formation history). In addition, we assume that all Pop III stars have the same mass of for simplicity. The dependence of the progenitor masses should be also clarified, although the qualitative features induced by rotation studied here will not change.
The predicted foregrounds for the relic neutrinos in the relevant energy range computed here are the neutrinos produced in the Sun and the anti-neutrinos from nuclear reactors. These (anti-)neutrinos, however, could be removable in principle because the distribution of these foregrounds are not isotropic. Other possible foregrounds, which are isotropic, are extra-galactic neutrinos produced by thermonuclear reactions in stars (Porciani et al., 2004). On the other hand, as for anti-neutrinos the contribution of Pop III stars are dominant in the range below a few MeV. Thus we speculate that the detection of this signature could be the first direct probe of this as yet unseen metal-free first generation of stars.
References
- Abel et al. (2002) Abel, T., Bryan, G. L., & Norman, M. L. 2002, Science, 295, 93
- Alvarez et al. (2006) Alvarez, M. A., Bromm, V., & Shapiro, P. R. 2006, ApJ, 639, 621
- Ando & Sato (2004) Ando, S. & Sato, K. 2004, New Journal of Physics, 6, 170
- Ando et al. (2003) Ando, S., Sato, K., & Totani, T. 2003, Astroparticle Physics, 18, 307
- Barkana & Loeb (2001) Barkana, R. & Loeb, A. 2001, Phys. Rep., 349, 125
- Bisnovatyi-Kogan & Seidov (1984) Bisnovatyi-Kogan, G. S. & Seidov, Z. F. 1984, New York Academy Sciences Annals, 422, 319
- Bond et al. (1984) Bond, J. R., Arnett, W. D., & Carr, B. J. 1984, ApJ, 280, 825
- Bromm et al. (2002) Bromm, V., Coppi, P. S., & Larson, R. B. 2002, ApJ, 564, 23
- Bromm & Larson (2004) Bromm, V. & Larson, R. B. 2004, ARA&A, 42, 79
- Bromm & Loeb (2006) Bromm, V. & Loeb, A. 2006, ApJ, 642, 382
- Buonanno et al. (2005) Buonanno, A., Sigl, G., Raffelt, G. G., Janka, H.-T., & Müller, E. 2005, Phys. Rev. D, 72, 084001
- Daigne et al. (2005) Daigne, F., Olive, K. A., Sandick, P., & Vangioni, E. 2005, Phys. Rev., D72, 103007
- Dwek et al. (2005) Dwek, E., Arendt, R. G., & Krennrich, F. 2005, ApJ, 635, 784
- Fryer et al. (2001) Fryer, C. L., Woosley, S. E., & Heger, A. 2001, ApJ, 550, 372
- Heger et al. (2003) Heger, A., Fryer, C. L., Woosley, S. E., Langer, N., & Hartmann, D. H. 2003, ApJ, 591, 288
- Heger et al. (2000) Heger, A., Langer, N., & Woosley, S. E. 2000, ApJ, 528, 368
- Heger & Woosley (2002) Heger, A. & Woosley, S. E. 2002, ApJ, 567, 532
- Iocco et al. (2005) Iocco, F., Mangano, G., Miele, G., Raffelt, G. G., & Serpico, P. D. 2005, Astroparticle Physics, 23, 303
- Itoh et al. (1989) Itoh, N., Adachi, T., Nakagawa, M., Kohyama, Y., & Munakata, H. 1989, ApJ, 339, 354
- Iwamoto et al. (2005) Iwamoto, N., Umeda, H., Tominaga, N., Nomoto, K., & Maeda, K. 2005, Science, 309, 451
- Janka (1995) Janka, H.-T. 1995, Astroparticle Physics, 3, 377
- Kaplinghat et al. (2000) Kaplinghat, M., Steigman, G., & Walker, T. P. 2000, Phys. Rev. D, 62, 043001
- Kotake et al. (2003) Kotake, K., Yamada, S., & Sato, K. 2003, ApJ, 595, 304
- Liebendörfer et al. (2005) Liebendörfer, M., Rampp, M., Janka, H.-T., & Mezzacappa, A. 2005, ApJ, 620, 840
- Liu et al. (2007) Liu, Y. T., Shapiro, S. L., & Stephens, B. C. 2007, Phys. Rev. D, 76, 084017
- Loeb (2006) Loeb, A. 2006, ArXiv:astro-ph/0603360
- Marek et al. (2006) Marek, A., Dimmelmeier, H., Janka, H.-T., Müller, E., & Buras, R. 2006, A&A, 445, 273
- Nakamura & Umemura (2001) Nakamura, F. & Umemura, M. 2001, ApJ, 548, 19
- Nakazato et al. (2006) Nakazato, K., Sumiyoshi, K., & Yamada, S. 2006, ApJ, 645, 519
- Nakazato et al. (2007) —. 2007, ApJ, 666, 1140
- O’Shea & Norman (2007) O’Shea, B. W. & Norman, M. L. 2007, ApJ, 654, 66
- Ott et al. (2008) Ott, C. D., Burrows, A., Dessart, L., & Livne, E. 2008, ArXiv:0804.0239
- Porciani et al. (2004) Porciani, C., Petroni, S., & Fiorentini, G. 2004, Astroparticle Physics, 20, 683
- Rosswog & Liebendörfer (2003) Rosswog, S. & Liebendörfer, M. 2003, MNRAS, 342, 673
- Ruffert et al. (1996) Ruffert, M., Janka, H.-T., & Schaefer, G. 1996, A&A, 311, 532
- Santos et al. (2002) Santos, M. R., Bromm, V., & Kamionkowski, M. 2002, MNRAS, 336, 1082
- Schneider et al. (2002) Schneider, R., Guetta, D., & Ferrara, A. 2002, MNRAS, 334, 173
- Sekiguchi & Shibata (2005) Sekiguchi, Y. & Shibata, M. 2005, Phys. Rev., D71, 084013
- Shapiro & Teukolsky (1983) Shapiro, S. L. & Teukolsky, S. A. 1983, Black holes, white dwarfs, and neutron stars: The physics of compact objects (New York, Wiley-Interscience, 1983, 663 p.)
- Shen et al. (1998) Shen, H., Toki, H., Oyamatsu, K., & Sumiyoshi, K. 1998, Nucl. Phys., A637, 435
- Shibata (2003) Shibata, M. 2003, ApJ, 595, 992
- Stone & Norman (1992) Stone, J. M. & Norman, M. L. 1992, ApJS, 80, 753
- Suwa et al. (2007a) Suwa, Y., Takiwaki, T., Kotake, K., & Sato, K. 2007a, ApJ, 665, L43
- Suwa et al. (2007b) —. 2007b, PASJ, 59, 771
- Takiwaki et al. (2007) Takiwaki, T., Kotake, K., & Sato, K. 2007, ArXiv:0712.1949
- Totani et al. (1996) Totani, T., Sato, K., & Yoshii, Y. 1996, ApJ, 460, 303
- Yoshida et al. (2006) Yoshida, N., Omukai, K., Hernquist, L., & Abel, T. 2006, ApJ, 652, 6


| (%) | ( erg/s) | ( erg) |
|---|---|---|
| 0 | 1.11 | 6.57 |
| 0.01 | 1.17 | 6.78 |
| 0.05 | 2.17 | 8.30 |
| 0.1 | 4.19 | 11.3 |
| 0.3 | 7.55 | 22.2 |
| 0.5 | 8.22 | 29.6 |
| 1 | 8.64 | 40.8 |
| 2 | 8.44 | 52.4 |