Beyond XSPEC: Towards Highly Configurable Astrophysical Analysis
Abstract
We present a quantitative comparison between software features of the defacto standard X-ray spectral analysis tool, XSPEC and ISIS the Interactive Spectral Interpretation System. Our emphasis is on customized analysis, with ISIS offered as a strong example of configurable software. While noting that XSPEC has been of immense value to astronomers, and that its scientific core is moderately extensible—most commonly via the inclusion of user contributed “local models”—we identify a series of limitations with its use beyond conventional spectral modeling. We argue that from the viewpoint of the astronomical user, the XSPEC internal structure presents a Black Box Problem, with many of its important features hidden from the top-level interface, thus discouraging user customization. Drawing from examples in custom modeling, numerical analysis, parallel computation, visualization, data management, and automated code generation, we show how a numerically scriptable, modular, and extensible analysis platform such as ISIS facilitates many forms of advanced astrophysical inquiry.
Subject headings:
Data Analysis and Techniques1. Introduction
The pursuit of science pushes not only the boundaries of knowledge, but also the limits of technology used to acquire and analyze data from which new knowledge can be distilled. In this sense software systems for scientific analysis are never truly complete, so it is crucial that they be extensible. This enables scientists to incorporate custom, experimental codes into the system and drive it in directions not yet supported, or perhaps even envisioned, by its creators. A corollary is that the mechanisms for and results of the customization should be made as simple, powerful, and general as possible, freeing the practitioner to concentrate more on algorithmic or scientific concerns and less on the plumbing details of a given computational platform.
This paper compares the extent to which two open-source spectral analysis applications actively used in astronomy, XSPEC (Arnaud,, 1996) and ISIS (Houck,, 2002), meet these general criteria. The features of both systems are broadly surveyed, with contrasts drawn from a series of examples representative of astronomy in practice. A heavy emphasis is placed upon the roles of interpreted arrays, and the capability to quickly generate and numerically manipulate them as powerful enablers of analysis. The emergent theme is that numerical and architectural discontinuities between the internals of XSPEC and its controlling TCL interpreter, referred to in the large as the Black Box Problem, limit its full exploitation for scientific tasks that are within the reach of more configurable interactive analysis systems. We demonstrate the strong modularity and extensible scriptability of ISIS and suggest that such open and highly configurable systems offer deeper and wider promise for meeting the needs of exploratory scientific analysis.
The latest major versions of ISIS and XSPEC, 1.4.x and 12.x respectively, were used in our study. While XSPEC 11 remains in wide use (the first public, non-beta release of XSPEC 12 was circa 2005), it is more difficult to extend with a variety of custom models111For example, XSPEC 11 supports only local models coded in single precision Fortran77. and so in terms of extensibility would compare less favorably than does XSPEC 12.
Guiding our endeavor will be the sense of what a typically motivated scientist can achieve in each system with reasonable effort. On the premise that a strong programmer can eventually replicate virtually any result using nearly any combination of languages or tools, we are not concerned with what might in principle be achieved from either XSPEC or ISIS but rather what can be demonstrated within each. By avoiding hypotheticals we aim to transform a potentially open-ended debate into a tractable, concrete discussion. Towards this end we define working within an application to mean the execution of commands, or portions thereof, which only access or modify the code or data within the applications addressable memory. In this scheme, for example, issuing an operating system call from ISIS to spawn an external visualization tool would not be “working in ISIS,” however enlarging its address space by importing a shared object module, say to smooth an image in memory, would be.
We recognize the utility of integrating complementary but distinct programs into a single logical entity. Building on trust in known tools, it is a sensible scheme for managing complexity, fostering reuse, and balancing deadlines with goals. Cooperating applications can, with sufficient effort, be made to appear as seamless as a single program. One should not, however, equate the act of
-
•
dumping internal state to disk files, spawning a series of tools to read this state and create temporary data products along the way, then loading these new data back into the parent application
with the ability to
-
•
invoke a function to operate upon a data structure, with both resident in memory.
In this paper we will argue that the latter offers greater immediacy of use, as well as significantly more algorithmic, data, and visualization flexibility. It also addresses real scalability concerns as datasets increase in size or tasks increase in time complexity. A stark example of this is given in Davis et al., (2005), which discusses the methods employed to analyze the megasecond observation of Cassiopeia A (Hwang et al.,, 2004) by the Chandra X-Ray Observatory in 2004, which yielded the first ever map of electron acceleration in a supernova remnant (Stage et al.,, 2006). Over 9 million PHA spectra were extracted from over 300 million events, with hundreds of thousands of spectral fits performed in ISIS to yield arc-second resolution spatial maps of plasma temperatures, line emission, and Doppler velocities. Custom modules were developed to manage the multi-gigabyte files involved and distribute the spectral extractions and fits across a network of workstations using the Parallel Virtual Machine (Geist et al.,, 1994). Based upon the time required to extract a single spectrum from these enormous datasets, with the standard Chandra dmextract tool in CIAO (ca. version 3.2), the authors extrapolated that the spectral extractions alone would have required nearly 10 years had a tool-based approach been taken. In contrast, each run through the entire PVM-based analysis sequence required less than 12 days to complete.
2. Feature Survey
XSPEC and ISIS have been primarily concerned with fitting models to 1D spectra: a theoretical model of photon counts is calculated, convolved with an instrument response, and compared to the actual photon counts observed by the detector, using a given fit statistic (typically ). Each provides mechanisms for indexed loading and management of data (observed counts, instrument responses, et cetera), as well as the capacity to visually inspect, using PGPLOT to construct a variety of 2D plots, the data, models, residuals, fit statistics, and so forth. While initially targeted for X-ray analysis, both XSPEC and ISIS have been utilized in multiple wavebands. The primary authors of XSPEC and ISIS are practicing astronomers with active publication records in the domains served by their applications. Both applications are thus subject to continuous, rapid, and rigorous scientific vetting. ISIS and XSPEC update cycles are measured in terms of days and weeks, which can be beneficial for users under time constraints before their proprietary data go public.
XSPEC is the tool most widely used in X-ray astronomy for spectral fitting; with a legacy spanning more than two decades and hundreds of citations, its value to the scientific community is beyond question. XSPEC bundles more than 50 theoretical models, each of which may also be used by external programs simply by linking to its libraries. The core set of models may be extended with either precomputed file-based table models or compiled codes. The bulk of compiled XSPEC models are coded in Fortran, however as part of a significant redesign effort support for custom C and C++ models was recently added (ca. 2005). XSPEC was also one of the earliest astronomical applications to adopt a widely-used, general-purpose scripting language for interactive use and batch control; the incorporation of TCL, introduced in version 10 and stabilized in version 11, provided programmability and a clear path to graphical interfaces with the Tk widget set.
ISIS was conceived to support analysis of high-resolution Chandra X-Ray gratings spectra, then quickly grew into a general-purpose analysis system. ISIS is essentially a superset of XSPEC, combining all of its models (though they are not required for ISIS operation) and more with the S-Lang scripting language (Ayers,, 1996), whose mathematical performance rivals both commercial packages such as MatLab (Gilat,, 2004) or IDL (Kling,, 1999) as well as the numerical extensions for popular open source languages (Noble,, 2007, §3).
As with XSPEC, users may define custom models in compiled code, external tables, or as a string specifying simple arithmetic combinations of existing models, but ISIS takes it further by also allowing models to be interpreted S-Lang functions; this supports rapid prototyping and, because of the high-performance of S-Lang numerics (§3), need not sacrifice speed for the convenience of using an interpreter. XSPEC does not support the use of TCL procedures as models.
The chief means of controlling XSPEC and ISIS interactively is by textual prompt, with both providing VI and EMACS key bindings through GNU readline, as well as filename completion and persistent command history. XSPEC accepts commands entered in abbreviated form, such as mo for model, but does not auto-complete TCL command or variable names from partial input. ISIS provides strong auto-completion facilities, allowing any S-Lang function or variable name to be identified from minimal partial input. In addition to the command prompt, optional packages providing graphical interfaces, such as the Gtk-based VWhere (§7.4) or the SAOds9 (Joye and Mandel,, 2003) image display module (§7.2), have been publicly available and utilized within ISIS for several years. Graphical extensions for XSPEC have been discussed in the literature (Jordan et al.,, 1994) and online, but, other than wholly external tools like fv (Pence et al.,, 1997), none seem publicly available for use within XSPEC proper.
The XSPEC prompt presents an appealingly simple, everything-is-a-command interface, and fosters ease of use by offering brief, germane command names, assuming sensible defaults, and in some cases transparently combining multiple operations into one: e.g. loading both data and background files with a single command. A typical command is shorter and requires less punctuation in XSPEC, although the auto-completion capability of ISIS can compensate for its relative verbosity. In short, XSPEC makes it easy to perform many common spectral analysis tasks.
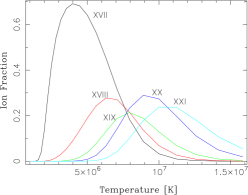
The ISIS prompt was designed to be a proxy S-Lang interpreter (Fig. 3), making ISIS programmable and extensible since inception. Its everything-is-a-function philosophy permeates the implementation and user experience, providing, at the cost of a steeper initial learning curve, considerable flexibility and power. Consider for illustration the Astrophysical Plasma Emission Database (APED) of Smith et al., (2001). Because ISIS provides programmatic access to virtually all of APED, curves like those of Fig. 1, showing the ionization fractions at 25 temperatures for Fe XVII through XXI, can be created with just a few statements
     temperature = 10.0^[6.0:7.2:0.05];
     foreach ion ( [17, 18, 19, 20, 21] ) {
        fraction = ion_frac(Fe, ion, temperature);
        oplot (temperature, fraction);
     }
either directly from the ISIS prompt or within analysis scripts. The importance to X-ray analysis of this sort of facile manipulation of atomic data is heavily underscored in Kallman and Palmeri, (2007).
2.1. The Black Box Problem
It is not clear how a similar ad-hoc query of APED could be formulated in XSPEC, nor how the results of such might be used within it for further analysis. One problem is that the use of APED in XSPEC is highly constrained, due to it being hidden, e.g., within the internals of the apec model and identify commands. Another obstacle is that high-level plotting in XSPEC is not generic: the plot and iplot commands are also opaque, in that they take their vectors from internal state representing the current data or model under inspection. Intimately tied to the semantics of 1D spectral analysis, these commands may not be used until after a dataset has been loaded.
While ISIS contains similar visualization commands specifically tailored to spectral analysis, the oplot function shown above is part of a family of routines which allows one to create arbitrary image, scatter, histogram, and contour [over]plots from arbitrary data, independently of the current spectra being analyzed. This makes exploratory coding and visualization like
          isis>  x = [PI/2: 2*PI: PI/100]
          isis>  plot(x, cos(x))
          isis>  oplot(x, sin(x))
as natural in ISIS as it is in other interactive analysis systems such as IDL or PyRAF (de La Peña et al.,, 2001). In XSPEC such dynamic creation of interpreted arrays and direct mathematical manipulation and visualization of them is more difficult, involving a melange of TCL code, XSPEC commands, intermediate files, and low-level QDP/PLT directives.222Or going outside of XSPEC to use tools like fv or XIMAGE.
The issue is not that interpreted numeric arrays cannot be utilized in XSPEC, because the TCL extensions BLT and NAP (see next section) make this possible; nor does the problem lie with PGPLOT, since it provides more capabilities than XSPEC currently exploits. Rather, it is the XSPEC architecture which does not connect the two in a straightforward manner, leaving the user little choice but to look elsewhere for open-ended numerics and visualization. This opacity and disconnectedness is evident in other functional areas of XSPEC, notably the manner in which data are input & managed (§4) and how custom models are specified (§5).

Echoing similar criticisms levied upon graphical interfaces when compared to command lines (Norman,, 2007; Bland et al.,, 2007), we collectively refer to these issues as the Black Box Problem: by hiding complexity to make common tasks easy, uncommon or novel tasks can be made difficult or impossible.
The ease of use that has been a hallmark of XSPEC–written by astronomers to do things astronomers need, in a way natural to them—has served the community well. A challenge, though, is that as instruments and the data collected from them grow in size and complexity, causing us to consider new questions and possibly develop new techniques to answer them, the Black Box Problem can engender You May Only! patterns of analysis, rather than foster rapid, ad hoc explorations of What If? scenarios. More modular, configurable, and open implementations (Kiczales,, 1996) can help resolve this tension, allowing applications to rapidly evolve to suit specific user needs while freeing their primary authors of the burden of coding and maintaining such enhancements themselves.
3. High Performance Numerics
Compact multidimensional numerics are a major basis for the popularity of commercial toolsets such as IDL or MatLab. The innate capability of S-Lang in this regard was a primary motivator for its adoption in ISIS,333Another motivator was wide availability: S-Lang is utilized in numerous open source projects and, in part by virtue of being bundled as a core component of every major Linux distribution, is available on millions of machines worldwide. and endows it with analytic expressiveness and scripting performance not equaled in XSPEC.
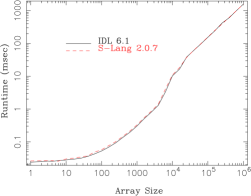
As indicated in the earlier code fragments, complex mathematical abstractions may be stated concisely in S-Lang, without regard to whether they will operate upon scalars, vectors, multidimensional arrays, or some combination of each, and are computed with performance on par with commercial software (e.g., as in Fig. 2). In this section we discuss the more involved example of Fig. 4, consisting of an orbital model implemented in pure S-Lang and taken “as is” from an MIT research effort The model was fit to a coarsely binned lightcurve (providing an example of how ISIS can model non-spectroscopic data directly from in-memory S-Lang arrays, as discussed in §4), and represents a steady amplitude curve interrupted by an eclipse with a quadratic ingress and egress, with low-level emission during the eclipse also modeled by a quadratic function. (Trowbridge et al.,, 2007).
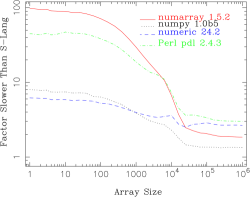
As a means of assessing the numerics and extensibility of XSPEC we attempted to translate this model into TCL; for completeness we also made Perl and Python translations, since these languages are actively employed by astronomers in systems like PDL and PyRAF and so are useful contrasts for gauging the numerical capabilities of S-Lang. Because neither TCL , Perl, nor Python are intrinsically vectorized we used numerical extension modules for each conversion: BLT & NAP for TCL, PDL for Perl, and Numeric, NumArray, & NumPy for Python. The Python and Perl conversions were straightforward, with Python being the somewhat easier of the two; we did not complete the conversion to TCL, however, largely because neither BLT nor NAP provided a clear equivalent to the where command or a means of using the results of such for array slicing. This model would therefore need to be recoded in a compiled language before it could be used in XSPEC. A plot of the performance of Perl 5.8.4 and Python 2.4 implementations of this model, divided by the corresponding S-Lang 2.0.7 performance, is given in Fig. 5.
The testing methodology behind Figs. 2 and 5 is described in Noble, (2007), along with memory statistics and additional tests showing similar performance trends. Briefly, the datapoints in each curve are the mean times of 1000 invocations of the model on a given grid size (31 in all, from 1 to 1e6 bins); all codes were compiled using GCC 3.3 with -O3 optimization, and executed on a dual Athlon (1.8Ghz) machine running Debian 3.1. Although not a comprehensive series of benchmarks, these results hint that the numerical engine of ISIS is among the strongest available. High performance scripting means that rapid development techniques—irrespective of language—can be applied to a broad scope of analysis problems, allowing the writing of compiled code to gradually become a last resort instead of the primary avenue of attack. S-Lang bears a strong resemblance to C and IDL, arguably the most popular

scripting language used by astronomers, and in fact we and colleagues have converted numerous IDL and MatLab scripts to S-Lang for use in ISIS with relative ease.
4. Array-Based Input
As we found with the orbital model, converting such scripts to TCL for use in XSPEC would pose a considerable challenge: although the primary interface of XSPEC is a scriptable interpreter in which multidimensional arrays may be created and mathematically manipulated—with the aid of the BLT or NAP—the results of such cannot be straightforwardly utilized for spectroscopy. The fact that the internal data tables of XSPEC are not exposed for direct population from the TCL interpreter is another instance of the Black Box Problem; data may only be read from FITS files, and only via the data command or its INTEGRAL mission-specific variant SPIdata. There is no documented provision by which interpreted arrays may be used, for instance, to specify observed counts or responses.
Reflecting a fundamental difference in approach, XSPEC is more static than ISIS, taking the position that extensive data preparation happens outside the application. An advantage of this approach is self-documentation: well-written tools record the path along which a FITS file travels as history keywords in its header. A drawback is the underlying implication that input data need little massaging during interactive analysis; when the need for such data manipulation arises, the solution typically involves dumping XSPEC state to disk files, and/or running FTOOLS or other programs to generate new file products, then reloading these data back into XSPEC.
This files-only data management paradigm can lead to slower performance and more cumbersome analytics (§1, §7.4). It can also be an evolutionary disadvantage, i.e. by potentially limiting the pool of individuals able or willing to contribute new I/O codes to XSPEC. As exemplified by the implementation of the SPIdata command, endowing XSPEC with the ability to directly read additional file or mission formats requires detailed mastery of its internals. This means general-purpose code generators like SWIG (Beazley,, 1996) or SLIRP (Noble,, 2007) cannot be leveraged to automate the wrapping of I/O libraries and simplify the use of new formats in XSPEC. To foster the widest possible use, by design such wrapper generators know nothing about the applications in which the bindings they create will be used. They emit code targeted to the scope of a scripting language, rather than application-specific C++ methods like SPI_Data::read() which is suitable only for internal XSPEC use.
4.1. Towards Dynamic Data Management
ISIS aims for a more dynamic and configurable approach to data management. In addition to supporting file-based input in the manner of XSPEC, but with ASCII in addition to FITS, ISIS also permits most facets of the modeling process to be specified directly from interpreted S-Lang arrays in memory, including the theoretical and observed counts, ARF, RMF, and background.
The problem of augmenting spectroscopy with data in foreign formats is thus reduced from having to master XSPEC internals to merely being able to create S-Lang arrays from such files. This is within the reach of end users, not just application authors, particularly because automatic code generators can then be employed to simplify the creation of scriptable wrappers for the relevant I/O libraries.
As an example of how these considerations can matter in practical use, consider the HDF5 file format and I/O library (Folk et al.,, 1999). While FITS is the standard format for archiving and distributing astrophysical observations, HDF5 has become the defacto standard for storing astrophysical simulations such as those generated by FLASH (Fryxell et al.,, 2001). Having the ability to easily compare and contrast observations with simulations, e.g., using simulation output as source model input, could foster more sophisticated analyses. We have explored such questions in ISIS as part of the HYDRA444http://space.mit.edu/hydra project, using SLIRP to generate the SLh5 module555http://space.mit.edu/cxc/software/slang/modules/slh5 for reading and writing HDF5 data directly to and from in-memory S-Lang arrays. The resulting objects may be sliced with S-Lang array manipulators or mathematically transformed in arbitrary ways (§3) before further analysis, such as being treated as fit data or model data, or passed to 2D plotting or 3D volumetric routines for visualization. This module also obviates the need for a conversion tool to migrate data from HDF5 to FITS for spectroscopy666http://www.hdfgroup.org/RFC/fits2h5/fits2h5.htm describes preliminary efforts to go in the other direction..
This spirit of imposing fewer constraints on how its internal tables may be populated or manipulated leads to more flexible and mathematically diverse analysis. For example, consider the problem of grouping data to ensure an adequate signal to noise ratio is obtained for each detector channel. With XSPEC data are grouped prior to input, usually with the grppha tool. The assigned grouping persists for the life of the loaded dataset, and may only be changed by re-running grppha outside of XSPEC, deleting the original dataset in XSPEC, and reloading it with the new grouping. With ISIS spectra may be dynamically rebinned in memory— using the functions rebin_data(), group_data(), or variants—with the associated dataset remaining intact. ISIS also provides options not available in the XSPEC grppha paradigm, such as grouping by signal to noise ratio, or allowing datasets to be combined directly in memory, bringing to bear the full numerical power discussed in §3 and §7, instead of shelling out to run tools such as mathpha, marfrmf, or addrmf—an approach of more limited mathematical generality. ISIS also supports combining non-linear (e.g. piled-up) data, which in general cannot be done with tools because of the model evaluation involved.
5. Custom Models
In §3 we detailed how the performance of S-Lang couples with the ability of ISIS to use purely interpreted models to provide an alternative to the traditional method of using compiled codes as custom spectral models. This significant feature, not available to XSPEC users since it does not permit TCL procedures to be used as models, can encourage rapid experimentation with short, highly analytic codes. These brief, self-contained scripts are easily exchanged among users, as they may be loaded immediately into ISIS from any directory. This is in contrast to code that must be compiled into a shareable object then accessed from fixed locations and in conjunction with external description files, such as $LOCAL_MODEL_DIRECTORY and lmodel.dat are respectively used in XSPEC.
Moving to the realm of compiled models, while version 12 of XSPEC provides many improvements over version 11—notably support for C and C++, double precision numerics, and the initpackage automated model wrapping command—a number of limitations persist. To begin, using local models at all means one must first build XSPEC from source. Although HEASOFT generally builds well, this can still be daunting, and is unnecessary with ISIS as both interpreted and compiled user models may be used from a binary installation. Next, model components in XSPEC must be designated as having a specific form, e.g. additive, multiplicative, convolution, etc. This too is unnecessary in ISIS, as it places no restriction upon the computational form of a model—any conceivable mathematical function may be used.
As XSPEC has been the defacto standard for so long, it is also easy for spectral model developers to code expressly for XSPEC, by relying too heavily upon its internal functions (such as udmget for memory allocation or xwrite for message output) when crafting models. When XSPEC was the only X-ray spectral modeling tool available this was not a concern, but today it makes reusing models in other environments more difficult. For example, pulling the pexriv model out of XSPEC 11, which remains widely used, required
          -lxspec -lxspec_lfn -lxspec -lwcs
          -lxanlib -lreadline -lcfitsio -lpgplot
          -lcurses -ltermcap
on the link line, plus the introduction of a “dummy” function to resolve an unused symbol name (Markoff and Nowak,, 2004). Standing out here is the recursive use of -lxspec, and the need for auxiliary terminal management and plotting libraries that provide no numerical or physics contribution to the model. Although this situation is improved in XSPEC 12, these show that it is not enough to simply make source code available to the public: orthogonality is an important aspect of open and flexible software. To promote external reusability, code must also be separable into logically distinct units free of unwanted dependencies. These are core implementation principles of ISIS (Fig. 3).
5.1. Automated Model Wrapping
While initpackage does help automate the use of custom models in
XSPEC 12, it is not a generic, application-neutral wrapper generator in
the style of SLIRP or SWIG. The result is that custom modeling cannot
be scripted in XSPEC with the same level of flexibility as in ISIS. For
example, initpackage does not expose the routines it wraps to the top-level
TCL interpreter, but rather makes them accessible only through the
the XSPEC
model command. Not being able to call
models directly from TCL means the convenience of an interpreter
cannot be leveraged when testing and using the models.
This can be easy to overlook, because many model writers devise their own nominal tests in whatever compiled language they used to write the model. However, it would be valuable for both writers and users of models if they could craft TCL commands or scripts to exercise them (in a more powerful and streamlined manner than the multiplexing tclout command, or faking a dataset) or pass their output to other features in the application for further numerical processing. Consider Fortran common blocks, for instance, and the XSPEC warmabs model in particular: after evaluation the ewout block in this model contains a list of the strongest lines, sorted by element and ion. Wrapping warmabs with SLIRP makes the content of this and every other common block in the model accessible to ISIS as S-Lang variables.777Common block values may also be modified using regular S-Lang assignment expressions. This provides scientists another means of accessing the internals of a code, without needing to master the internals of the application for which that code was initially written.
In addition, initpackage wraps only the outermost interface routine of a model: if the spectrum returned by a model is actually computed in several steps by calling additional routines, those lower level routines are not exposed by initpackage for use in XSPEC outside the model evaluation. As an example of how exposing the low level routines could be useful, we consider the pshock and vpshock models. Internally, both rely upon the lower-level ionseqs() routine to calculate nonequilibrium ionization ionic concentrations. In response to a collaborator (Ji 2007, priv. comm.) who wished to obtain these ionic concentrations independently, we used SLIRP to wrap ionseq.f in a matter of only minutes, which allowed ionseqs() to be called directly from a S-Lang script in ISIS.
The jet model of Markoff et al., (2005) provides another good example. The output spectrum is summed from 4 individual components (disk, comptonization, synchrotron, and synchrotron self-comptonization spectra), each computed by distinct routines within a single Fortran source file. To analyze or visualize the independent contribution of each component it is necessary to isolate each from the total flux. To achieve this the model can be executed in different modes, one of which will execute write statements to output component contributions to disk files as they are computed. Because our SLIRP wrapper for this jet model makes every routine within the Fortran file visible to the top-level S-Lang interpreter, not just the outermost model routine, the component fluxes can in principle now be accessed by making the relevant routine calls, or accessing the associated common blocks, directly from ISIS. To our knowledge the only way to achieve a similar result in XSPEC would be to wrap the code twice, once with initpackage to make the custom model routine visible to the model command, and again as a TCL extension module to expose the remaining routines to the TCL interpreter. Tools like ftcl or critcl888http://ftcl.sourceforge.net, http://wiki.tcl.tk/2523 can simplify bindings generation in the latter case, but not automate it to the level that SLIRP does; it is also unclear whether they support a range of features seen in general scientific codes, such as common blocks, string and multidimensional arrays, or complex datatypes.
Using initpackage for models which call external libraries can also be problematic. For example, collaborators are extending the above jet model with codes that call GNU Scientific Library routines, but initpackage documents no mechanism by which the GSL can be linked in at build time. Following compiler convention, this is achieved with SLIRP by specifying -lgsl on the command line.
Finally, functions wrapped by SLIRP can be automatically vectorized, allowing them to operate over entire arrays in a single call, and at the speed of compiled C code instead of using slower, interpreted looping constructs. Vectorized wrappers can also be tuned for parallelization with OpenMP (Noble,, 2007), allowing scientists to take better advantage of their multicore machines during ISIS analysis. To our knowledge autogenerated vector parallel wrappers are currently unique to SLIRP, and therefore inaccessible in XSPEC.
6. Parallel and Distributed Computation
Parallel computing is not new, but to this day few astronomers employ parallelism for standard problems in data analysis. To provide a quantitative sense of this assertion relative to X-ray spectroscopy (Noble et al.,, 2006), we performed the following full text searches on all published papers indexed in the ADS (Kurtz et al.,, 1993) by September of 2005.
| Keywords | Number of Hits |
|---|---|
| parallel AND pvm | 38 |
| message AND passing AND mpi | 21 |
| xspec | 832 |
| xspec AND parallel AND pvm | 0 |
| xspec AND message AND passing AND mpi | 0 |
Extra keywords were included with PVM and MPI (the Message Passing Interface, Gropp et al., 1999) so as to cull false matches (e.g. with the Max Planck Institute). Queries in ADS on other modeling tools, or with other search engines such as Google, all yielded similar trends: astronomers and astrophysicists have employed parallel computing, but mainly for highly customized, large-scale problems in simulation, image processing, or data reduction. Even though a majority of papers published in observational astronomy over recent decades result from fitting models within established software systems, virtually no one is employing parallelism to do so, especially in the interactive context.
As discussed in Noble et al., (2006) and earlier in §1, for several years PVM has been used in ISIS999PVM was used due its longstanding tolerance of faults on heterogeneous clusters of workstations, but in principle an MPI module could be used just as easily within ISIS. to apply pools of machines to coarse-grained calculations that do not fit within the compute space of one workstation. Consider relativistic Kerr disk models, for example. Historically, implementors have opted to use precomputed tables to gain speed at the expense of limiting flexibility in searching parameter space. However, by recognizing that contributions from individual radii may be computed independently the model has been parallelized in ISIS to avoid this tradeoff (A. Young, priv. comm., Brenneman and Reynolds,, 2006). Likewise, the aforementioned jet model can be expensive to compute, particularly when calculating error bars: generating 90% confidence limits for 12 free parameters, at the very coarse tolerance of 0.5, required 4 days on a single 2.66 GHz Intel Core 2 Duo processor. To increase performance we assigned the confidence limit search to 12 Intel Xeon 3.4GHz processors101010Using new versions of the cl_master and cl_slave scripts described on the ISIS website. within a PVM. This reduced the runtime at 0.5 tolerance to under 24 hours, a greater than 75% speedup; it also allowed us to discern finer features in parameter space by increasing the tolerance resolution by a factor of 500, to 0.001, while keeping the overall runtime to 50 hours, or approximately half of the serial runtime at 0.5 resolution.
Temperature mapping is another problem that was straightforward to parallelize with ISIS. For instance, Wise and Houck, (2004) provides a map of heating in the intracluster medium of Perseus, computed from 10,000 spectral extractions and fits on 20+ CPUs in just several hours. Additional efforts have also led to improvements in related areas of research, such as pvm_xstar, a parallelizing wrapper for XSTAR which has made it feasible for us to probe thousands of photoionized gas physical scenarios in the time it has previously taken to compute only a handful of such models (Noble & Ji, in prep.).
At the other end of the architectural scale, we have also shown that ISIS can make transparent use of OpenMP to exploit shared memory multiprocessors (Noble,, 2007). This is especially relevant in light of the emergence of multicore architectures: soon most astronomers will have parallel computers on their desktops, but few astronomy applications are poised to take advantage of them. Analysis systems which do not embrace parallelism can process at most the workload of only 1 CPU, resulting in a dramatic underutilization of resources as more CPU cores are added. However, astronomers are well versed in scripting, particularly with very high-level, array-oriented numerical packages like IDL, PDL, and S-Lang, to name a few. They combine easy manipulation of mathematical structures of arbitrary dimension with most of the performance of compiled code, with the latter due largely to moving array traversals from the interpreted layer into lower-level code like this C fragment
        case SLANG_TIMES:
             for (n = 0; n < na; n++)
                 c[n] = a[n] * b[n];
which provides vectorized multiplication in S-Lang. This suggests that much of the strength and appeal of numerical scripting stems from relatively simple loops over regular structures, making them ripe for automatic parallelization. This pattern was exploited in SLIRP and S-Lang to effect the OpenMP parallelizations described in (Noble,, 2007).
We believe that ISIS is the only general purpose spectroscopy system in which such a range of parallelism—from single processors on multiple machines to multiple processors on single machines—has been demonstrated. In both cases speedups were obtained without exposing parallelism at the ISIS application level. For instance, the same serial implementations of spectroscopic models have been used for both single- and multi-processor execution. This minimizes two traditional barriers to the use of parallelism by non-specialists: learning how to program for concurrency and recasting sequential algorithms in parallel form. We believe these considerations are important because the emerging ubiquity of multicore architectures, combined with the ever-growing size of datasets and analysis complexity, makes the regular use of parallelism in astronomy not a question of if it will occur, but rather one of merely when.
7. Beyond 1D Spectroscopy
Data from modern telescopes are getting larger and more detailed, with the use of multiple datasets from multiple missions becoming commonplace. Making sense of it all often requires techniques more sophisticated than traditional plots or images. Canned data reduction threads, while an important piece of the puzzle, can only go so far. Data openness and architectural modularity (Fig. 3) make it easy to push ISIS beyond its original mission of 1D spectroscopy to address this broader set of analysis problems. As we illustrate here, it has become unnecessary to use entirely separate applications (as XImage, XSelect, or Xronos are used alongside XSPEC) or be constrained by a strictly file tool file model, in order to supplement spectral modeling with, for example, advanced filtering, imaging, or timing analysis. For each of the examples shown here it is not clear how a similar result might be obtained so directly within XSPEC.
7.1. Timing Analysis
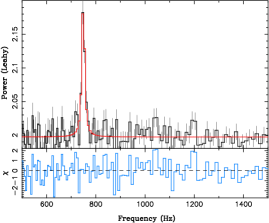
The optional SITAR module111111http://space.mit.edu/CXC/analysis/SITAR endows ISIS with timing analysis capability, obviating the need to use a separate timing application such as XRONOS. The power spectrum in Fig. 6 was generated entirely in ISIS: the data were read, the FFTs were performed and averaged, the Power Spectrum was logarithmically binned over Fourier frequency, the constant + two Lorentzians model was fit, and the results plotted, operating directly upon arrays in memory, all without ever leaving the program.
7.2. Modular Imaging with S-Lang Numerics
Many excellent imaging tools are available to astronomers, but it is
impossible for any one of them to do everything. Here again, the extensibility and modularity of the ISIS paradigm helps avoid the fate of “doing nothing” while waiting for the implementation of new features desired in one’s work. In such cases it can be expedient to craft new modules which add missing features, or make certain functionality more easy to incorporate into modeling and analysis.
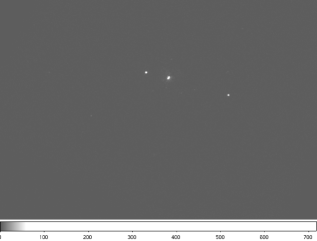
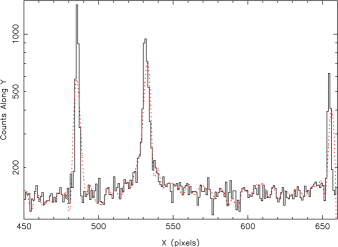
For example, consider Fig. 7, drawn from Chandra observation 4800 of interacting galaxy pair NGC7714, and the following series of commands:
    isis> require("ds9")
    isis> require("gsl")
    isis> image = ds9_get_array()
    isis> hist = sum(image, 0)
    isis> range = [440:680]
    isis> hplot(range-1, range, hist[range])
    isis> xa = [440:680:4]; ya = hist[xa]
    isis> smoothed = interp_cspline(range, xa, ya)
    isis> oplot(range, smoothed)
First the SAOds9 and GNU Scientific Library extension modules (Primini et al.,, 2005) are loaded; we show this explicitly for didactic purposes, but ISIS can be configured to load either module automatically when the given functions are invoked. The 10241024 image is then retrieved directly into a properly byteswapped 2D S-Lang pixel array, using an XPA (Mandel et al.,, 1995) binary transfer instead of intermediate file I/O. This image is collapsed along its X axis using the native S-Lang sum function, to create an intensity histogram plot. The GSL cubic spline function is then called to smooth the brightest portion of the intensity histogram, interpolating over every fourth point therein, and finally we overplot the result (dotted red line). Although the task here is relatively straightforward, it again shows how open-ended analysis objectives can be achieved by weaving existing tools together in new ways, using an array-based interpreter as the thread. DS9 is extended beyond its essential role as a qualitative display tool and into the realm of quantitative analysis, while the ISIS user is able to exploit the imaging capabilities of DS9 within interactive or scripted analysis.
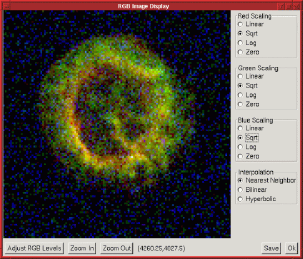
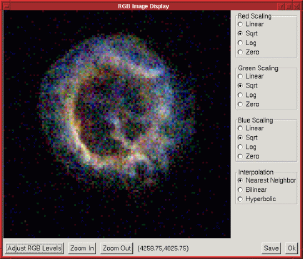
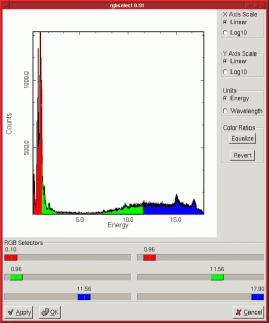
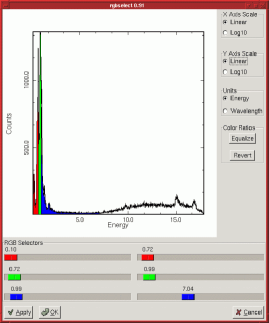
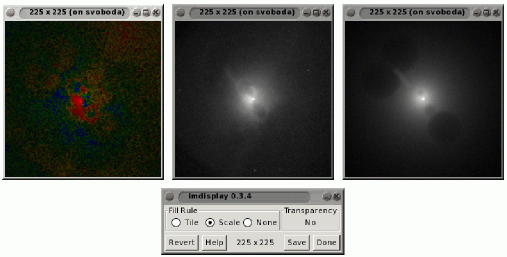
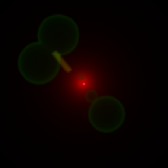
Another example is evt2img,121212http://space.mit.edu/cxc/software/slang/modules/hist/evt2img.html a simple guilet131313This term is used in Noble, (2005) to refer to graphical applets embedded within a primarily command-line application, and typically coded in a scripting language, allowing the use of graphical interfaces when convenient while avoiding an exclusively graphical interface. which combines the histogram and Gtk modules to provide an interactive mechanism for creating 3-color images directly from event lists. Images are created in evt2img by defining 3 energy band filters, binning the events selected by each filter with the hist2d function, and overlaying the resulting red, green, and blue monochrome images within a Gtk display window. As shown in Fig. 8, a useful feature of evt2img is its ability to plot the energy spectrum as a 1D histogram in order to tune the color band filters in real time, simply by adjusting the individual red, green, and blue sliders. For interactive exploration this method is faster and more intuitive than the traditional file tool file approach, and produces no temporary file litter while experimenting with color assignment filters. Evt2img may be run standalone from the operating system prompt or as a function in ISIS, and in the latter case allows event data to be input directly from in-memory interpreted arrays in addition to traditional event files. The HYDRA project at MIT provides a wealth of more sophisticated examples141414http://space.mit.edu/hydra/E2D_demo/e2d_demo.html of how advanced imaging can be tied more directly to numerical modeling and analysis in ISIS. Under the auspices of the NASA AISRP program, a broad suite of 2D and 3D fitting, geometry, and visualization routines have been developed, e.g. to do forward folding and comparison of models with 2D event-based data sets. These are described in detail online, but are briefly illustrated here in the context of an analysis of cavities in Hydra A, using the Chandra observation 4969. A model is defined by combining traditional spectral components (e.g. mekal and powerlaw) with 3D geometric components (e.g. an AGN modeled as a sphere). The fitting is performed directly in ISIS, as is the generation of the residual, data, and model images, and 2D and 3D model component projections (Fig. 9).
7.3. Volume Visualization
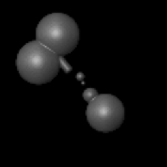
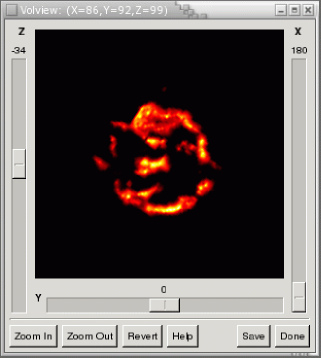
Astrophysical observation and simulation are in the midst of a transition beyond 1D spectra and 2D images, and into the realm of three-dimensional phenomena. A number of astronomy software tools exist which enable visualization of so-called 3D data cubes, but a problem shared by many of them is that they are limited to displaying one 2D slice at a time, optionally in series as an animation. Here we consider a 99 spectra data cube generated by CUBISM151515http://ssc.spitzer.caltech.edu/archanaly/contributed/cubism from Spitzer observation 3310 of Cassiopeia A, with dimensions RA, DEC, and . To identify where emission is strongest in the spatial and wavelength domains, the entire FITS datacube can be passed directly to volview (Fig. 10)
  isis> require("volview")
  isis> cube = fits_read_image("casa_ll1_s12.fits")
  isis> volview(cube)
This visualization makes it instantly clear that the clumpy regions correspond to bright emission at fairly specific wavelengths. The volview guilet is our interface to the Volpack rendering library (Lacroute and Levoy,, 1994), which, although somewhat dated, is small, has no external dependencies, requires no special hardware, and is very fast. The shear-warp factorization algorithm in Volpack has been generally recognized as the fastest rendering technique available (Meißner et al.,, 2000), a crucial factor for interactive analysis. In contrast to high-end tools like ParaView and VISIT161616http://www.paraview.org, http://www.llnl.gov/visit, volview provides a simple, low buy-in path to volume rendering and is actively used in the HYDRA project.171717http://space.mit.edu/hydra/v3d.html.
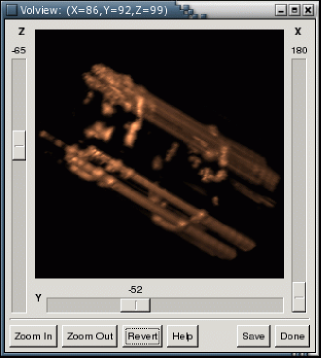
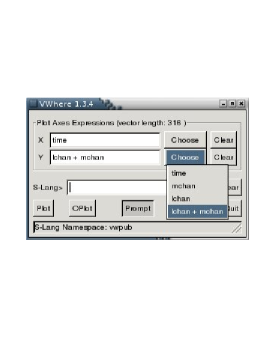
7.4. Visual Correlation and Multidimensional Filtering
Having the ability to cut, visualize, and correlate data, in complex ways and from multiple missions, is invaluable to analysis. This exploratory process ultimately seeks to derive sets of constraints C = {} upon input data D by iterating through a series of models, comparisons to data, and refinements of assumptions and model parameters. Because its analytic process does not encompass whole-array numerics (§3, §4), an iteration of this cycle in XSPEC can involve dumping application state to disk, followed by the execution of multiple tools such as fselect or fcalc to transform or cut file data, possibly fv or XIMAGE to visualize filtered data subsets, and XSPEC to incorporate the results back into analysis. This process creates temporary file litter products which can quickly become difficult to manage, and requires slow disk I/O passes over files when applying each unique set of filter constraints. Other limiting factors are that it restricts the scope of exploration to data expressed in the FITS file format, and that TCL-based I/O in tools like fv does not scale well to datasets containing millions of events.
In contrast, VWhere (Noble,, 2005), a graphical extension of the S-Lang where array slicing function, unifies the constraint cycle by enabling each phase to be performed within a single application. The result can be an intuitive, faster, and more powerful alternative to file-based data mining. By supporting the use of interpreted S-Lang arrays ISIS & VWhere make it easy to combine data from multiple sources and formats, not just FITS files, and examine them in natural ways, as well as foster scalability. VWhere has been used to simultaneously mine hundreds of observations from multiple telescopes, e.g. for evidence of transitions between the soft and hard states of Cygnus X-1 (Nowak et al.,, 2005), correlate model parameters with fit results—directly in memory from dozens of fits—for scores of observations (Wilms et al.,, 2006; Markoff et al.,, 2007; Nowak et al.,, 2008), and quickly corroborate colleague results (Heinz et al.,, 2007).
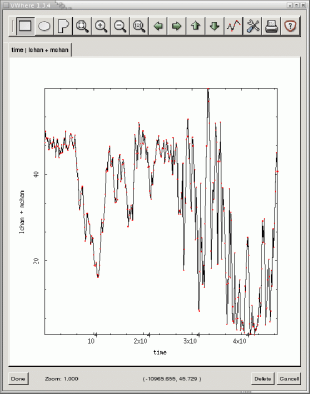
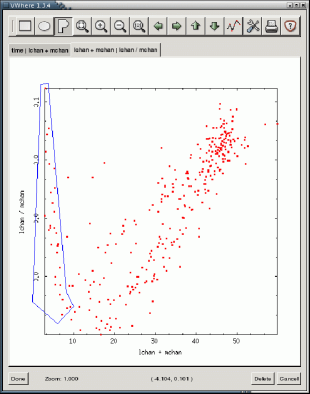
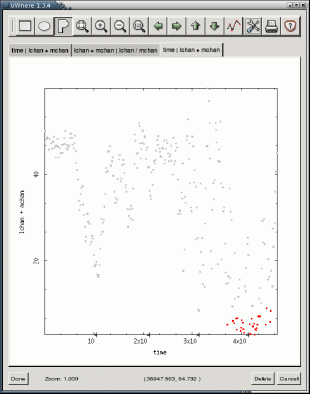
Filtering in VWhere amounts to manipulating regions of interest on plots generated from S-Lang arrays (Fig. 11), with no syntax required and the effects upon any combination of vectors automatically visualized for inspection (Fig. 12). This approach reveals data correlations that can be difficult and time-consuming to ferret out with tool-based techniques. New data vectors may be created on the fly and with no additional I/O overhead, using anything from simple arithmetic combinations of existing vectors to any mathematical transformation that can be specified in S-Lang or imported from external C, C++, or Fortran codes.
In contrast, file-based filtering tools require the use of syntax which may conflict in subtle ways from package to package. Specifying mathematical operations to such tools, e.g., in the form of quoted Unix shell syntax, can be tedious and cumbersome, and does not approach the expressive power (consider recursion, for example) or performance of ISIS numerics. As an illustration, consider the use of calculator tools for the discriminant computation in §3: the 1-million element S-Lang array datapoint in Fig. 2 corresponds to a runtime of ca. 0.15 seconds:
   isis>  a = [1:1e6+1];  b = 3*a; c = 2*a
   isis> tic; d = sqrt(b^2 - 4*a*c); toc
   0.151172
Using tools to perform similar operations upon files
   fcalc in out d "sqrt(b^2 - 4*a*c)"
   ftcalc in out d "sqrt(b^2 - 4*a*c)"
   dmtcalc in out expression="d=sqrt(b^2 - 4*a*c)"
(from a locally compiled -O2 distribution of HEASOFT 6.1 and a CIAO3.3 binary distribution, respectively) was consistently 1 to 2 orders of magnitude slower: roughly 1.8 sec for fcalc, 2.3 sec for ftcalc and 70 sec for dmtcalc. If we include the time to write
   isis>  s = struct{a,b,c}; s.a=a; s.b=b; s.c=c
   isis>  fits_write_binary_table("in","arrays",s)
the arrays to disk and then read them back in
isis> d = fits_read_table("out").d
the performance penalty of the tool approach is even greater. Moreover, the output product of each tool is not directly useful: to be visually inspected or used in further analysis, for instance, it first needs to be loaded into another program (e.g. fv, or XSPEC), incurring additional I/O and application overheads that are not seen in ISIS because its result arrays may be immediately manipulated or passed to subsequent computations.
Shared memory can, in principle, mitigate the disk I/O cost,
but in this case it did not help: instructing ftcalc
to write to shmem://h1 consistently resulted in runtimes of
nearly 3 minutes, while the CIAO dmtcalc tool would not permit the
creation of a shared memory FITS table. Even if shared memory
were faster than files in this case, the point raised earlier in
§4 still remains, namely that XSPEC documents no
clear provision though which such generic data arrays may be utilized
in analysis.
It must also be noted that few, if any, file-based transformation
tools are extensible. If we wished to use a hypergeometric function in
VWhere it is as simple as loading the GSL module with require("gsl")
and calling the relevant function.
If the mathematical operations required for their research are not
supported, tool users would have to either make an enhancement request
and wait or create their own solution.
7.5. Aside On Reproducibility
We have been refining the approach to analysis espoused in this paper for much of the past decade. During that time, one of the more persistent concerns we have privately encountered is that it can lead to diminished reproducibility, particularly in contrast to the file tool file model.181818This is relevant to the overall paper because it is the dominant means through which data are prepared for analysis in XSPEC, but applies to other analysis packages as well. Reproducibility is a cornerstone of science, and remains a topic of debate in wider circles (Collins,, 1992; Giles,, 2006), but is not treated in depth within the astronomy literature. We do not attempt to fill that gap here. Rather, we aim only to address the perception that configurable, interpreter-based methods compromise reproducibility relative to file-based tool methods, and hope that this may contribute to a more complete treatment of reproducibility elsewhere.
Central to reproducibility is the recording of history. Many tools assist that process by annotating modified files with FITS history keywords. This is of clear utility, especially when tracing pipelines and other well-defined data reduction procedures. For open-ended analysis, however, we do not believe it is superior to the forms of history recorded by full-fledged analysis applications. Consider what is being captured in history records written by tools: each keystroke of the command used to invoke the tool. This capability is not unique to tools. XSPEC and ISIS record keystroke history by virtue of their GNU readline command recall, editing, and logging capabilities, as do many other systems. Focusing on keystrokes alone, though, obscures a larger point: regardless of whether one prefers logs or header keywords, indiscriminately long lists of commands typed are of little value without some sense of their relevance to publishable results.
In the end what matters most is that results may be regenerated so that conclusions may be plausibly confirmed by others, rather than having every bump or wrong turn along the way reproduced in high fidelity. Scripts, the logical endpoint of our interpreter-based approach to analysis, confer this conceptual prioritization by making explicit the data and algorithms of greatest significance. Such scripts arise in tool-based analysis as well, only they tend to be expressed in system-oriented languages like Bourne shell or Perl, rather than intrinsically whole-array numeric languages like S-Lang or IDL. It can be argued, then, that scripts lead to higher forms of duplicability than FITS history records alone. They are also easier to annotate with additional commentary. We therefore conclude that that tool- and interpreter-based approaches to analysis are approximately equivalent in the degree to which they facilitate reproducibility. Care must be still taken when “feature creep” introduces incompatibilities that make the use of older scripts problematic with newer software versions, so it is important that version information be recorded and that older software remains accessible on the internet.
8. Conclusion
Progress in science can be measured by our ability to pose increasingly advanced, open-ended questions and address them with flexible techniques of commensurate sophistication. Since the age of Newton, one implication of this is that scientists must also practice mathematics, and since the age of Turing it has also meant they must practice programming.
In this paper we have compared two open-source spectral analysis applications, XSPEC and ISIS, in an attempt to gauge how their scientific and mathematical reach may be extended with custom programming. Contrasts between the two have been drawn from the context of current research efforts utilizing high performance computation, numerical modeling, atomic physics, visualization, automated code generation, and data management. We have demonstrated how these have led to the incorporation of new analytic techniques in ISIS, in ways that are either unexplored or problematic for the current XSPEC architecture and its associated file tool file model of analysis.
XSPEC has been of tremendous value to the X-ray community, continues to be actively developed, and has a strong history of community enhancement via local models (and to some extent, TCL/TK scripts). However, we have argued that the top-level simplicity of the XSPEC interface, long and rightfully one of the pillars of its appeal, can shroud much of its internal computational and data handling mechanisms. This in turn can render XSPEC less adaptable—by the typical user—for evolving research needs. Commands which operate as black-boxed common denominators of analysis, and permitting only file-based data input, may not be enough to probe some of the more computationally challenging problems facing astronomers.
We conclude that analysis applications such as ISIS, endowed with interpreted whole-array numerical capabilities and an open, modular, and scriptable architecture designed expressly for high configurability, are more favorably equipped to support ad-hoc research needs while not appreciably compromising reproducibility. Originally envisioned as a tool for Chandra gratings spectroscopy, ISIS has heavily influenced the development of additional Chandra analysis software, while also receiving NASA AISRP funding to continue its evolution within the aforementioned HYDRA project. Although some of the ISIS capabilities we’ve emphasized do exist in other astronomy software, we are unaware of any publications demonstrating how similar breadths of flexibility and computational power have been collected under the umbrella of a single open-source analysis application and brought to bear on published research in spectral analysis and X-ray astronomy in the manner discussed here.
References
- Arnaud, (1996) Arnaud, K. A. (1996). XSPEC: The First Ten Years. In Jacoby, G. H. and Barnes, J., editors, ASP Conf. Ser. 101: Astronomical Data Analysis Software and Systems V, pages 17–+.
- Ayers, (1996) Ayers, L. (1996). S-Lang Applications for Linux. The Linux Gazette, 12. http://linuxgazette.net/issue12/slang.html.
- Beazley, (1996) Beazley, D. (1996). SWIG : An Easy to Use Tool for Integrating Scripting Languages with C and C++. In 4th Tcl/Tk Workshop Proceedings.
- Bland et al., (2007) Bland, W., Naughton, T., Vallee, G., and Scott, S. L. (May 2007). Design and implementation of a menu based oscar command line interface. High Performance Computing Systems and Applications, 2007. HPCS 2007. 21st International Symposium on, pages 25–25.
- Brenneman and Reynolds, (2006) Brenneman, L. W. and Reynolds, C. S. (2006). Constraining Black Hole Spin via X-Ray Spectroscopy. ApJ, 652:1028–1043.
- Collins, (1992) Collins, H. M. (1992). Changing Order: Replication and Induction in Scientific Practice. University of Chicago Press.
- Davis et al., (2005) Davis, J. E., Houck, J. C., Allen, G. E., and Stage, M. D. (2005). Analyzing the Cas A Megasecond in Less than a Megasecond. In Shopbell, P., Britton, M., and Ebert, R., editors, Astronomical Society of the Pacific Conference Series, pages 444–+.
- de La Peña et al., (2001) de La Peña, M. D., White, R. L., and Greenfield, P. (2001). The PyRAF Graphics System. In Harnden, Jr., F. R., Primini, F. A., and Payne, H. E., editors, Astronomical Data Analysis Software and Systems X, volume 238 of Astronomical Society of the Pacific Conference Series, pages 59–+.
- Folk et al., (1999) Folk, M., McGrath, R., and Yeager, N. (1999). HDF: an update and future directions. In IEEE Geoscience and Remote Sensing Symposium, 1999, Vol. 1, pages 273–275.
- Fryxell et al., (2001) Fryxell, B., Zingale, M., Timmes, F. X., Lamb, D. Q., Olson, K., Calder, A. C., Dursi, L. J., Ricker, P., Rosner, R., Truran, J. W., MacNeice, P., and Tufo, H. (2001). Numerical simulations of thermonuclear flashes on neutron stars. Nuclear Physics A, 688:172–176.
- Geist et al., (1994) Geist, A., Beguelin, A., Dongarra, J., Jiang, W., Manchek, R., and Sunderam, V. S. (1994). PVM: Parallel Virtual Machine: A Users’ Guide and Tutorial for Networked Parallel Computing.
- Gilat, (2004) Gilat, A. (2004). MATLAB: An Introduction with Applications, 2nd Ed. John Wiley & Sons.
- Giles, (2006) Giles, J. (2006). The trouble with replication. Nature, 442:344–+.
- Gropp et al., (1999) Gropp, W., Lusk, E., and Skjellum, A. (1999). Using MPI (2nd ed.): portable parallel programming with the message-passing interface. MIT Press, Cambridge, MA, USA.
- Heinz et al., (2007) Heinz, S., Schulz, N. S., Brandt, W. N., and Galloway, D. K. (2007). Evidence of a Parsec-Scale X-Ray Jet from the Accreting Neutron Star Circinus X-1. ApJ, 663:L93–L96.
- Houck, (2002) Houck, J. C. (2002). ISIS: The Interactive Spectral Interpretation System. In Branduardi-Raymont, G., editor, High Resolution X-ray Spectroscopy with XMM-Newton and Chandra, Mullard Space Science Laboratory of University College, London.
- Hwang et al., (2004) Hwang, U., Laming, J. M., Badenes, C., Berendse, F., Blondin, J., Cioffi, D., DeLaney, T., Dewey, D., Fesen, R., Flanagan, K. A., Fryer, C. L., Ghavamian, P., Hughes, J. P., Morse, J. A., Plucinsky, P. P., Petre, R., Pohl, M., Rudnick, L., Sankrit, R., Slane, P. O., Smith, R. K., Vink, J., and Warren, J. S. (2004). A Million Second Chandra View of Cassiopeia A. ApJ, 615:L117–L120.
- Jordan et al., (1994) Jordan, J. M., Jennings, D. G., McGlynn, T. A., Bonnell, J. T., Gliba, G. W., Ruggiero, N. G., and Serlemitsos, T. A. (1994). An Xwindows/Motif Graphical User Interface for Xspec. In Crabtree, D. R., Hanisch, R. J., and Barnes, J., editors, ASP Conf. Ser. 61: Astronomical Data Analysis Software and Systems III, pages 71–+.
- Joye and Mandel, (2003) Joye, W. A. and Mandel, E. (2003). New Features of SAOImage DS9. In Payne, H. E., Jedrzejewski, R. I., and Hook, R. N., editors, ASP Conf. Ser. 295: Astronomical Data Analysis Software and Systems XII, pages 489–+.
- Kallman and Palmeri, (2007) Kallman, T. R. and Palmeri, P. (2007). Atomic data for x-ray astrophysics. Reviews of Modern Physics, 79:79–133.
- Kiczales, (1996) Kiczales, G. (Jan 1996). Beyond the black box: open implementation. Software, IEEE, 13(1):8, 10–11.
- Kling, (1999) Kling, R. (1999). Application Development with IDL. Ronn Kling Consulting.
- Kurtz et al., (1993) Kurtz, M. J., Karakashian, T., Grant, C. S., Eichhorn, G., Murray, S. S., Watson, J. M., Ossorio, P. G., and Stoner, J. L. (1993). Intelligent Text Retrieval in the NASA Astrophysics Data System. In Hanisch, R. J., Brissenden, R. J. V., and Barnes, J., editors, Astronomical Data Analysis Software and Systems II, volume 52 of Astronomical Society of the Pacific Conference Series, pages 132–+.
- Lacroute and Levoy, (1994) Lacroute, P. and Levoy, M. (1994). Fast volume rendering using a shear-warp factorization of the viewing transformation. In SIGGRAPH ’94: Proceedings of the 21st annual conference on Computer graphics and interactive techniques, pages 451–458, New York, NY, USA. ACM Press.
- Mandel et al., (1995) Mandel, E., Swick, R., and D., T. (1995). The X Public Access Mechanism: Software Cooperation for Space Science and Beyond. Proceedings of the 9th Annual X Technical Conference, Boston, MA.
- Markoff and Nowak, (2004) Markoff, S. and Nowak, M. A. (2004). Constraining X-Ray Binary Jet Models via Reflection. ApJ, 609:972–976.
- Markoff et al., (2005) Markoff, S., Nowak, M. A., and Wilms, J. (2005). Going with the Flow: Can the Base of Jets Subsume the Role of Compact Accretion Disk Coronae? ApJ, 635:1203–1216.
- Markoff et al., (2007) Markoff, S., Young, A., and Nowak, M. A. (2007). In preparation.
- Meißner et al., (2000) Meißner, M., Huang, J., Bartz, D., Mueller, K., and Crawfis, R. (2000). A practical evaluation of popular volume rendering algorithms. In VVS ’00: Proceedings of the 2000 IEEE symposium on Volume visualization, pages 81–90, New York, NY, USA. ACM Press.
- Noble, (2005) Noble, M. S. (2005). VWhere: A Visual, Extensible ‘where’ Command. In Shopbell, P., Britton, M., and Ebert, R., editors, ASP Conf. Ser. 347: Astronomical Data Analysis Software and Systems XIV, pages 237–+.
- Noble, (2007) Noble, M. S. (2007). Getting More From Your Multicore: Exploiting OpenMP From An Open Source Numerical Scripting Language. Computation and Concurrency: Practice and Experience. In press. arXiv e-print at http://adsabs.harvard.edu/abs/2007arXiv0706.4048N.
- Noble et al., (2006) Noble, M. S., Houck, J. C., Davis, J. E., Young, A., and Nowak, M. (2006). Using the Parallel Virtual Machine for Everyday Analysis. In Gabriel, C., Arviset, C., Ponz, D., and Enrique, S., editors, ASP Conf. Ser. 351: Astronomical Data Analysis Software and Systems XV, pages 481–+.
- Norman, (2007) Norman, D. (2007). The next ui breakthrough: command lines. interactions, 14(3):44–45.
- Nowak et al., (2005) Nowak, M. A., Wilms, J., Heinz, S., Pooley, G., Pottschmidt, K., and Corbel, S. (2005). Is the “IR Coincidence” Just That? ApJ, 626:1006–1014.
- Nowak et al., (2008) Nowak, M. A., Wilms, J., and Pottschmidt, K. (2008). In preparation.
- Pence et al., (1997) Pence, W., Xu, J., and Brown, L. (1997). FV: A New FITS File Visualization Tool. In Hunt, G. and Payne, H., editors, ASP Conf. Ser. 125: Astronomical Data Analysis Software and Systems VI, pages 261–+.
- Primini et al., (2005) Primini, F., Noble, M., and The CXC Science Data Systems Group (2005). Extending the Capabilities of CIAO with S-Lang-based Tools. In Shopbell, P., Britton, M., and Ebert, R., editors, ASP Conf. Ser. 347: Astronomical Data Analysis Software and Systems XIV, pages 17–+.
- Smith et al., (2001) Smith, R. K., Brickhouse, N. S., Liedahl, D. A., and Raymond, J. C. (2001). Collisional Plasma Models with APEC/APED: Emission-Line Diagnostics of Hydrogen-like and Helium-like Ions. ApJ, 556:L91–L95.
- Stage et al., (2006) Stage, M. D., Allen, G. E., Houck, J. C., and Davis, J. E. (2006). Cosmic-ray diffusion near the Bohm limit in the Cassiopeia A supernova remnant. Nature Physics, 2:614–619.
- Trowbridge et al., (2007) Trowbridge, S. R., Nowak, M. A., and Wilms, J. (2007). Tracking the Orbital and Super-orbital Periodicities of SMC X-1. In press.
- Wilms et al., (2006) Wilms, J., Nowak, M. A., Pottschmidt, K., Pooley, G. G., and Fritz, S. (2006). Long term variability of Cygnus X-1. IV. Spectral evolution 1999-2004. A&A, 447:245–261.
- Wise and Houck, (2004) Wise, M. and Houck, J. (2004). Mapping Heating in Clusters of Galaxies. In 35th COSPAR Scientific Assembly, volume 35 of COSPAR, Plenary Meeting, pages 3997–+.