AGN Dusty Tori: II. Observational Implications of Clumpiness
Abstract
From extensive radiative transfer calculations we find that clumpy torus models with 5–15 dusty clouds along radial equatorial rays successfully explain AGN infrared observations. The dust has standard Galactic composition, with individual cloud optical depth 30–100 at visual. The models naturally explain the observed behavior of the 10m silicate feature, in particular the lack of deep absorption features in AGN of any type. The weak 10m emission feature tentatively detected in type 2 QSO can be reproduced if in these sources drops to 2 or exceeds 100. The clouds angular distribution must have a soft-edge, e.g., Gaussian profile, the radial distribution should decrease as or . Compact tori can explain all observations, in agreement with the recent interferometric evidence that the ratio of the torus outer to inner radius is perhaps as small as 5–10. Clumpy torus models can produce nearly isotropic IR emission together with highly anisotropic obscuration, as required by observations. In contrast with strict variants of unification schemes where the viewing-angle uniquely determines the classification of an AGN into type 1 or 2, clumpiness implies that it is only a probabilistic effect; a source can display type 1 properties even from directions close to the equatorial plane. The fraction of obscured sources depends not only on the torus angular thickness but also on the cloud number . The observed decrease of this fraction at increasing luminosity can be explained with a decrease of either torus angular thickness or cloud number, but only the latter option explains also the possible emergence of a 10m emission feature in QSO2. X-ray obscuration, too, has a probabilistic nature. Resulting from both dusty and dust-free clouds, X-ray attenuation might be dominated by the dust-free clouds, giving rise to the observed type 1 QSO that are X-ray obscured. Observations indicate that the obscuring torus and the broad line region form a seamless distribution of clouds, with the transition between the two regimes caused by dust sublimation. Torus clouds may have been detected in the outflow component of H2O maser emission from two AGN. Proper motion measurements of the outflow masers, especially in Circinus, are a promising method for probing the morphology and kinematics of torus clouds.
Subject headings:
dust, extinction — galaxies: active — galaxies: Seyfert — infrared: general — quasars: general — radiative transfer1. INTRODUCTION
Recent VLTI interferometric observations in the 8–13 m wavelength range by Tristram et al. (2007) confirm the presence of a geometrically thick, torus-like dust distribution in the nucleus of Circinus, as required by unification schemes of Seyfert galaxies. Several aspects of their data require that this torus is irregular, or clumpy, in agreement with the earlier prediction of Krolik & Begelman (1988).
We have recently developed the first formalism for handling clumpy AGN tori and presented initial results (Nenkova et al., 2002; Elitzur et al., 2004; Elitzur, 2006, 2007). The reported clumpy models have since been employed in a number of observational studies, including the first analysis of Spitzer observations by the GOODS Legacy project (Treister et al., 2004). Our clumpy torus models were also employed in the analysis of spatially-resolved, near-diffraction-limited 10 m spectra of the NGC 1068 nucleus (Mason et al., 2006). The geometry and kinematics of both water maser (Greenhill & Gwinn, 1997; Gallimore et al., 2001) and narrow-line emission (Crenshaw & Kraemer, 2000) indicate that the NGC 1068 torus and accretion disk are oriented nearly edge-on. The Mason et al. clumpy model for IR emission is the first to correctly reproduce the observed near-IR flux with an edge-on orientation. In contrast, smooth-density models require viewing angles 22∘–30∘ above the equatorial plane in order to bring into view the warm face of the torus backside (Granato et al., 1997; Gratadour et al., 2003; Fritz et al., 2006). Clumpiness is also essential for understanding the puzzling interferometry result that dust temperatures as different as 800 K and 200–300 K are found at such close proximity to each other (Schartmann et al., 2005). The mounting observational evidence in favor of clumpy, rather than smooth, dust distribution in AGN tori has sparked additional modeling efforts by Dullemond & van Bemmel (2005) and Hönig et al. (2006).
This two-paper series expands the analysis of Nenkova et al. (2002). In its first part (Nenkova et al., 2008, part I hereafter) we develop the full formalism for continuum emission from clumpy media and construct the source functions of dusty clouds—the building blocks of the AGN torus. Here we assemble these clouds into complete models of the torus, and study the model predictions and their implications to IR observations. In comparing the predictions of any torus model with observations one faces a difficult problem—the overwhelming majority of these observations do not properly isolate the torus IR emission. Starburst emission is increasingly recognized as an important component of the IR flux measured in many, perhaps most, AGN (e.g., Netzer et al., 2007). In addition to this well known contamination, even IR from the immediate vicinity of the AGN may not always originate exclusively from the torus, further complicating modeling efforts. A case in point is the Mason et al. (2006) modeling of NGC1068. All flux measurements with apertures are in good agreement with the model results, but the flux collected with larger apertures greatly exceeds the model predictions at wavelengths longer than 4m. This discrepancy can be attributed to IR emission from nearby dust outside the torus. Mason et al show that the torus contributes less than 30% of the 10 m flux collected with apertures and that the bulk of the large-aperture flux comes at these wavelengths from dust in the ionization cones; while less bright than the torus dust, it occupies a much larger volume (see also Poncelet et al., 2007). On the other hand, the torus dominates the emission at short wavelengths; at 2 m, more than 80% of the flux measured with apertures comes from the torus even though its image size is less than 0.04′′ (Weigelt et al., 2004).
These difficulties highlight a problem that afflicts all IR studies of AGN. The torus emission can be expected to dominate the AGN observed flux at near IR because such emission requires hot dust that exists only close to the center. But longer wavelengths originate from cooler dust, and the torus contribution can be overwhelmed by the surrounding regions. Unfortunately, there are not too many sources like NGC1068. No other AGN has been observed as extensively and almost no other observations have the angular resolution necessary to identify the torus component, making it impossible to determine in any given source which are the wavelengths dominated by torus emission. There are no easy solutions to this problem. One possible workaround is to forgo fitting of the spectral energy distribution (SED) in individual sources and examine instead the observations of many sources to identify characteristics that can be attributed to the torus signature. One example for the removal of the starburst component is the Netzer et al. (2007) composite SED analysis of the Spitzer observations of PG quasars. Netzer et al identify two sub-groups of “weak FIR” and “strong FIR” QSOs and a third group of far-IR (FIR) non-detections. Assuming a starburst origin for the far-IR, they subtract a starburst template from the mean SED of each group. The residual SEDs are remarkably similar for all three groups, and thus can be reasonably attributed to the intrinsic AGN contribution, in spite of the many uncertainties. However, while presumably intrinsic to the AGN, it is not clear what fraction of this emission originates from the torus as opposed to the ionization cones. An example of sample analysis that may have identified the torus component is the Hao et al. (2007) compilation of Spitzer IR observations. In spite of the large aperture of these measurements, Seyfert 1 and 2 galaxies show a markedly different behavior for the 10m feature, both in their mean IR SEDs and in their distributions of feature strength. Furthermore, Ultraluminous IR Galaxies (ULIRG) that are not associated with AGN show yet another, entirely different behavior, indicating that the observed mean behavior of Seyfert galaxies is intrinsic to the AGN. Accepting the framework of the unification scheme, the differences Hao et al find between the appearances of Seyfert 1 and 2 can be reasonably attributed to the torus contribution; the ionization cones dust is optically thin, therefore its IR emission is isotropic and cannot generate the observed differences between types 1 and 2.
Here we invoke both approaches in comparing our model predictions with observations. We start by assembling dusty clouds into complete models of the torus, as described in §2. Our model predictions for torus emission and the implications to IR observations are presented in §§3–5, while in §6 we discuss aspects of clumpiness that are unrelated to the IR emission, such as the torus mass, unification statistics, etc. In §7 we conclude with a summary and discussion.
2. MODEL OF A CLUMPY TORUS
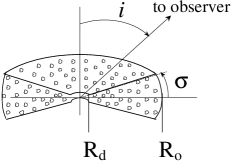
Consider an AGN with bolometric luminosity surrounded by a toroidal distribution of dusty clouds (Fig. 1). The “naked” AGN flux at distance is at any direction, but because of absorption and re-emission by the torus clouds the actual flux distribution is anisotropic, with the level of anisotropy strongly dependent on wavelength. The grain mix has standard interstellar properties (see paper I, §3.1.1 for details), the optical depth of each cloud is at visual.
2.1. Dust Sublimation
The distribution inner radius is set by dust sublimation at temperature . From §3.1.2 in part I,
| (1) |
Barvainis (1987) derived an almost identical relation for . His eq. 5 has the same normalization and only a slight difference in the power of (2.8 instead of 2.6); this difference reflects the more detailed radiative transfer calculations we perform. Here the distance is determined from the temperature on the illuminated face of an optically thick cloud of composite dust representing the grain mixture. The sharp boundary we employ is an approximation. In reality, the transition between the dusty and dust-free environments is gradual because individual components of the mix sublimate at slightly different radii, with the largest grains surviving closest to the AGN (Schartmann et al., 2005). From near-IR reverberation measurements, Minezaki et al. (2004) and Suganuma et al. (2006) find that the inner radius of the dusty region is indeed proportional to , but the time lags they report are 2–3 times shorter than predicted by eq. 1. While this equation gives the smallest radius at which the dust absorption coefficient reflects the full grain mixture, the largest grains survive to closer radii, where they are presumably detected by the reverberation measurements.
2.2. The Cloud Distribution
The torus extends radially out to , with a free parameter. The total number of clouds, on average, along any radial equatorial ray is specified by the parameter . We studied various forms for the variation of , the total number of clouds along rays at angle from the equator. Figure 1 shows on the left a sharp-edge uniform distribution with within the angular width . In a Gaussian distribution, .
The emission from the clumpy torus is found by integration along paths through the cloud distribution (eq. 5, part I). Some of the computation technicalities are described in the Appendix. The calculation requires the single cloud source function , derived in part I, and the number of clouds per unit length, , as a function of and radial distance . For this distribution we assume a separable function with power law radial behavior so that
| (2) |
where is a dimensionless constant (for a given and ), ensuring the normalization .
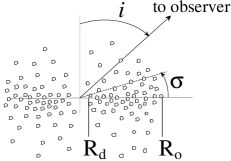
The observed torus radiation is affected not only by the emission from individual clouds but also by the probability that emitted photons escape through the rest of the path. The escape probability, , is given in eq. 4 part I. For an overall number of clouds along a path, at wavelengths in which the optical depth of a single cloud obeys , and when . Many of the detailed results presented below can be readily understood from the dependence of on wavelength and on torus viewing angle, shown in figure 2.
2.3. Scaling
Because of general scaling properties of radiatively heated dust (Ivezić & Elitzur, 1997), the only effect of the overall luminosity is in setting up the bolometric flux and the dust sublimation radius (eq. 1). For a given torus model, the distributions of dust temperature and of brightness are unique functions of the scaled radial distance : two sources with the same cloud properties but different luminosities will have the same distributions in terms of , only the more luminous one will have its brightness spread over a larger area because of its larger (this point is explained further in the Appendix). Denoting the torus flux by , the spectral shape is independent of . The dependence of the torus SED on the spectral shape of the AGN input radiation is limited to scattering wavelengths, disappearing altogether at 2–3 m. There is a similarly weak dependence on . The output spectrum depends primarily on and the cloud distribution. Although the luminosity does not affect the radiative transfer, it is entirely possible for torus properties to be correlated with for some other reasons (e.g. , as in the receding torus model).
2.4. The AGN Contribution
In most figures we show only the contribution of the torus emission. However, since the medium is clumpy, there is always a finite probability for an unobscured view of the AGN, irrespective of the viewing angle. Because of the probabilistic nature of the problem it is only possible to display the emerging spectral shape with or without the AGN contribution and the probability for each case (see bottom panel of figure 2).
3. MODEL SPECTRA
We proceed now with the model results. In all calculations the AGN input radiation follows the “standard” spectrum described in §3.1.1, part I.
3.1. Geometrical Shape
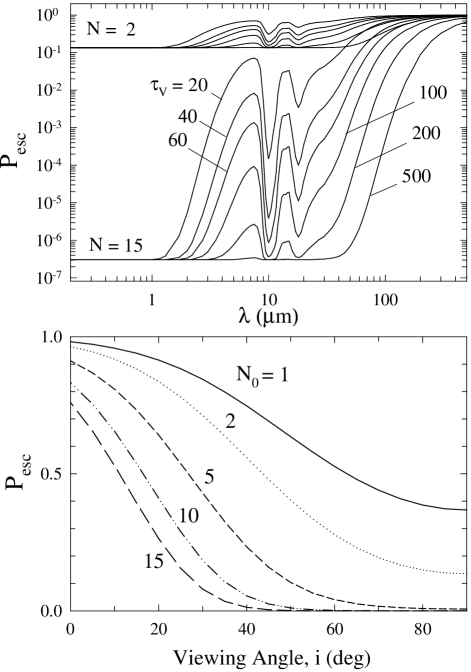
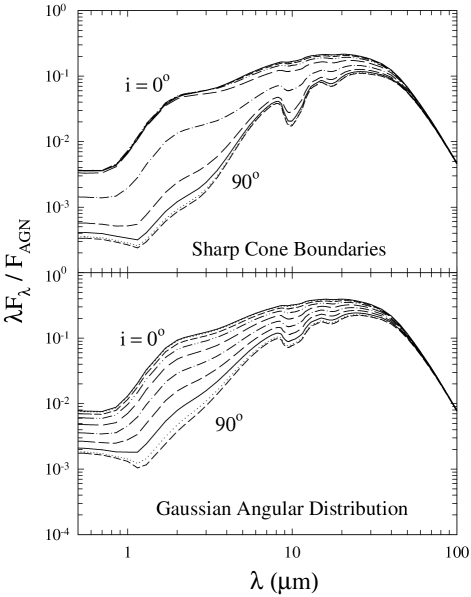
Figure 3 shows model results for sharp-edged and Gaussian angular distributions. The sharp-edge geometry produces a bimodal distribution of spectral shapes, with little dependence on viewing angle other than the abrupt change that occurs between the torus opening and the obscured region. In contrast, the Gaussian distribution produces a larger variety in model spectral shapes, with a smooth, continuous dependence on . We investigated a larger family of angular distributions of the form , with a free parameter. In this family, is the Gaussian and as increases, the transition region around becomes steeper. Generally, “softer” distributions with show behavior similar to the Gaussian while those with larger produce results similar to the sharp-edge geometry.
The SED dichotomy produced by sharp boundaries conflicts with observations. Alonso-Herrero et al. (2003) studied the 0.4–16 m nuclear emission from a complete sample of 58 Seyfert galaxies, selected from the CfA sample. In a comparison with theoretical models, Alonso-Herrero et al. point out that a common prediction of all smooth-density models is a dichotomy of SED between type 1 and 2, similar to the one displayed in the upper panel of fig. 3, and that such a dichotomy is not observed in their sample; the dichotomy is present even in model geometries with soft edges because the attenuation factor varies rapidly, resulting in a sharp transition around between dusty and dust-free viewing. As is evident from the lower panel of fig. 3, this SED dichotomy problem is solved by soft-edge clumpy tori. Therefore, in the following we consider only Gaussian angular distributions.
3.2. Observations and Model Parameters
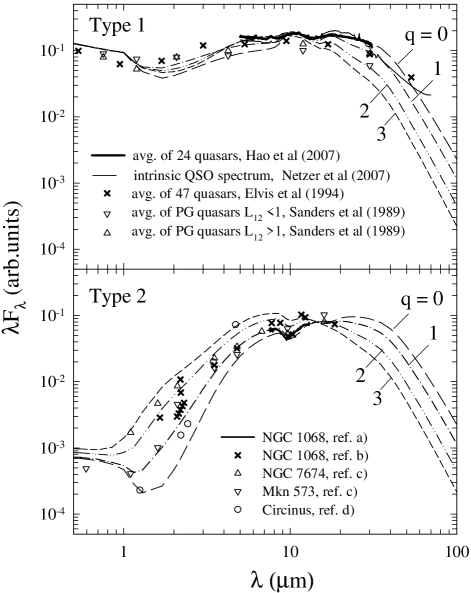
As discussed in the Introduction, torus IR observations are hampered by uncertainties that are partially alleviated by considering composite spectra. Figure 4 shows compilations of type 1 and type 2 data and some representative models, updating a similar figure presented in Nenkova et al. (2002). The type 1 data additionally include the recent Spitzer composite spectra from Hao et al. (2007) and Netzer et al. (2007). The close agreement between these two SEDs in their common spectral region, = 5–38m, indicates that they may have captured the torus emission in outline, if not in details. The upturn around 60m in the Netzer et al spectrum likely reflects the transition to starburst dominance. To ensure the smallest possible apertures in type 2 sources, the data for individual objects are mostly limited to ground based and HST observations. The data in both panels of this figure display the general characteristics that have to be reproduced by the same models in pole-on and edge-on viewing. The updated models plotted with the data differ from the original ones in Nenkova et al. (2002) in three significant ways: (1) the optical properties of the silicate component of the dust are taken from the tabulation for “cool” silicates in Ossenkopf et al. (1992) instead of the Draine & Lee (1984) dust; (2) the clouds angular distribution is Gaussian rather than sharp-edged; and (3) the torus radial thickness is 30 instead of 100. As is evident from the figure, the model spectra are generally in reasonable agreement with the data.
We produced a large number of models for various parameter sets111Tabulations of all the models discussed here as well as many additional cases are available at http://www.pa.uky.edu/clumpy/, and we now present model results and discuss their observational implications. The models are characterized by free parameters that describe individual clouds (), control the total number of clouds () and specify the geometrical properties of their angular and radial spatial distributions (, and ). Note that, except for , smooth-density models also require all of these parameters to describe the dust distribution. In the following, the parameters are varied one at a time, and from comparison with observations we attempt to identify the likely range of each of them. The effect of the radial thickness parameter is described separately in the next section (§4), devoted to a discussion of the torus size.
3.3. Single Cloud Optical Depth
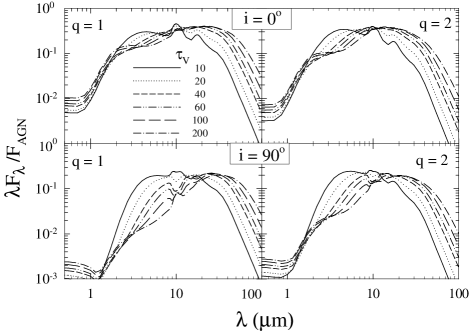
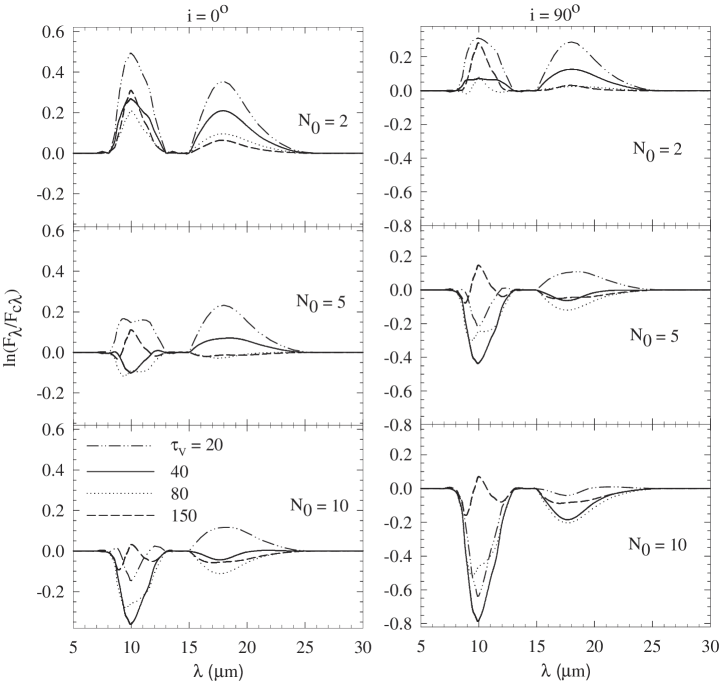
Figure 5 shows the effect of varying the optical depth of individual clouds from 10 to 200. The SED hardly varies when increases beyond 100, reflecting the similar behavior for emission from a single cloud (see Fig. 11, Part I). The figure shows the torus emission for both pole-on and edge-on viewing. Smooth-density models (e.g., Pier & Krolik, 1992; Granato & Danese, 1994) consistently produce the 10 m silicate feature in emission and absorption, respectively, for polar and equatorial viewing. As the figure shows, in a clumpy distribution the feature displays a more complex pattern, unlike anything produced in smooth-density models. At = 0∘, the feature appears in emission as long as 20. When the optical depth increases further, the feature disappears and the SED is essentially featureless across the 10m region. However, the feature reappears in weak emission when 100. At = 90∘, a weak, broad emission feature is evident when = 10. When 20, the spectra display a clear absorption feature; although similar to that of smooth-density models, the feature is never deep, reflecting the shallow absorption displayed by a single cloud (see §4.5 part I). A most peculiar result is the reversal from absorption to an emission feature, which emerges when increases beyond 100.
The complex behavior of the 10 m feature arises from a rather intricate interplay between the emission spectrum of a single cloud and the collective effect of the entire cloud ensemble. The different patterns can be understood in terms of the competition between emission and absorption along a given path, taking account of the flattening of the escape factor across the 10 m feature when is increasing (fig. 2). The behavior of the 10 m feature is studied separately at greater depth in §5.1 below.
3.4. Number of Clouds
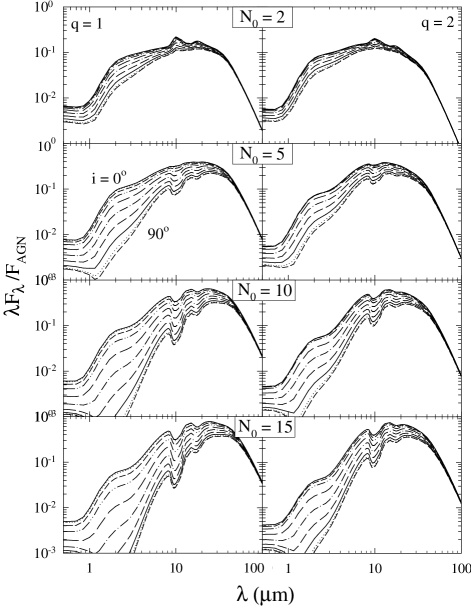
Figure 6 shows model spectra of torus emission when , the average of the total number of clouds along radial equatorial rays, varies from 2 to 15. The models produce broad IR emission in the 1–100 m range. Values of larger than 15 produce a very narrow IR bump peaking beyond 60 m. Such SED’s have not been observed thus far, therefore is likely no larger than 10–15 at most.
As is evident from figure 6, when increases, the emission in the near- to mid-IR region steepens considerably for viewing close to equatorial. Composite IR SED of Seyfert 2 galaxies constructed by Silva et al. (2004) show only mild dependence on X-ray absorbing column density as long as cm-2, with considerable steepening when is in the range – cm-2. This behavior is similar to the -dependence displayed in fig. 6, thus Compton thick X-ray absorbing columns might be correlated with a larger . For pole-on viewing, the 10 m feature appears in weak emission when . As increases, the emission switches to absorption that deepens with . Moving away from the axis, the feature displays weak emission when = 2 but appears in absorption in all other cases.
In contrast with the smooth-density case, clumpy models always display some emission at that arises from scattering of the AGN radiation toward the observer by clouds on the torus far side. Some fraction of this radiation will always get through the torus near side. The probability for that is controlled purely by the number of clouds since individual clouds are always optically thick at UV and optical wavelengths. Varying the number of clouds produces two competing effects, most clearly visible in figure 6 from the behavior of the = 1 models at = 0∘. Increasing the number of clouds from = 2 to 5 raises the level of the radiation that gets through because there are more scattering clouds. With further increase in , obscuration by intervening clouds takes over and the emerging intensity decreases. It is hard to assess the observational significance of this aspect of the results. Our models include a single type of clouds and no intercloud medium. Such a medium with an optical depth of only a few would attenuate all wavelengths shorter than 1 m in the model spectra without significantly affecting the infrared. We plan a detailed study of these effects in future work.
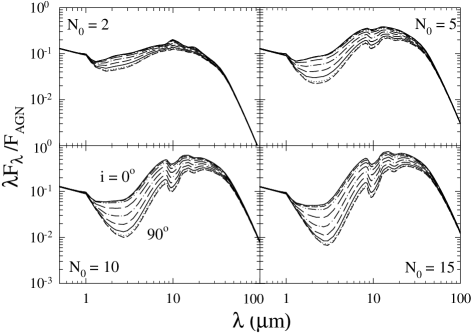
Like most models presented here, fig. 6 shows only the torus emission, corresponding to type 2 SED. Our model predictions for type 1 SED can always be obtained by adding the AGN direct radiation. However, unlike the smooth-density case, the probability for a clear view of the AGN depends not only on the viewing angle but also on the number of clouds (see §2.4). Figure 7 displays again the = 2 models shown in fig. 6, but this time the AGN contribution is added in. The probability that this would be the SED actually detected in a given source is given by the corresponding , shown in the lower panel of figure 2. When visible, the AGN dominates the emission at 3m. The transition from AGN to torus domination of the SED is an important issue that requires detailed observations of type 1 sources in the near- and mid-IR regions.
3.5. The Torus Angular Width
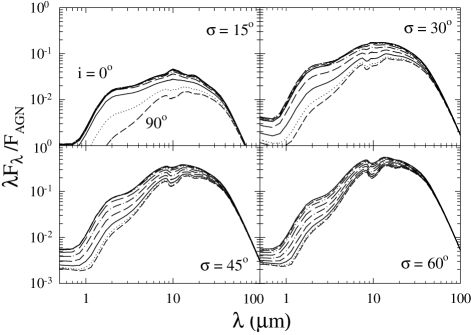
The effect of the angular distribution width is shown in figure 8, which displays results for a few representative . The spectral shapes of models with are in general agreement with observed SED but the dependence on viewing angle displays a bi-modal distribution that conflicts with observations of Seyfert galaxies (§3.1). Values in the range 30∘–50∘ produce similar spectral shapes, all in general agreement with observations. The models provide the best match to the behavior of the 10m feature in the average spectra of Seyfert 1 and 2 galaxies (see §5.1). Estimates of the torus angular width based on statistics of Seyfert galaxies that take proper account of clumpiness give 30∘ (see §6.3). At = 60∘, the 10m feature appears in pronounced absorption at all viewing angles. Increasing the width parameter further all the way to = 85∘ has little effect on the SED, except that the dependence on viewing angle decreases, as is expected from the approach to spherical symmetry.
3.6. Radial Profile and IR Emission Anisotropy
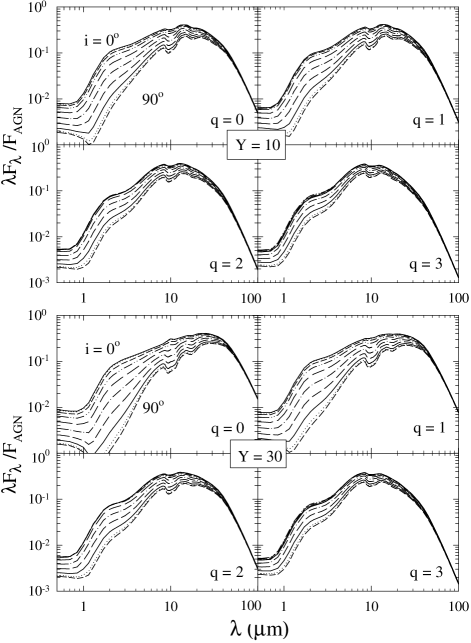
Figure 9 shows the SED when , the index of the power-law radial distribution, varies in the range 0–3 for two values of the radial thickness . Since is kept fixed, varying changes only the placement of clouds between the inner, hotter parts and the outer, cooler regions, shifting the emission between near- and far-IR. Steep radial distributions ( = 2, 3) produce nearly identical spectral shapes for = 10 and 30 because the clouds are concentrated near the inner boundary in these cases.
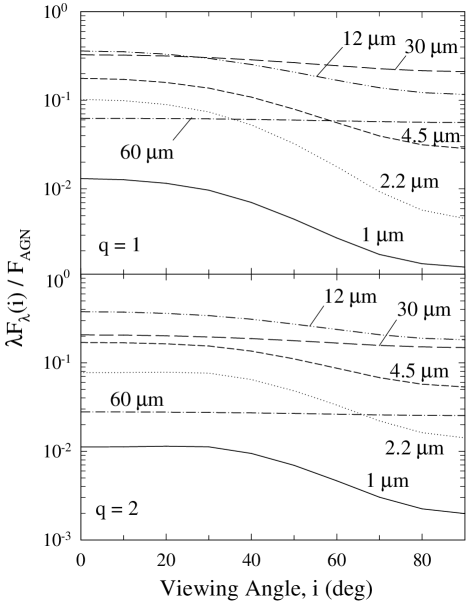
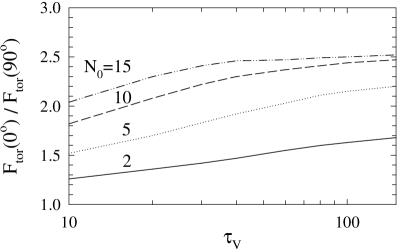
The variation of SED with viewing angle displayed in fig. 9 is much smaller than in smooth-density models (Pier & Krolik, 1992, 1993; Efstathiou & Rowan-Robinson, 1995; Granato & Danese, 1994; Granato et al., 1997; Dullemond & van Bemmel, 2005; Schartmann et al., 2005). For example, our models produce at 1 m an edge-to-pole flux ratio of about 5 or less for cloud optical depth of . In Fig. 1 from Granato et al., the corresponding flux ratio is several hundred for , and off-scale for . The degree of isotropy is especially high when the torus is small, but even in the case of = 30 the emission becomes nearly isotropic as increases (the radial distribution gets steeper). This point is further illustrated in Figure 10, which shows the viewing-angle variation of the observed flux at different wavelengths. Since the torus flux is normalized to the AGN overall flux, the quantity plotted in this figure provides the bolometric correction for each of the displayed wavelengths. The anisotropy decreases with wavelength, practically disappearing beyond the mid-IR — at = 12 m the variation with viewing-angle is within a factor of 2 for both = 1 and 2. Another indicator of the emission anisotropy is the variation of the torus bolometric flux = with viewing angle, shown in figure 11 for = 2. The variation increases with the number of clouds but remains less than a factor of 3 even when = 15, the likely upper limit.
It is important to note that at every viewing angle, the AGN obscuration is identical in all the models displayed in fig. 9; obscuration depends only on the total number of clouds along radial rays, which is the same in all cases. Indeed, for each of these models the probability for direct view of the AGN as a function of is shown by the = 5 curve in the bottom panel of figure 2. Along this curve, varies by two orders of magnitudes between polar and equatorial viewing. That is, a clumpy torus can produce extremely anisotropic obscuration of the AGN together with nearly isotropic mid-IR emission.
Recent observations seem to indicate that this is indeed the required behavior. Ground based observations of AGN nuclear emission at 10m show it to be well correlated with the hard X-ray luminosity, and both type 1 and type 2 sources follow the same correlation (Alonso-Herrero et al., 2001; Krabbe et al., 2001). Whysong & Antonucci (2004) report that the mean values for the 12 m/60 m flux ratios of Seyfert 1 and 2 galaxies differ by only 30%. Since the 60 m emission is optically thin and thus essentially isotropic (cf fig. 10), this result indicates that the variation of the 12 m flux is small. Lutz et al. (2004) compared the 6 m ISO fluxes of Seyfert 1 and Seyfert 2 galaxies normalized to their intrinsic hard X-ray fluxes. They conclude that the distributions of the two populations are essentially identical within the observational errors, and note the conflict with the anisotropy predicted by smooth-density torus models. The Lutz et al. finding was confirmed by Horst et al. (2006), who used the same approach with ground based, and thus better resolution, observations at 12 m. Buchanan et al. (2006) conducted Spitzer observations of 87 Seyfert galaxies in the = 5–35 m range and normalized the IR fluxes with the optically thin radio emission. Although at 6 m they find a larger variation than Lutz et al., they also find that the emission from Seyfert 1 and 2 galaxies are within factor 2 of each other for all 15 m, and note the discrepancy with smooth-density models. Finally, the average spectra of Seyfert 1 and 2 galaxies derived by Hao et al. (2007) from Spitzer observations have nearly identical shapes, except for the 10m silicate region.
The moderate level of anisotropy found in the observations suggests that, if the torus radial thickness is 20 then the steeper radial profile = 2 might be more appropriate than = 1. It may be noted that the clumpy torus models in Mason et al. (2006), which utilized = 100, yielded the best fits to the observations of NGC 1068 with = 2.
4. TORUS SIZE
The fraction of the sky obscured by the torus determines the relative numbers of type 1 and 2 sources, and the statistics of Seyfert galaxies show that the height and radius of obscuring dusty torus obey 1 (see §6.3). Since obscuration does not depend separately on either or , only on their ratio, neither quantity is determined individually. An actual size can only be determined from the torus emission.
4.1. SED Analysis
In the absence of high-resolution IR observations, early estimates of the torus size came from theoretical analysis of the SED. For a given dust sublimation temperature, the torus inner radius is determined from the AGN luminosity (eq. 1). The dust temperature distribution, and with it all model results, depends only on . Therefore, the only size parameter that can be determined from SED modeling is the radial thickness . Pier & Krolik (1992) performed the first detailed calculations with a uniform density torus and found 5–10. However, in subsequent work Pier & Krolik (1993) speculated that this compact structure might be embedded in a much larger, and more diffuse torus, extending typically to 30–100 pc. Granato & Danese (1994) extended the smooth-density calculations to more elaborate toroidal geometries. They conclude that “The broadness of the IR continuum of Seyfert 1 nuclei requires an almost homogeneous dust distribution extending at least to a few hundred pc (/ 300 or 300 pc)” and that “broad ( 1000 pc) tori” would be “fully consistent with available broad-band data and high-resolution IR spectra of Seyfert 1 and 2 nuclei”. Although subsequent modeling produced somewhat smaller sizes (Granato et al., 1997; Fritz et al., 2006), the original requirements of uniform density and large dimensions directly reflect the large amounts of cool dust necessary for producing the torus IR emission. This requirement arises because in smooth density distributions, the dust temperature is uniquely related to distance from the AGN. While this statement is strictly correct only for single-size dust grains, even when dust size distribution in invoked in smooth dust models, the observations still favor clumpy dust distribution (Schartmann et al., 2005).
The one-to-one correspondence between distance and temperature does not hold in clumpy media, where different dust temperatures coexist at the same distance and where the same temperature can be found at different distances (see part I, §3.1.2 and §4.2). For example, in the model discussed in Fig. 7 from part I, the dust temperature at ranges from 150 K to 600 K, while Schartmann et al. (2005) find using smooth models with realistic dust size distribution that the temperature range at is 250-300 K (i.e. a ratio of 1.2 vs. 4 for clumpy dust). In contrast with smooth density distributions, a clumpy torus contains cool dust on the dark sides of clouds much closer to the heating source and thus can emit IR efficiently from its inner regions.
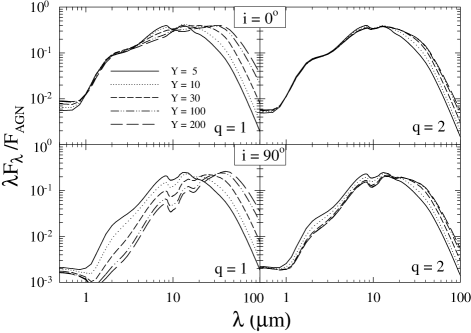
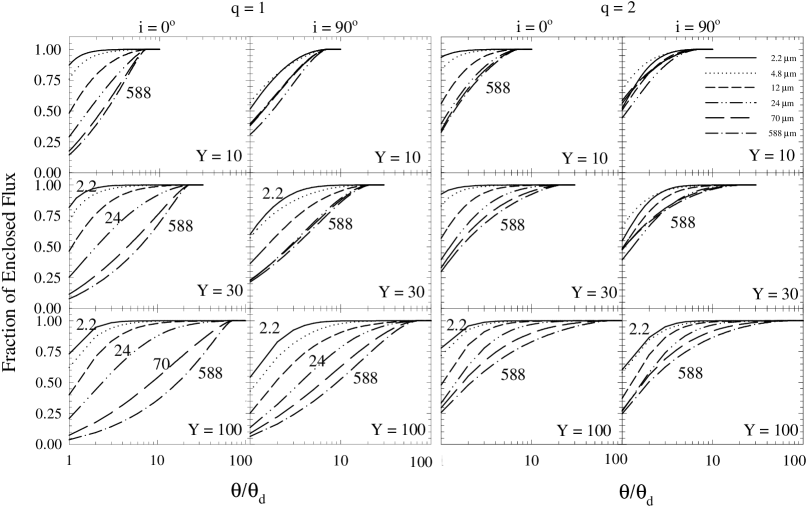
Figure 12 shows our model results for the SED of clumpy tori with various radial thicknesses for = 1 and 2. In spite of the factor 40 variation in torus thickness, the SED is quite similar for all the = 2 models. The reason is simple—irrespective of the torus size, at least 80% of all clouds are located within in this case. The models with = 1 display discernible variations, but these variations are mostly confined to . The large differences apparent at shorter wavelengths in the edge-on viewing do not reflect intrinsic variation of the SED, only the scaling with the bolometric flux. If these curves were scaled instead to the same value at, say, 2m, they would all overlap up to 15m, similar to the pole-on viewing. These differences can be further understood with the aid of figure 13, which shows the fraction of the overall flux contained within circular apertures of increasing size. This fraction, as well as the brightness distribution, is a function of (= ), where is angular displacement from the center and . The figure shows that at wavelengths shorter than 5 m, almost all the flux is originating from inside 3 irrespective of the value of . Therefore, such wavelengths cannot determine the torus size. In the = 2 case, even longer wavelengths cannot distinguish between the different sizes because 80% of the flux always originates from the inner 10 . In the = 1 case the portions beyond 10 contribute significantly to the flux of a larger torus, but only at wavelengths longer than 12–15m.
These results show that the model SED do display appreciable differences among tori of different sizes when = 1 and that determining the torus size in this case would require measurements of its flux at 15 m. Because of the large beam sizes at such long wavelengths, current observations generally cannot distinguish between the contributions of the torus and its surroundings to the overall flux. For example, as noted in the Introduction, in NGC 1068 the torus contributes less than 30% to the 10 m flux measured with apertures 1″ (Mason et al., 2006). The = 2 density profile, which might be the more common radial distribution (§3.6), does not generate any discernible distinctions among spectral shapes. Therefore, the radial size of a clumpy torus cannot be constrained by SED measurements. Only high-resolution observations can determine the torus size — the SED does not have the necessary discriminative power.
4.2. Brightness Profiles
Because of the discrete nature of a clumpy medium, different lines of sight will generally produce a different brightness even when crossing similar regions. Our formalism provides the statistical average along such rays; fluctuations around this average can be large (see §2.1, part I).
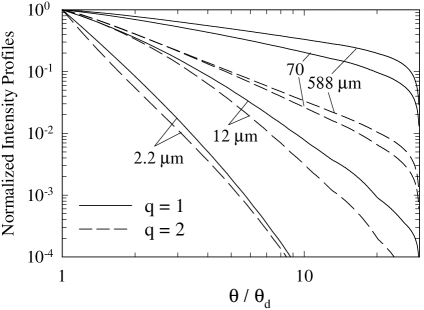
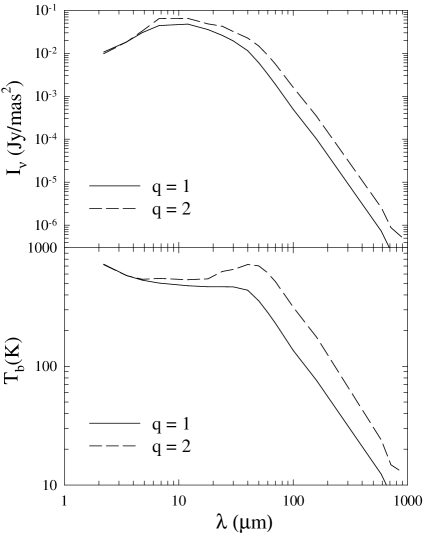
Figure 14 shows model intensity profiles for pole-on viewing of a torus with Y = 30. The curves show only the torus emission, starting at its inner edge . The AGN emission, which is not shown, would produce a narrow spike between , where and is the AGN brightness temperature (e.g., Ivezić & Elitzur, 1997). Therefore, under all circumstances. The set of displayed wavelengths extends from the -band, where most of the current imaging observations are performed, to 588 m, one of the wavelengths that will become available for high-resolution imaging when ALMA is fully operational. The torus intensity is highest on or close to its inner edge. The brightness is highest around 12 m, as is evident from the figure bottom panel. For both radial density profiles used in this figure, the brightness declines to half its peak value within at all displayed wavelengths. At 12m and shorter wavelengths, the brightness declines to 1% of peak value within . Evidently, observations attempting to probe the torus structure must combine high resolution with a large dynamic range.
Near-IR wavelengths provide little information about the torus structure and size. As is evident from the figure, at 2 m it would be difficult to distinguish between = 1 and 2 radial density distributions even with high-resolution observations. The steep brightness decline at these wavelengths also makes it practically impossible to determine the torus full size. Since the brightness falls under 1% of its peak value at for either density profile, determining whether the torus ends at that point or continues to larger radii would be a difficult task. A = 10 torus is indistinguishable from the inner 10 of a torus as large as = 100, as is evident also from figure 13. As the wavelength increases, the brightness fall-off becomes less steep. VLTI interferometry has angular resolution of order 001 at 12 m, but it would still be difficult to distinguish between the two displayed radial density profiles even in systems where is of a similar order of magnitude. The two density profiles produce distinctly different brightness profiles at 70m, but there are no instruments with the required angular resolution at that wavelength. In the foreseeable future, ALMA seems to be the only facility with a realistic chance to determine through 588 m observations the radial cloud distribution and whether a torus does extend beyond = 30.
4.3. Observations
With the advent of high-resolution IR observations, direct imaging is now available for some AGN tori, and upper limits have been set on the dimensions of the nuclear IR source in others. Interferometric observations at 8–13 m with the VLTI have resolved by now the nuclear region in three AGN: NGC 1068, Circinus and Cen A. The thermal emission in all three cases is rather compact. In NGC 1068 Jaffe et al. (2004) find that the emission extends to = 1.7 pc. Poncelet et al. (2006) reanalyzed the same data with slightly different assumptions and obtained a similar result, = 2.7 pc. The AGN bolometric luminosity is 2 erg s-1 in this case (Mason et al., 2006), so that is 0.6 pc and the torus mid-IR emission is confined within 3–5 . In Circinus, Tristram et al. (2007) find that the torus emission extends to = 1 pc. The AGN bolometric luminosity is 8 erg s-1 (Oliva et al., 1999), so 0.1 pc and the outer radius of the mid-IR emission is 10. The nature of the mid-IR emission from the Cen A nucleus is somewhat involved—Meisenheimer et al. (2007) conclude that it contains an unresolved synchrotron core and thermal emission within a radius of 0.3 pc. Since the AGN bolometric luminosity is 1 erg s-1 (Whysong & Antonucci, 2004), is 0.04 pc and the torus emission does not exceed 8 in this source. One other case of resolved mid-IR emission involves NGC 7469, where Soifer et al. (2003) find a 12.5 m compact nuclear structure contained within 13 pc. Unfortunately, NGC 7469 is a clear case where the IR signature is dominated by the starburst component even though the AGN dominates the optical classification (Weedman et al., 2005), therefore the resolved compact structure cannot be identified with the torus (see also Davies et al., 2004).
Although there are no other reports of resolved torus emission at this time, upper limits on the torus size have been reported in some additional sources. Prieto & Meisenheimer (2004) studied a number of AGN in the 1–5 m range. In all cases the observations show unresolved nuclear emission at these wavelengths, setting upper limits on the torus radius of 5–10 pc, depending on the target distance. Even more significant are the upper limits reported at mid IR. Radomski et al. (2003) place an upper limit 17 pc at 10 m and 18 m on the nuclear component in NGC 4151, while Soifer et al. (2003) place the tighter constraint 5 pc at 12.5 m. Soifer et al. also find an upper limit 14 pc for the 12.5 m compact nuclear emission in NGC 1275.
4.4. How Big is the Torus?
All current observations are consistent with a torus radial thickness that is no more than 20–30, and perhaps even as small as 5–10. Although larger values cannot be ruled out, nothing in the currently available IR data requires their existence. Similarly, molecular line observations do not give any evidence for large toroidal structures with the height-to-radius ratio 1 required from unification statistics (see §6.3 below). In NGC 1068, Schinnerer et al. (2000) find from CO velocity dispersions that at 70 pc the height of the molecular cloud distribution is only 9–10 pc, for 0.15. Galliano et al. (2003) model H2 and CO emission from the same source with a clumpy molecular disk with radius 140 pc and scale height 20 pc, for the same 0.15. Therefore, although resembling the putative torus, the distribution of these clouds does not meet the unification scheme requirement 1. Evidently, the detected molecular clouds are located in a thinner disk-like structure outside the torus. Recent 10m imaging polarimetry of NGC 1068 by Packham et al. (2007) shed some light on the continuity between the torus and the host galaxy’s nuclear environments.
As is evident from the above discussion, determining the torus actual endpoint is rather difficult, if not impossible; in fact, insisting on an endpoint for a steep distribution is meaningless in practice (with the currently available observations). The torus is embedded in the central region of the host galaxy, and the steep radial decline of its brightness implies that its emission is unlikely to be cleanly separated from the surroundings. The only observations holding realistic chance for doing that are future high resolution sub-mm measurements with ALMA. Even those would require detailed analysis that takes into account the emission from both the torus and its surrounding.
It seems safe to conclude that there is no compelling evidence at this time that torus clouds beyond 20–30 need be considered, although such large sizes cannot be excluded. From eq. 1, a conservative upper bound on the torus outer radius is then pc, where . These compact dimensions have important implications for the dynamics because they place the torus inside the region where the black hole gravity dominates over the galactic bulge. If the black hole mass is then it dominates the gravitational motions within a radius 35 pc, where , typically of order unity, is the rotation velocity (in km s-1 pc-1) induced by the galactic bulge in its interior (Elitzur & Shlosman, 2006). Since the torus is well within the black hole sphere of gravitational influence, its dynamic origin is determined in all likelihood by the central engine and its accretion disk, not by the accretion from the galaxy (see also §6.6 below).
5. SPECTRAL INDICATORS
As noted in the Introduction, reliable analysis of the torus full SED in individual sources requires data that are unavailable in most cases. We can expect flux measurements at wavelengths longer than 10 m to be severely contaminated by the torus surroundings. Even in NGC 1068, the best observed AGN, the validity of almost all observations at 10 m is questionable because the torus contributes only a fraction of the measured flux. The situation is unlikely to improve in the foreseeable future. The alternative approach to individual SED fitting is analysis of large data sets in an attempt to identify statistical trends that might constrain the likely physical range of torus parameters. Here we discuss the spectral indicators most commonly used in such analyses.
5.1. The Silicate 10 m Feature
Amorphous silicate grains have strong opacity peaks due to the Si–O stretching and the O–Si–O bending modes, leading to broad features around 10 and 18 m in the observed dust radiation. The 10 m feature, the stronger of the two, is a common analysis tool. In smooth-density torus models the 10 m feature appears in emission for face-on viewing and in absorption in edge-on viewing. As shown in §3, clumpy models produce more elaborate patterns. For detailed analysis of the features we fit a smooth curve, , to the underlying continuum of the entire spectral region by a spline connecting the intervals 5–7 m, 14–14.5 m, and 25–31.5 m. Detailed radiative transfer calculations verify that this interpolation procedure properly reproduces the emission that would be generated by dust stripped of its silicate features (Sirocky et al., 2008). Figure 15 shows the silicate feature profiles produced in some representative models. As noted above, a 10 m emission feature emerges in edge-on viewing at 100. This peculiarity arises because individual clouds become optically thick across the entire feature. The radiation emerging at this spectral range is then dominated by emission from the bright faces of clouds on the torus far side escaping through clear lines of sight. The effect becomes more pronounced as decreases.
The 10 m feature peaks at 10.0 m in the absorption coefficients from Ossenkopf et al. (1992), and radiative transfer effects introduce occasional small shifts (no larger than 0.5 m, mostly toward shorter wavelengths) around this value in the emerging spectra. To quantify the feature’s strength and width we introduce two indicators:
| (3) |
The feature strength is evaluated at the extremum near 10.0 m of the continuum-subtracted spectrum. Positive values of indicate an emission feature, negative values an absorption feature. Delineating the feature from noise in the data requires a certain minimum for the equivalent width , depending on the detection system. Our sign definitions are matched for both indicators so that absorption produces a negative , the opposite of the standard.
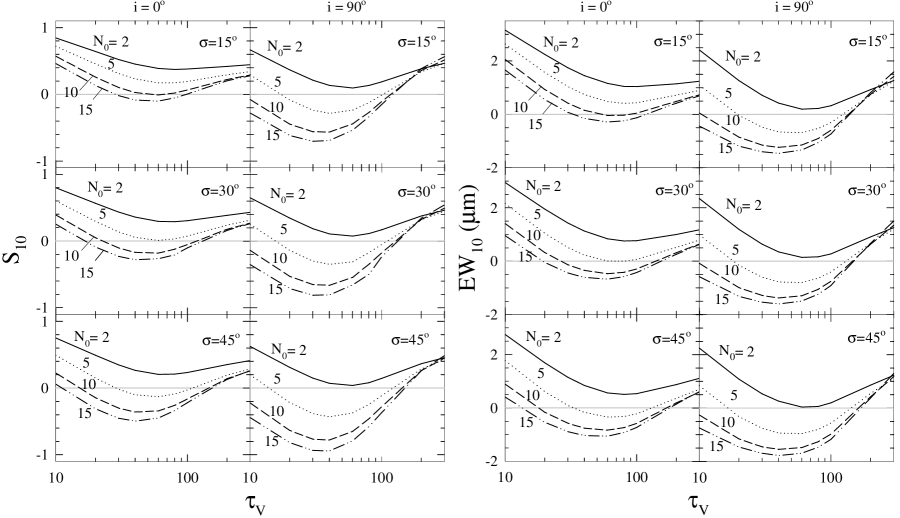
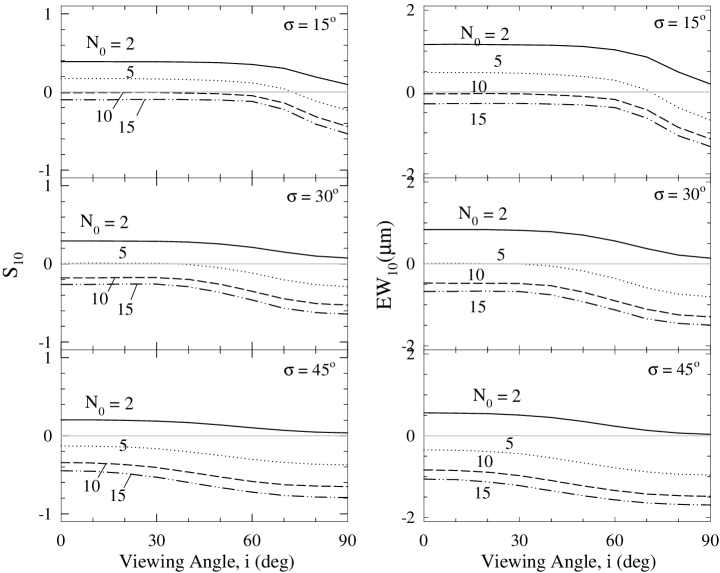
Figure 16 displays the variations of and with the single cloud optical depth for pole-on and edge-on viewing and various model parameters that bracket the likely range in AGN tori. If the feature width were the same in all models, and would be equivalent to each other222If the feature is parametrized as , where is wavelength shift from the peak, then = ln(1 + ) while ., but because of variations in the feature shape (see figure 15), contains independent information. Figure 16 shows that pole-on viewing produces an emission feature only for a limited set of parameters. Clouds heated indirectly do not produce the emission feature when (sec. 3.2, part I). The radiation from a directly illuminated cloud displays the feature in emission only toward directions with a view of a sufficiently large fraction of the cloud’s illuminated face (see fig. 12, part I). An observer along the pole of a toroidal distribution will detect an emission feature only from direct viewing of clouds located within 45∘ from the equator. Such clouds will be obscured by foreground clouds in most cases, except when the torus width is small ( = 15∘) or the overall optical depth of the clumpy medium is small (small and ). Therefore, at = 0∘, only a small region of parameter space produces models with a weak emission feature while most other parameters produce either a featureless SED or a weak absorption feature. It is also evident from figure 16 that edge-on viewing is insensitive to the angular thickness . Irrespective of optical depth, the absorption feature produced by a clumpy torus is never deep. Figure 17 shows the variation of the two indicators with viewing angle for one value of , a likely representative of actual torus clouds.
Comparison with observations is hampered by the angular resolution problem. In the Mason et al. (2006) observations of NGC1068, the feature strength in the central 04, presumably dominated by the AGN torus, is . Scanning along the ionization cones in 04 steps shows large variations in and a strong asymmetry in its spatial distribution. Measurements with larger apertures contain significant contribution from the ionization cones, and Spitzer observations may be further contaminated by still larger dusty structures. Nevertheless, when these observations produce clear differences between type 1 and type 2 sources, it seems reasonable to attribute such global trends to differences in viewing angles and to compare our model results with the observed trends while considering the actual numerical values only as guidance. The most detailed data come from the recent compilation of Spitzer mid-IR spectra by Hao et al. (2007). Although a loosely defined sample, it is the largest gathered thus far, including 24 type 1 quasars, 45 Seyfert 1 and 47 Seyfert 2 galaxies. The QSOs display almost exclusively an emission feature with , but the Seyfert 1 galaxies are clustered around zero feature strength, occupying the range . Almost all Seyfert 2 galaxies display the 10 m feature in absorption, with the distribution showing a strong peak at . In addition to the Hao et al. results, an intriguing recent development comes from the Spitzer observations of seven high-luminosity type 2 QSOs by Sturm et al. (2006). Although the individual spectra appear featureless, the sample average spectrum shows the 10 m feature in emission. More recently, Polletta et al. (2008) did find the feature in absorption in a larger sample of mid-IR selected obscured QSOs, while Weedman et al. (2006) found the 10 m feature either in absorption or absent in a sample of X-ray and mid-IR selected obscured AGN.
A striking characteristic of all AGN spectra is the absence of any deep 10 m absorption features. Given the large optical depths implied by the X-ray data, smooth dust models predict very deep absorption features. Shallow absorption features are a hallmark of clumpy dust distributions irrespective of geometry (part I), and the mild absorption strengths evident in our model results reflect this general property. In contrast, ULIRGs display features that reach extreme depths (Hao et al., 2007). This different behavior can be attributed to deep embedding in a dust distribution that is smooth, rather than clumpy Levenson et al. 2007; see also Spoon et al. 2007, Sirocky et al. 2008. In principle, cold foreground screens intercepting the intrinsic IR emission of ULIRGs could also account for the deep silicate absorption in these sources. However, such an explanation would require two distinct dust components: a very optically thick dust blanketing the primary radiation source and reprocessing its intrinsic radiation to emerge at the enormous IR luminosities that identify ULIRGs, and an additional foreground screen that absorbs the reprocessed IR radiation to produce the deep silicate absorption. To remain cold, the foreground screen cannot provide the main reprocessing of the huge intrinsic luminosity, yet it must always be aligned along the line of sight with the primary dust blanket. Furthermore, the aligned screens have to be selectively associated with ULIRGs identified with LINER- and H II-like features because, unlike AGN, these sources never show shallow absorption (see fig. 11 in Sirocky et al., 2008). Such screens present a contrived solution for the 10m absorption in ULIRGs. In contrast, a single entity of smooth-density embedding dust that is both geometrically and optically thick accounts naturally for the total IR characteristics of deeply absorbed ULIRGs.
Our calculations show that clumpy tori with = 2 never produce an absorption feature and thus are ruled out for Seyfert galaxies, though perhaps not for quasars (see §6.4 below). The properties of the 10 m feature found in Seyfert galaxies are reproduced by our models for 5–15, 15∘–45∘ and 30–100. When increases above 100, these models produce at equatorial viewing a weak 10 m emission feature with a small equivalent width, offering a potential explanation for the Sturm et al. finding in QSO2: the small equivalent width would make it hard to discern the feature in individual sources, bringing it out of the noise only in composite spectra. Therefore, if this finding is verified it could indicate that the optical depths of torus clouds perhaps are larger in QSOs than in Seyfert galaxies. However, this is not a unique interpretation. Another possible explanation is that the cloud number decreases as the luminosity increases. This point is discussed further in §6.4 below.
5.1.1 Apparent Optical Depth
The overall optical depth at visual along a radial ray in the torus equatorial plane is . With the standard dust properties employed here, the magnitude of the optical depth at 10m is . Another quantity frequently employed in data analysis of absorption features is the apparent optical depth at maximum absorption, obtained from where is the residual intensity. Therefore, from eq. 3, . When the absorption is by a cold foreground screen that does not emit itself at these wavelengths, is the actual 10m optical depth of the screen. But when the absorption arises from a temperature gradient in the emitting dust, can differ substantially from the actual optical depth, and the dependence of the two quantities on the dust column may bear little resemblance to each other. This is especially true of the torus emission. As is evident from figures 16 and 17, the relation between , the actual optical depth, and is multi-valued. Furthermore, although exceeds 300 in these figures, is never larger than unity. The apparent optical depth is a poor indicator of the actual optical depth.
5.2. Color Analysis
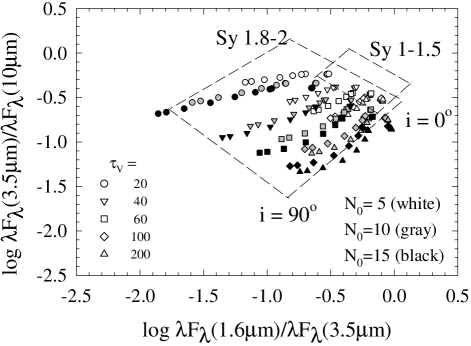
Color-color plots, showing correlations between two colors, are a useful way to separate objects with similar types of spectra and reveal underlying physical similarities. Alonso-Herrero et al. (2003) present data for nuclear fluxes from visual to 16 m for an expanded set of the CfA sample of Seyfert galaxies. Removing all known sources of bias in the original CfA selection, they have constructed what is arguably the most complete sample of AGN currently available. Torus observations at wavelengths up to 10 m are likely to be less contaminated by emission from the surroundings. From the Alonso-Herrero et al. (2003) data we find that fluxes at 1.6 m, 3.5 m and 10 m provide a useful set of colors for comparison with our model results. Compared with other combinations, the models separate better with this choice of colors because the spectral slopes change the most around the selected wavelengths. Figure 18 shows colors for sets of torus models with , , and various combinations of and . The AGN flux is added to the torus emission whenever the probability for direct view of the nucleus exceeds 50%. In each case the colors depend on the viewing angle, resulting in a track of model results. Colors corresponding to type 1 viewing populate the upper right end of the track, type 2 viewing the lower left. Model parameters that explain the observations of the 10m feature also give good qualitative agreement with the data from Alonso-Herrero et al. (2003), which fall inside the two regions delineated with dashed lines in the figure. While type 2 models are spread out along the track, type 1 are grouped together more closely at the upper end since their spectra are dominated by the AGN continuum and thus are similar despite the broad range of parameters.
6. ADDITIONAL IMPLICATIONS OF CLUMPINESS
Comparison with IR observations shows that the likely range for optical depths of individual torus clouds is 30–100 and there are 5–15 clouds, on average, along radial equatorial rays. Assuming standard dust-to-gas ratio, the column density of a single cloud is – cm-2 and the torus equatorial column density is = – cm-2. Taking account of the torus clumpiness has immediate implications for a number of other issues not directly related to its IR emission.
6.1. The Torus Mass
As shown in §2.3 of part I, the total mass in torus clouds can be written as ; note that does not involve the volume filling factor. With the cloud distribution from eq. 2 and taking for simplicity a sharp-edge angular distribution, so that the integration is analytic, the torus mass is , where = 1, and for = 2, 1 and 0, respectively. Taking from eq. 1, the mass ratio of the torus and the central black hole is
| (4) |
where is the Eddington luminosity and is the equatorial column density in cm-2. Since the radial thickness is likely 20–30 (§4), the torus mass is always negligible in comparison with when = 2. If the radial cloud distribution is flatter, eq. 4 may constrain the torus properties to keep its mass below that of the black-hole.
6.2. Total Number of Clouds
As shown in part I, the total number of clouds, , is the only torus property whose estimate involves the cloud size . Equivalently, can be replaced by the volume filling factor , since inserting eq. 2 into eq. 3 of part I yields = / at the torus inner edge. If is constant throughout the torus then for the distribution, independent of the torus radial thickness . For example, if the volume filling factor is 10%, in order to encounter = 5–10 clouds along each radial equatorial ray, the torus must contain – clouds,
6.3. AGN Unification
The classification of AGN into types 1 and 2 is based on the extent to which the nuclear region is visible. In its standard formulation, the unification approach posits the viewing angle as the sole factor in determining the AGN type, and this is indeed the case for any smooth-density torus whose column density declines with angle away from the equatorial plane. The AGN is obscured from directions that have and visible from those with . Because of the steep variation of with , the transition between these two regions is sharp, occurring around the direction where . Denote this angle then, so long as and , all AGN viewed at appear as type 1 sources, those at as type 2. If denotes the fraction of type 2 sources in the total population then for all smooth-density tori, irrespective of their specific angular profiles. This relation has been employed in all studies of source statistics performed to date. From statistics of Seyfert galaxies Schmitt et al. (2001) find that 70%, hence their estimate 45∘. The issue is currently unsettled because Hao et al. (2005) have recently found that is only about 50% in Seyfert galaxies, or 30∘.
Within the clumpy torus paradigm, the difference between types 1 and 2 is not truly an issue of orientation but of probability for direct view of the AGN. Since that probability is always finite, type 1 sources can be detected from what are typically considered type 2 orientations, even through the torus equatorial plane: if = 5, for example, the probability for that is on average. This might offer an explanation for the few Seyfert galaxies reported by Alonso-Herrero et al. (2003) to show type 1 optical line spectra together with 0.4–16 m SED that resemble type 2. Conversely, if a cloud happens to obscure the AGN from an observer, that object would be classified as type 2 irrespective of the viewing angle. In cases of such single cloud obscuration, on occasion the cloud may move out of the line-of-sight, creating a clear path to the nucleus and a transition to type 1 spectrum. The time scale for such an event is determined by the cloud size and velocity. Neither quantity can be found from the SED since optical depth is the only property of a single cloud that can be determined from SED analysis. However, at a distance (in pc) from a black-hole with mass (in ), the local Keplerian speed is km s-1 and resistance to tidal sheer implies that the size of a cloud with column density cm-2 is restricted to (e.g., Elitzur & Shlosman, 2006). The ratio of this cloud size and local Keplerian speed produces a time scale of years, an order-of-magnitude estimate for a cloud crossing time across the line of sight. Although the likelihood of catching such crossing by chance is small, transitions between type 1 and 2 line spectra have been observed in a few sources (see Aretxaga et al., 1999, and references therein), and Goodrich (1989, 1995) has argued that a couple of these cases are consistent with the change in reddening expected from cloud motion across the line of sight. It is worthwhile conducting monitoring observations in an attempt to detect additional such transitions. The most promising candidates would be obscured systems with relatively small X-ray obscuring columns, which may minimize the number of clouds along the line of sight, small torus sizes, i.e., lower luminosities, and large black-hole masses.
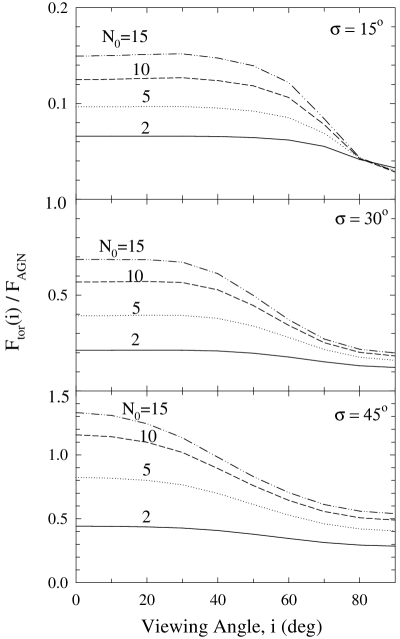
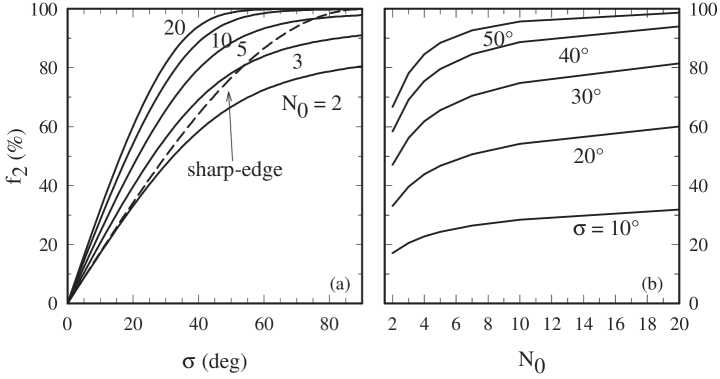
Accounting for the torus clumpiness, the fraction of type 2 sources is (eq. 9, paper I). The sharp-edge clumpy torus has , practically indistinguishable from a smooth-density torus when exceeds 3–4. However, the situation changes fundamentally for soft-edge distributions because at every viewing angle, the probability of obscuration increases with the number of clouds. As is evident from figure 19, the Gaussian distribution produces a strong dependence on and significant differences from the sharp-edge case. Since the sharp-edge angular distribution is ruled out by observations (§3.1), the fraction of obscured sources depends not only on the torus angular width but also on the average number of clouds along radial rays. While the fraction requires in the sharp-edge case, in a Gaussian clumpy torus it implies when = 5 and when = 10; in terms of the torus height and radius, (= tan) is reduced from 1 to 0.7. It is noteworthy that the behavior of the 10m feature in the models comes closest to matching the observed averages of both type 1 and type 2 AGN, as is evident from figure 16.
6.4. A Receding Torus?
The fraction of obscured AGN decreases when the bolometric luminosity increases. This has been verified in a large number of observations that estimate the luminosity dependence of either or (the fraction of unobscured sources), or differences between the luminosity functions of type 1 and 2 AGN (see Hao et al., 2005; Simpson, 2005; Maiolino et al., 2007). As is evident from figure 19, the observed decrease of when increases can be produced by either a decrease of at constant or a decrease of at constant . Both options are equally plausible because the torus inner radius increases as (eq. 1). The decreasing- option would arise if the torus height is independent of luminosity or increases more slowly than , the decreasing- option would arise if the torus outer radius is independent of luminosity or increases more slowly than .
The observed trend of to decrease with may arise from either or or both. Source statistics cannot distinguish between the various possibilities, the only way to decide between them is to find -dependence in other observable quantities. The 10 m silicate feature offers such an indicator (§5.1). Among type 1 AGN, quasars consistently produce an emission feature but Seyfert galaxies are featureless on average, displaying either weak emission or absorption scattered around zero feature strength. In type 2 AGN the feature switches from clear absorption in Seyfert galaxies to apparent emission in QSO2. That is, in both type 1 and type 2 AGN the feature moves toward emission with the increase from Seyfert to quasar luminosities. As is evident from figure 16, the decreasing- option naturally produces such a universal trend: the feature appears in emission for both pole-on and edge-on viewing when decreases to 2 at a fixed . In contrast, the decreasing- option produces the observed trend toward stronger emission feature only in type 1 AGN, not in type 2; varying has virtually no effect on the 10m feature in type 2 viewing. Explaining the switch toward apparent emission feature in QSO2 would require that in this case higher luminosities not only reduce but are also accompanied by an increase in the optical depth of individual clouds.
As is evident from this discussion, current observations, if accepted at face value and assuming that the torus contribution dominates the 10 m spectral range on average, can be explained if an increasing luminosity causes a decrease in the number of clouds . Whether or not this is also accompanied by a decrease in the torus angular width cannot be ruled in or out. Obscuration statistics and the 10m feature do not yet provide decisive information to uniquely constrain the behavior of the torus parameters with increasing luminosity.
The decreasing- scenario is known as the receding torus model, first suggested by Lawrence (1991). It is intriguing that Arshakian (2005) and Simpson (2005) derived independently an almost identical relation . However, both studies, as well as every other analysis of obscuration statistics thus far, were based on sharp-edge angular obscuration. Removing this assumption affects profoundly the foundation of the receding torus model because the dependence on the number of clouds necessitates analysis with two free parameters, therefore cannot be determined without .
6.5. X-rays and the AGN Torus
Dusty material absorbs continuum radiation both in the UV/optical and X-rays, therefore the dusty torus also provides X-ray obscuration. But dust-free gas attenuates just the X-ray continuum, so clouds inside the dust sublimation radius will provide additional obscuration only in this band.
Observations give overwhelming evidence for the orientation dependent X-ray absorption expected from AGN unification. In general, the 2–10 keV X-ray continuum is heavily obscured in type 2 sources and relatively unobscured in type 1 AGN (see Maiolino & Risaliti, 2007, and references therein). The strong orientation-dependence of the absorption cannot be attributed to the host galaxy because the AGN axis, as traced by the jet position angle, is randomly oriented with respect to the galactic disk in Seyfert galaxies (Kinney et al., 2000) and the nuclear dust disk in radio galaxies (Schmitt et al., 2002). Yet in spite of the overall correspondence between the optical and X-ray obscuration, there is a significant number of AGN for which the expected characteristics are different in the two bands. Although substantial X-ray absorption is common among type 2 AGN, there are also unabsorbed X-ray sources that present only narrow emission lines in their optical spectra. Such cases can be explained with the observational selection effect suggested by Severgnini et al. (2003) and Silverman et al. (2005): in these sources, the optical light of the host galaxy outshines the AGN continuum and broad lines. This suggestion is supported by the subsequent studies of Page et al. (2006) and Garcet et al. (2007). The opposite case, obscuration only in X-rays, exists too—there are type 1, broad line AGN with significant X-ray absorption (Perola et al., 2004; Eckart et al., 2006; Garcet et al., 2007). Extreme cases include quasars whose optical spectrum shows little or no dust extinction while their X-ray continuum is heavily affected by Compton thick absorption (Braito et al., 2004; Gallagher et al., 2006). This cannot be attributed to observational selection effects.
Obscuration that affects the X-rays but not the optical arises naturally from absorption by dust-free clouds. Conclusive evidence for such absorption comes from the short time scales for transit of X-ray absorbing clouds across the line of sight, which establish the existence of obscuring clouds inside the dust sublimation radius (Risaliti et al., 2002). Extreme cases involve 4 hour variability (Elvis et al., 2004) and variations in absorbing column of more than cm-2 within two days, indicating Compton thick X-ray absorption from a single cloud in the broad-lines region (Risaliti et al., 2007). These observations show that the torus extends inward beyond the dust sublimation point to some inner radius . Clouds at partake in X-ray absorption but do not contribute appreciably to optical obscuration or IR emission because they are dust-free. Since every cloud that attenuates the optical continuum contributes also to X-ray obscuration but not the other way round, the X-ray absorbing column always exceeds the UV/optical absorbing column, as observed (Maccacaro et al., 1982; Gaskell et al., 2007). Further, Maiolino et al. (2001) find that the X-ray absorbing column exceeds the reddening column in each member of an AGN sample by a factor ranging from 3 up to 100, implying that the bulk of the X-ray absorption comes from the clouds in the dust-free inner portion of the torus. This could explain the Guainazzi et al. (2005) finding that at least 50% of Seyfert 2 galaxies are Compton thick.
In steep radial distributions such as , which seems to adequately describe the torus dusty portion, most clouds are located close to the inner radius. If this radial profile continued inward into the dust-free zone, that region would dominate the X-ray obscuration—as observed. Similar to the optical regime, the observed fraction of X-ray absorbed AGN varies inversely with intrinsic luminosity (Ueda et al., 2003; Hasinger, 2004; Akylas et al., 2006). This fraction is usually derived from the statistics of sources that have at least one X-ray obscuring cloud along the line of sight to the AGN, therefore it follows the behavior plotted in figure 19 but with corresponding to the total number of (dusty and dust-free) clouds. As the previous section shows, either the radial thickness or the cloud number could be responsible for a decreasing . Maiolino et al. (2007) find that the fractions follow similar trends with in the X-ray and optical regimes, indicating that whichever intrinsic parameter is responsible for these trends it might behave similarly in the dusty and dust-free portions of the torus.
6.6. What is the Torus?
In the ubiquitous sketch by Urry & Padovani (1995), the AGN central region, comprised of the black hole, its accretion disk and the broad-line emitting clouds, is surrounded by a large doughnut-like structure—the torus. This hydrostatic object is a separate entity, presumably populated by molecular clouds accreted from the galaxy. Gravity controls the orbital motions of the clouds, but the origin of vertical motions capable of sustaining the “doughnut” as a hydrostatic structure whose height is comparable to its radius was recognized as a problem since the first theoretical study by Krolik & Begelman (1988).
Two different types of observations now show that the torus may be a smooth continuation of the broad lines region (BLR), not a separate entity. IR reverberation observations by Suganuma et al. (2006) show that the dust innermost radius scales with luminosity as and is uncorrelated with the black hole mass, demonstrating that the torus inner boundary is controlled by dust sublimation (eq. 1), not by dynamical processes. Moreover, in each AGN for which both data exist, the IR time lag is the upper bound on all time lags measured in the broad lines, a relation verified over a range of in luminosity. This finding shows that the BLR extends all the way to the inner boundary of the dusty torus, validating the Netzer & Laor (1993) proposal that the BLR size is bounded by dust sublimation. The other evidence is the finding by Risaliti et al. (2002) that the X-ray absorbing columns in Seyfert 2 galaxies display time variations caused by cloud transit across the line of sight. Most variations come from clouds that are dust free because of their proximity ( 0.1 pc) to the AGN, but some involve dusty clouds at a few pc. Other than the different time scales for variability, there is no discernible difference between the dust-free and dusty X-ray absorbing clouds, nor are there any gaps in the distribution.
These observations suggest that the X-ray absorption, broad line emission and dust obscuration and reprocessing are produced by a single, continuous distribution of clouds. The different radiative signatures merely reflect the change in cloud composition across the dust sublimation radius . The inner clouds are dust free. Their gas is directly exposed to the AGN ionizing continuum, therefore it is atomic and ionized, producing the broad emission lines. The outer clouds are dusty, therefore their gas is shielded from the ionizing radiation, and the atomic line emission is quenched. Instead, these clouds are molecular and dusty, obscuring the optical/UV emission from the inner regions and emitting IR. Thus the BLR occupies while the torus is simply the region. Both regions absorb X-rays, but because most of the clouds along each radial ray reside in its BLR segment, that is where the bulk of the X-ray obscuration is produced. Since the X-ray obscuration region (XOR) coincides mostly with the BLR, it seems appropriate to name this region instead BLR/XOR. By the same token, since the unification torus is just the outer portion of the cloud distribution and not an independent structure, it is appropriate to rename it the TOR for Toroidal Obscuration Region. The close proximity of BLR and TOR clouds should result in cases of partial obscuration, possibly leading to observational constraints on cloud sizes.
The merger of the ionized and the dusty clouds into a single population offers a solution to the torus vertical structure problem. Mounting evidence for cloud outflow (see, e.g., Elvis, 2004) indicates that instead of a hydrostatic “doughnut”, the TOR is just one region in the clumpy wind coming off the black-hole accretion disk (see Elitzur & Shlosman, 2006, and references therein). The accretion disk appears to be fed by a midplane influx of cold, clumpy material from the main body of the galaxy. Approaching the center, conditions for developing hydromagnetically- or radiatively-driven winds above this equatorial inflow become more favorable. The disk-wind rotating geometry provides a natural channel for angular momentum outflow from the disk and is found on many spatial scales, from protostars to AGN (Blandford & Payne, 1982; Emmering et al., 1992; Ferreira, 2007). The composition along each streamline reflects the origin of the outflow material at the disk surface. The disk outer regions are dusty and molecular, as observed in water masers in some edge-on cases (Greenhill, 2005). At smaller radii the dust is destroyed and the disk composition switches to atomic and ionized, producing a double-peak signature in some emission line profiles (Eracleous, 2004). The outflow from the atomic and ionized inner region feeds the BLR and produces many atomic line signatures, including evidence for the disk wind geometry (Hall et al., 2003). Clouds uplifted from the disk dusty and molecular outer region feed the TOR and may have been detected in water maser observations of Circinus (Greenhill et al., 2003) and NGC 3079 (Kondratko et al., 2005). Indeed, Elitzur & Shlosman (2006) derive the cloud properties from constraints deduced from clumpy models for the IR emission and find that they provide the right conditions for H2O maser action. In both the inner and outer outflow regions, as the clouds rise and move away from the disk they expand and lose their column density, limiting the vertical scope of X-ray absorption, broad line emission and dust obscuration and emission. The result is a toroidal geometry for both the BLR/XOR and the TOR. Because of the strong photoionization heating of BLR clouds they may rise to relatively lower heights than the TOR dusty clouds. Detailed comparisons of X-ray and optical obscuration in individual sources and in large samples should help to constrain the parameters , and separately for the TOR and the BLR/XOR. Such comparisons must consider the large scatter of obscuration in individual sources around the sample mean (see paper I, §4.2). In the outflow scenario, the TOR disappears when the bolometric luminosity decreases below erg s-1 because the accretion onto the central black hole can no longer sustain the required cloud outflow rate (Elitzur & Shlosman, 2006; Elitzur, 2007). With further luminosity decrease, suppression of cloud outflow spreads radially inward and the BLR, too, disappears. The recent review by Ho (2008) presents extensive observational evidence for the disappearance of the torus and the BLR in low luminosity AGN.
The Circinus Seyfert 2 core provides the best glimpse of the AGN dusty/molecular component. Water masers trace both a Keplerian disk and a disk outflow (Greenhill et al., 2003). Dust emission at 8–13m shows a disk embedded in a slightly cooler and larger, geometrically thick torus (Tristram et al., 2007). The dusty disk coincides with the maser disk in both orientation and size. The outflow masers trace only parts of the torus. The lack of full coverage can be attributed to the selectivity of maser operation—strong emission requires both pump action to invert the maser molecules in individual clouds and coincidence along the line of sight in both position and velocity of two maser clouds (Kartje et al., 1999). Proper motion measurements and comparisons of the disk and outflow masers offer a most promising means to probe the structure and motion of TOR clouds.
7. SUMMARY AND DISCUSSION
We have developed a formalism for handling radiative transfer in clumpy media and applied it to the IR emission from the AGN dusty torus. In the calculations we execute only the first two steps of the full iteration procedure outlined in §3.2, paper I, and the moderate total number of clouds considered here validates this procedure. When that number increases, the probability for unhindered view of the AGN decreases, the role of indirectly heated clouds becomes more prominent and eventually requires higher order iterations. Our current calculations employ some additional simplifying approximations: The grain mixture is handled in the composite-grain approximation, all dust is in clouds without an inter-cloud medium and all clouds are identical. We have already begun work on removing these assumptions and will report the results in future publications.
In contrast with the smooth-density case, the clumpy problem is not well defined because clouds can have arbitrary shapes, and any given set of parameters can have many individual realizations. Our formalism invokes a statistical approach for calculating an average behavior, and it is encouraging that other approaches produce similar results. Dullemond & van Bemmel (2005) conduct “quasi-clumpy” calculations in which the torus is modeled as a set of axisymmetric rings, and compare the results with the smooth-density case. In agreement with our conclusions they find that only smooth-density models can produce very deep absorption feature while clumpy dust produces stronger near-IR, broader SED and much more isotropic IR emission. Hönig et al. (2006) employ 3D Monte carlo calculations that bypass some of our approximations. They also treat different cloud realizations for the same global parameters, allowing them to show the intrinsic scatter in SED due to the stochastic nature of the problem. Their results are in agreement with ours, validating our approach and the approximations we employ. Since the dust properties in their calculations are from Draine & Lee (1984), the 10 m feature reaches somewhat larger strengths than in our calculations, which employ the Ossenkopf et al. (1992) “cool” dust but are similar to our original results in Nenkova et al. 2002, which also employed Draine & Lee dust. In spite of these differences, Hönig et al. (2006) too find that the silicate absorption feature is never as deep as expected for a uniform dust distribution, and obtain qualitatively similar behavior of the silicate emission feature and overall SED shape.
The models presented here show that clumpy torus models are consistent with current AGN observations if they contain 5–15 dusty clouds along radial equatorial rays, each with an optical depth 30–100. The cloud angular distribution should decline smoothly toward the axis, for example, a Gaussian profile centered on the equatorial plane. Power-law radial distributions – produce adequate results. Dust grains with optical properties of the standard Galactic mixture provide satisfactory explanation to the IR observations. The behavior of the 10m silicate feature, in particular the lack of any deep absorption features, is reproduced naturally without the need to invoke any special dust properties. Several suggestions that the abundance or composition of AGN dust might differ from its Galactic counterpart can be discarded because of subsequent developments. Risaliti et al. (1999) note that, assuming standard dust abundance, the large column densities discovered in X-ray absorption imply torus masses in excess of the dynamical mass, posing a problem for the system stability. However, their mass estimates were based on the uniform mass distribution and large torus sizes derived from smooth-density models. The compact sizes and steep density distributions of clumpy models eliminate the problem (see §6.1). Maiolino et al. (2001) suggested that the widely different UV and X-ray extinctions they found in individual sources could imply low dust abundance, but the subsequent discovery of rapid variations shows that X-ray obscuration by dust-free clouds is the more likely explanation (see §6.5). They also invoked the lack of prominent 10m absorption features as an indication that AGN dust is different from Galactic, but this is a natural consequence of clumpy dust distributions (see §5.1). Intrinsic extinction curves deduced from spectral analysis of type 1 sources see Czerny 2007 for a recent review and a comprehensive discussion of uncertainties generally indicate a depletion of small grains, as could be expected: the obscuration in type 1 sources is dominated by the dusty clouds closest to the center and these clouds contain predominantly large grains, which survive at the smallest distances from the AGN (see §2.1). There is no compelling evidence for significant differences between the properties of AGN and Galactic dust. Other dust compositions are not ruled out, but nothing in the current data requires major departures from the dust grains we use.
The close proximity of dust temperatures as different as 800 K and 200–300 K found in interferometry around 12m cannot be explained by smooth-density models even when they account for the individual temperatures of grains with different sizes (Schartmann et al., 2005). Clumpiness resolves this puzzling observation because the dust on the dark side of an optically thick cloud is much cooler than on the bright side. Thanks to the mixture of different dust temperatures at the same radial distance, clumpy models naturally explain the torus compact size. In spite of the high anisotropy of its obscuration, the torus emission is observed to be nearly isotropic at 12 m. Clumpy models resolve this puzzle too, since the emission from a torus with radial thickness = 10 varies little with viewing angle. The variation is especially small if the radial distribution is or steeper, and such steep radial profiles maintain a nearly isotropic emission even at larger torus sizes.
In addition to IR observations, clumpiness significantly impacts the analysis of other data, in particular obscuration statistics. The fraction of obscured sources is controlled not only by the torus angular thickness , as in all analyses to date, but also by the cloud number . With = 5, a 70% fraction of type 2 AGN implies 30∘ instead of the standard 45∘. Observations indicate that increasing the bolometric luminosity from the Seyfert to the quasar regime induces (1) a decrease of and (2) a switch to emission feature at 10 m for both type 1 and some type 2 AGN. Both trends can be explained with a change in a single torus parameter— decreases from 5 in Seyfert galaxies to 2 in QSO (see figures 16 and 19). Decreasing , the scenario known as the receding torus model, explains the first trend but has no effect on the second. The emergence of the 10 m in emission would require in this case the additional increase of individual clouds optical depth to 100 in QSO.
The decreasing- scenario provides the simplest explanation for the trends observed when is increasing, but that does not guarantee its validity. This demonstrates the difficulties in deducing the model parameters from observations that cannot yet resolve the torus basic ingredient—the individual dusty clouds. The problem is compounded by the lack of angular resolution that hinders clean separation of the torus component from the flux measured at most IR wavelengths and by the degeneracies of the radiative transfer solutions that prevent decisive, one-to-one associations between model parameters and observable quantities. The only practical way around these difficulties is to match trends identified in the data with similar general properties of the models.
Our main conclusions can be summarized as follows:
-
•
The torus angular distribution has to be soft edged
-
•
Clumpy models can produce nearly isotropic IR emission together with extremely anisotropic obscuration
-
•
Clumpy models can explain all current observations with compact torus sizes; SED fitting is a poor constraint on the size
-
•
Standard interstellar dust describes adequately AGN observations; there does not seem to be a need for any major modifications of grain properties
-
•
Clumpy sources never produce a very deep silicate feature; apparent optical depth, obtained from where is the residual intensity at maximum absorption, is a poor indicator of the actual optical depth
-
•
The probability for direct line-of-sight to the AGN at large viewing angles is small, but not zero
-
•
The statistics of obscured sources depend on both the torus angular thickness and the number of clouds along radial rays
-
•
The torus and the BLR are the dusty (outer) and dust-free (inner) regions in a continuous cloud distribution; a more appropriate designation for the torus is Toroidal Obscuration Region (TOR)
-
•
X-ray obscuration comes from both TOR and, predominantly, BLR clouds
As long as IR observations are incapable of resolving individual torus clouds, one must rely on the combined evidence for clumpy structure instead of on a “smoking gun”. Individual TOR clouds seem to have been resolved in observations of outflow water masers in Circinus and NGC 3079. Proper motion measurements and comparison of these masers with their disk counterparts provide the most promising method for probing the TOR structure and kinematics. The Circinus AGN, whose dust emission has been resolved in VLTI observations, is an especially attractive target for studying the dusty and molecular content of TOR clouds.
ACKNOWLEDGMENTS
Part of this work was performed while M.E. spent a most enjoyable sabbatical at LAOG, Grenoble. We thank Almudena Alonso-Herrero, Nancy Levenson and Maria Polletta for useful comments on the manuscript. Partial support by NSF and NASA is gratefully acknowledged.
Appendix A TECHNICALITIES
The relevant coordinates in describing both the cloud distribution and the source function are the cloud’s radial distance , angle from the equatorial plane and the angle between its radius vector and the AGN–observer axis (see eq. 2, and part I figure 2 and eq. 8). The torus emission requires an integration along a path inclined by the viewing angle from the torus axis at some displacement from the center (eq. 5, part I). To handle the geometry we introduce a cartesian coordinate system centered on the AGN with toward the observer and – in the plane of the sky, with the torus axis in the – plane at angle from the axis. The integration path is specified by its fixed values of and , so that the angular displacement is and the angular impact parameter in brightness profiles is . The integration variable is . At any point along the path, the cloud coordinates are found from
| (A1) |
The path integration in eq. 5, part I, produces the intensity generated by the cloud distribution. Since our source function calculations involve only the first two steps of the full iteration procedure described in §3.2, part I, we must introduce a correction to take proper account of flux conservation. With the fraction of the AGN luminosity that gets through the torus (eq. 8, part I), we calculate , the brightness map of clumpy torus emission in the direction , from
| (A2) |
Here () and () are, respectively, the source function and column density of clouds at position along the integration path, and is the probability for a photon of frequency to escape from that point through the rest of the path. The torus flux at distance and viewing angle is calculated from . With these expressions, the spectral shape is determined from the first two iteration steps while ensuring that the torus emission properly obeys flux conservation (eq. 17, part I).
The quantity is intrinsically a function of scaled variables, , because the brightness at position depends only on the distribution of dust in temperature and optical depth along the path (Ivezić & Elitzur, 1997). Therefore, from eq. A2 the brightness has the form , where is a dimensionless function of the scaled angular displacements. Since the brightness scale is determined by the dust sublimation temperature (eq. 1) , the only effect of the luminosity is to set the overall angular scale , effecting a self-similar stretch of the brightness map. Similarly, the flux, , is a product of the bolometric flux and a luminosity-independent spectral shape.
References
- Akylas et al. (2006) Akylas, A., Georgantopoulos, I., Georgakakis, A., Kitsionas, S., & Hatziminaoglou, E. 2006, A&A, 459, 693
- Alonso-Herrero et al. (2003) Alonso-Herrero, A., Quillen, A. C., Rieke, G. H., Ivanov, V. D., & Efstathiou, A. 2003, AJ, 126, 81
- Alonso-Herrero et al. (2001) Alonso-Herrero, A., Quillen, A. C., Simpson, C., Efstathiou, A., & Ward, M. J. 2001, AJ, 121, 1369
- Aretxaga et al. (1999) Aretxaga, I., Joguet, B., Kunth, D., Melnick, J., & Terlevich, R. J. 1999, ApJ, 519, L123
- Arshakian (2005) Arshakian, T. G. 2005, A&A, 436, 817
- Barvainis (1987) Barvainis, R. 1987, ApJ, 320, 537
- Blandford & Payne (1982) Blandford, R. D., & Payne, D. G. 1982, MNRAS, 199, 883
- Braito et al. (2004) Braito, V. et al. 2004, A&A, 420, 79
- Buchanan et al. (2006) Buchanan, C. L., Gallimore, J. F., O’Dea, C. P., Baum, S. A., Axon, D. J., Robinson, A., Elitzur, M., & Elvis, M. 2006, AJ, 132, 401
- Crenshaw & Kraemer (2000) Crenshaw, D. M., & Kraemer, S. B. 2000, ApJ, 532, L101
- Czerny (2007) Czerny, B. 2007, in ASP Conf. Ser. 373: The Central Engine of Active Galactic Nuclei, ed. L. C. Ho & J.-W. Wang, 586
- Davies et al. (2004) Davies, R. I., Tacconi, L. J., & Genzel, R. 2004, ApJ, 602, 148
- Draine & Lee (1984) Draine, B. T., & Lee, H. M. 1984, ApJ, 285, 89
- Dullemond & van Bemmel (2005) Dullemond, C. P., & van Bemmel, I. M. 2005, A&A, 436, 47
- Eckart et al. (2006) Eckart, M. E., Stern, D., Helfand, D. J., Harrison, F. A., Mao, P. H., & Yost, S. A. 2006, ApJS, 165, 19
- Efstathiou & Rowan-Robinson (1995) Efstathiou, A., & Rowan-Robinson, M. 1995, MNRAS, 273, 649
- Elitzur (2006) Elitzur, M. 2006, New Astronomy Review, 50, 728
- Elitzur (2007) Elitzur, M. 2007, in ASP Conf. Ser. 373: The Central Engine of Active Galactic Nuclei, ed. L. C. Ho & J.-M. Wang, 415–424
- Elitzur et al. (2004) Elitzur, M., Nenkova, M., & Ivezić, Ž. 2004, in ASP Conf. Ser. 320: The Neutral ISM in Starburst Galaxies, ed. S. Aalto, S. Huttemeister, & A. Pedlar, 242–252
- Elitzur & Shlosman (2006) Elitzur, M., & Shlosman, I. 2006, ApJ, 648, L101
- Elvis (2004) Elvis, M. 2004, in ASP Conf. Ser. 311: AGN Physics with the Sloan Digital Sky Survey, ed. G. T. Richards & P. B. Hall, 109
- Elvis et al. (2004) Elvis, M., Risaliti, G., Nicastro, F., Miller, J. M., Fiore, F., & Puccetti, S. 2004, ApJ, 615, L25
- Elvis et al. (1994) Elvis, M. et al. 1994, ApJS, 95, 1
- Emmering et al. (1992) Emmering, R. T., Blandford, R. D., & Shlosman, I. 1992, ApJ, 385, 460
- Eracleous (2004) Eracleous, M. 2004, in ASP Conf. Ser. 311: AGN Physics with the Sloan Digital Sky Survey, ed. G. T. Richards & P. B. Hall, 183
- Ferreira (2007) Ferreira, J. 2007, in Lecture Notes in Physics, Berlin Springer Verlag, 723, ed. J. Ferreira, C. Dougados, & E. Whelan, 181
- Fritz et al. (2006) Fritz, J., Franceschini, A., & Hatziminaoglou, E. 2006, MNRAS, 366, 767
- Gallagher et al. (2006) Gallagher, S. C., Brandt, W. N., Chartas, G., Priddey, R., Garmire, G. P., & Sambruna, R. M. 2006, ApJ, 644, 709
- Galliano et al. (2003) Galliano, E., Alloin, D., Granato, G. L., & Villar-Martín, M. 2003, A&A, 412, 615
- Gallimore et al. (2001) Gallimore, J. F., Henkel, C., Baum, S. A., Glass, I. S., Claussen, M. J., Prieto, M. A., & Von Kap-herr, A. 2001, ApJ, 556, 694
- Garcet et al. (2007) Garcet, O. et al. 2007, A&A, 474, 473
- Gaskell et al. (2007) Gaskell, C. M., Klimek, E. S., & Nazazrova, L. S. 2007, ApJ, submitted (arXiv:0711.1025)
- Goodrich (1989) Goodrich, R. W. 1989, ApJ, 340, 190
- Goodrich (1995) —. 1995, ApJ, 440, 141
- Granato & Danese (1994) Granato, G. L., & Danese, L. 1994, MNRAS, 268, 235
- Granato et al. (1997) Granato, G. L., Danese, L., & Franceschini, A. 1997, ApJ, 486, 147
- Gratadour et al. (2003) Gratadour, D., Clénet, Y., Rouan, D., Lai, O., & Forveille, T. 2003, A&A, 411, 335
- Greenhill (2005) Greenhill, L. J. 2005, in ASP Conf. Ser. 340: Future Directions in High Resolution Astronomy, ed. J. Romney & M. Reid, 203
- Greenhill et al. (2003) Greenhill, L. J. et al. 2003, ApJ, 590, 162
- Greenhill & Gwinn (1997) Greenhill, L. J., & Gwinn, C. R. 1997, Ap&SS, 248, 261
- Guainazzi et al. (2005) Guainazzi, M., Matt, G., & Perola, G. C. 2005, A&A, 444, 119
- Hall et al. (2003) Hall, P. B., Hutsemékers, D., Anderson, S. F., Brinkmann, J., Fan, X., Schneider, D. P., & York, D. G. 2003, ApJ, 593, 189
- Hao et al. (2005) Hao, L. et al. 2005, AJ, 129, 1795
- Hao et al. (2007) Hao, L., Weedman, D. W., Spoon, H. W. W., Marshall, J. A., Levenson, N. A., Elitzur, M., & Houck, J. R. 2007, ApJ, 655, L77
- Hasinger (2004) Hasinger, G. 2004, Nuclear Physics B Proceedings Supplements, 132, 86
- Ho (2008) Ho, L. C. 2008, ARA&A, in press (arXiv0803.2268)
- Hönig et al. (2006) Hönig, S. F., Beckert, T., Ohnaka, K., & Weigelt, G. 2006, A&A, 452, 459
- Horst et al. (2006) Horst, H., Smette, A., Gandhi, P., & Duschl, W. J. 2006, A&A, 457, L17
- Ivezić & Elitzur (1997) Ivezić, Ž., & Elitzur, M. 1997, MNRAS, 287, 799
- Jaffe et al. (2004) Jaffe, W. et al. 2004, Nature, 429, 47
- Kartje et al. (1999) Kartje, J. F., Königl, A., & Elitzur, M. 1999, ApJ, 513, 180
- Kinney et al. (2000) Kinney, A. L., Schmitt, H. R., Clarke, C. J., Pringle, J. E., Ulvestad, J. S., & Antonucci, R. R. J. 2000, ApJ, 537, 152
- Kondratko et al. (2005) Kondratko, P. T., Greenhill, L. J., & Moran, J. M. 2005, ApJ, 618, 618
- Krabbe et al. (2001) Krabbe, A., Böker, T., & Maiolino, R. 2001, ApJ, 557, 626
- Krolik & Begelman (1988) Krolik, J. H., & Begelman, M. C. 1988, ApJ, 329, 702
- Lawrence (1991) Lawrence, A. 1991, MNRAS, 252, 586
- Levenson et al. (2007) Levenson, N. A., Sirocky, M. M., Hao, L., Spoon, H. W. W., Marshall, J. A., Elitzur, M., & Houck, J. R. 2007, ApJ, 654, L45
- Lutz et al. (2004) Lutz, D., Maiolino, R., Spoon, H. W. W., & Moorwood, A. F. M. 2004, A&A, 418, 465
- Maccacaro et al. (1982) Maccacaro, T., Perola, G. C., & Elvis, M. 1982, ApJ, 257, 47
- Maiolino et al. (2001) Maiolino, R., Marconi, A., Salvati, M., Risaliti, G., Severgnini, P., Oliva, E., La Franca, F., & Vanzi, L. 2001, A&A, 365, 28
- Maiolino & Risaliti (2007) Maiolino, R., & Risaliti, G. 2007, in ASP Conf. Ser. 373: The Central Engine of Active Galactic Nuclei, ed. L. C. Ho & J.-M. Wang, 447–457
- Maiolino et al. (2007) Maiolino, R., Shemmer, O., Imanishi, M., Netzer, H., Oliva, E., Lutz, D., & Sturm, E. 2007, A&A, 468, 979
- Mason et al. (2006) Mason, R. E., Geballe, T. R., Packham, C., Levenson, N. A., Elitzur, M., Fisher, R. S., & Perlman, E. 2006, ApJ, 640, 612
- Meisenheimer et al. (2007) Meisenheimer, K. et al. 2007, A&A, 471, 453
- Minezaki et al. (2004) Minezaki, T., Yoshii, Y., Kobayashi, Y., Enya, K., Suganuma, M., Tomita, H., Aoki, T., & Peterson, B. A. 2004, ApJ, 600, L35
- Nenkova et al. (2002) Nenkova, M., Ivezić, Ž., & Elitzur, M. 2002, ApJ, 570, L9
- Nenkova et al. (2008) Nenkova, M., Sirocky, M. M., Ivezić, Ž., & Elitzur, M. 2008, ApJ, submitted
- Netzer & Laor (1993) Netzer, H., & Laor, A. 1993, ApJ, 404, L51
- Netzer et al. (2007) Netzer, H. et al. 2007, ApJ, 666, 806
- Oliva et al. (1999) Oliva, E., Marconi, A., & Moorwood, A. F. M. 1999, A&A, 342, 87
- Ossenkopf et al. (1992) Ossenkopf, V., Henning, T., & Mathis, J. S. 1992, A&A, 261, 567
- Packham et al. (2007) Packham, C. et al. 2007, ApJ, 661, L29
- Page et al. (2006) Page, M. J. et al. 2006, MNRAS, 369, 156
- Perola et al. (2004) Perola, G. C. et al. 2004, A&A, 421, 491
- Pier & Krolik (1992) Pier, E. A., & Krolik, J. H. 1992, ApJ, 401, 99
- Pier & Krolik (1993) —. 1993, ApJ, 418, 673
- Polletta et al. (2008) Polletta, M., Weedman, D., Hönig, S., Lonsdale, C. J., Smith, H. E., & Houck, J. 2008, ApJ, 675, 960
- Poncelet et al. (2007) Poncelet, A., Doucet, C., Perrin, G., Sol, H., & Lagage, P. O. 2007, A&A, 472, 823
- Poncelet et al. (2006) Poncelet, A., Perrin, G., & Sol, H. 2006, A&A, 450, 483
- Prieto & Meisenheimer (2004) Prieto, M. A., & Meisenheimer, K. 2004, in IAU Symposium, ed. T. Storchi-Bergmann, L. C. Ho, & H. R. Schmitt, 57–60
- Prieto et al. (2004) Prieto, M. A. et al. 2004, ApJ, 614, 135
- Radomski et al. (2003) Radomski, J. T., Piña, R. K., Packham, C., Telesco, C. M., De Buizer, J. M., Fisher, R. S., & Robinson, A. 2003, ApJ, 587, 117
- Risaliti et al. (2007) Risaliti, G., Elvis, M., Fabbiano, G., Baldi, A., Zezas, A., & Salvati, M. 2007, ApJ, 659, L111
- Risaliti et al. (2002) Risaliti, G., Elvis, M., & Nicastro, F. 2002, ApJ, 571, 234
- Risaliti et al. (1999) Risaliti, G., Maiolino, R., & Salvati, M. 1999, ApJ, 522, 157
- Sanders et al. (1989) Sanders, D. B., Phinney, E. S., Neugebauer, G., Soifer, B. T., & Matthews, K. 1989, ApJ, 347, 29
- Schartmann et al. (2005) Schartmann, M., Meisenheimer, K., Camenzind, M., Wolf, S., & Henning, T. 2005, A&A, 437, 861
- Schinnerer et al. (2000) Schinnerer, E., Eckart, A., Tacconi, L. J., Genzel, R., & Downes, D. 2000, ApJ, 533, 850
- Schmitt et al. (2001) Schmitt, H. R., Antonucci, R. R. J., Ulvestad, J. S., Kinney, A. L., Clarke, C. J., & Pringle, J. E. 2001, ApJ, 555, 663
- Schmitt et al. (2002) Schmitt, H. R., Pringle, J. E., Clarke, C. J., & Kinney, A. L. 2002, ApJ, 575, 150
- Severgnini et al. (2003) Severgnini, P. et al. 2003, A&A, 406, 483
- Silva et al. (2004) Silva, L., Maiolino, R., & Granato, G. L. 2004, MNRAS, 355, 973
- Silverman et al. (2005) Silverman, J. D. et al. 2005, ApJ, 618, 123
- Simpson (2005) Simpson, C. 2005, MNRAS, 360, 565
- Sirocky et al. (2008) Sirocky, M. M., Levenson, N. A., Elitzur, M., Spoon, H. W. W., & Armus, L. 2008, ApJ, 678, 729
- Soifer et al. (2003) Soifer, B. T., Bock, J. J., Marsh, K., Neugebauer, G., Matthews, K., Egami, E., & Armus, L. 2003, AJ, 126, 143
- Spoon et al. (2007) Spoon, H. W. W., Marshall, J. A., Houck, J. R., Elitzur, M., Hao, L., Armus, L., Brandl, B. R., & Charmandaris, V. 2007, ApJ, 654, L49
- Sturm et al. (2006) Sturm, E., Hasinger, G., Lehmann, I., Mainieri, V., Genzel, R., Lehnert, M. D., Lutz, D., & Tacconi, L. J. 2006, ApJ, 642, 81
- Suganuma et al. (2006) Suganuma, M. et al. 2006, ApJ, 639, 46
- Treister et al. (2004) Treister, E. et al. 2004, ApJ, 616, 123
- Tristram et al. (2007) Tristram, K. R. W. et al. 2007, A&A, 474, 837
- Ueda et al. (2003) Ueda, Y., Akiyama, M., Ohta, K., & Miyaji, T. 2003, ApJ, 598, 886
- Urry & Padovani (1995) Urry, C. M., & Padovani, P. 1995, PASP, 107, 803
- Weedman et al. (2006) Weedman, D. et al. 2006, ApJ, 653, 101
- Weedman et al. (2005) Weedman, D. W. et al. 2005, ApJ, 633, 706
- Weigelt et al. (2004) Weigelt, G., Wittkowski, M., Balega, Y. Y., Beckert, T., Duschl, W. J., Hofmann, K.-H., Men’shchikov, A. B., & Schertl, D. 2004, A&A, 425, 77
- Whysong & Antonucci (2004) Whysong, D., & Antonucci, R. 2004, ApJ, 602, 116