also at ]Departement für Physik und Astronomie, Universität Basel.
Experimental (n,) cross sections of the p-process nuclei
74Se and 84Sr
Abstract
The nucleosynthesis of elements beyond iron is dominated by the s and r processes. However, a small amount of stable isotopes on the proton-rich side cannot be made by neutron capture and are thought to be produced by photodisintegration reactions on existing seed nuclei in the so-called ”p process”. So far most of the p-process reactions are not yet accessible by experimental techniques and have to be inferred from statistical Hauser-Feshbach model calculations. The parametrization of these models has to be constrained by measurements on stable proton-rich nuclei. A series of (n,) activation measurements, related by detailed balance to the respective photodisintegrations, were carried out at the Karlsruhe Van de Graaff accelerator using the 7Li(p,n)7Be source for simulating a Maxwellian neutron distribution of kT= 25 keV. First results for the experimental (n,) cross sections of the light p nuclei 74Se and 84Sr are reported. These experimental values were used for an extrapolation to the Maxwellian averaged cross section at 30 keV, 30, yielding 27115 mb for 74Se, and 30017 mb for the total capture cross section of 84Sr. The partial cross section to the isomer in 85Sr was found to be 19010 mb.
pacs:
25.40.Lw, 26.30.+k, 27.50.+e, 97.10.CvI Introduction
Astrophysical models can explain the origin of most nuclei beyond the iron group in a combination of processes involving neutron captures on long (s process) or short (r process) time scales Burbidge et al. (1957); Langanke and Wiescher (2001). However, 32 stable, proton-rich isotopes between 74Se and 196Hg cannot be formed in that way. Those p nuclei are 10 to 100 times less abundant than the s and r nuclei in the same mass region. They are thought to be produced in the so-called or p process, where proton-rich nuclei are made by sequences of photodisintegrations and decays Woosley and Howard (1978, 1990); Rayet et al. (1995). In this scenario, pre-existing seed nuclei from the s and r processes are destroyed by photodisintegration in a high-temperature environment, and proton-rich isotopes are produced by (,n) reactions. When (,p) and () reactions become comparable or faster than neutron emission within an isotopic chain, the reaction path branches out and feeds nuclei with lower charge number Z. The decrease in temperature at later stages of the p process leads to a freeze-out via neutron captures and mainly decays, resulting in the typical p-process abundance pattern with maxima at 92Mo (N=50) and 144Sm (N=82).
The currently most favored astrophysical site for the p process is explosive burning in type II supernovae. The explosive shock front heats the outer O/Ne shell of the progenitor star to temperatures of 2-3 GK, sufficient for providing the required photodisintegrations. Following the nucleosynthesis in such astrophysical models, good agreement with the required p production is found, with exception of the low (A100) and intermediate (150A 165) mass range, which are underproduced by factors of 3-4 Rauscher et al. (2002). Because of these persisting problems, alternative scenarios (such as type Ia supernovae and X-ray bursters) have been suggested, each with their own, inherent difficulties Howard et al. (1991); Schatz et al. (1998); Arnould and Goriely (2003). Currently, however, it is not yet clear whether the observed underproductions are due to a problem with astrophysical models or with the nuclear physics input, i.e. reaction rates. Thus, a necessary requirement towards a consistent understanding of the p process is the reduction of uncertainties in nuclear data. By far most of the several hundreds of required photodisintegration rates and their inverses need to be inferred from Hauser-Feshbach statistical model calculations Hauser and Feshbach (1952), e.g. the codes NON-SMOKER Rauscher et al. (1995); Rauscher and Thielemann (2000, 2001) and MOST Goriely (2002, 2005a). Experimental data can improve the situation in two ways, either by directly replacing predictions with measured cross sections in the relevant energy range, or by testing the reliability of predictions at other energies when the relevant energy range is not experimentally accessible.
The role of (n,) reactions in the p process was underestimated for a long time, although it is obvious that they have an influence on the final p-process abundances. Neutron captures compete with (,n) reactions and thus hinder the photodisintegration flux towards light nuclei, especially at lower-Z isotopes and even-even isotopes in the vicinity of branching-points. The influence of a variation of reaction rates on the final p abundances has been studied previously Rauscher (2005); Rapp (2004). It turned out that the p abundances are very sensitive to changes of the neutron-induced rates in the entire mass range, whereas the proton-induced and -induced reaction rates are important at low and high mass numbers, respectively.
Rayet et al. Rayet et al. (1990) have also studied the influence of several components in their p-process network calculations. Their nuclear flow schemes show that branching points occur even at light p nuclei, and are shifted deeper into the proton-rich unstable region with increasing mass and temperature. In contradiction to Woosley and Howard Woosley and Howard (1978), who claimed for their network calculations that (n,) can be neglected except for the lightest nuclei (A90), Rayet et al. also examined the influence of neutron reactions for temperatures between T9= 2.2 and 3.2 GK by comparing overabundance factors if (n,) reactions on Z26 nuclides are considered or completely suppressed. As a result, the overabundances were found to change by up to a factor 100 (for 84Sr) if the (n,) channel was artificially suppressed. This rather high sensitivity indicates the need for reliable (n,) rates to be used in p-process networks.
Although recent efforts are directed to calculation or measurement of photodisintegration cross sections and rates Mohr et al. (2000); Vogt et al. (2001); Utsunomiya et al. (2003a, b); Sonnabend et al. (2003, 2004); Rauscher and Thielemann (2004), astrophysical photodisintegration rates can easily be inferred from capture rates by detailed balance, even in theoretical work Rauscher and Thielemann (2000). The stellar reaction rate NA∗n,γ for the reaction a + n b + is related to its inverse rate by
| (1) |
with the Avogadro number NA, the nuclear spins J and masses A, the respective temperature-dependent partition functions G(T) and the reaction Q value in the exponent. Measuring or calculating a rate in the direction of positive Q value ensures best numerical accuracy and consistency between forward and backward reaction. This is important when implementing those rates in reaction networks for nucleosynthesis models.
Moreover, stellar cross sections and rates have to be employed for the computation of reverse rates. In a stellar environment, nuclei are fully thermalized with the environment, resulting in a thermal excitation of both the target and the final nucleus. Only stellar cross sections including the excitation in form of a stellar enhancement factor (SEF) can be used to properly account for all transitions when applying detailed balance. For reactions with positive Q values for captures, a laboratory measurement of the capture cross section will encompass by far more of the relevant transitions than a photodisintegration experiment, even with the target being in the ground state Vogt et al. (2001).
For the past decade there has been a continuing effort to measure nuclear data for the p process, both for charged particle reactions Fülöp et al. (1996); Sauter and Käppeler (1997); Somorjai et al. (1998a, b); Bork et al. (1998); Chloupek et al. (1999); Harissopulos et al. (2001); Gyürky et al. (2001); Özkan et al. (2002); Rapp et al. (2002); Galanopoulos et al. (2003); Gyürky et al. (2003); Harissopulos et al. (2003); Rapp (2004) and for neutron induced reactions Wisshak et al. (1996); Theis et al. (1998); Bao et al. (2000); Rapp et al. (2002); Rapp (2004). The present work comprises the first measurement of (n,) cross sections for the p-process isotopes 74Se and 84Sr at kT= 25 keV, with the aim to improve the p-process database and to help testing theoretical predictions. Since it is not possible to measure cross sections directly at p-process temperatures of kT= 170-260 keV, we have to perform the measurements at s-process (and freeze-out) temperatures of kT= 25 keV, and then extrapolate theoretically by means of the respective energy dependent cross sections (see Sec. V).
The measurement of stellar (n,) rates requires a ”stellar” neutron source yielding neutrons with a Maxwell-Boltzmann energy distribution. We achieve this by making use of the 7Li(p,n)7Be reaction. In combination with the activation or time-of-flight technique, this offers a unique tool for comprehensive studies of (n,) rates and cross sections for astrophysics.
In Sec. II, the experimental technique and sample characteristics are outlined, followed by the description of the data analysis in Sec. III. The results are presented in Sec. IV. A comparison to theory and extrapolation to higher energies is given in Sec. V. The paper is concluded with a summary and a short outlook in Sec. VI.
II Experimental technique
All measurements were carried out at the Karlsruhe 3.7 MV Van de Graaff accelerator using the activation technique. Neutrons were produced with the 7Li(p,n)7Be source by bombarding 30 m thick layers of metallic Li on a water-cooled Cu backing with protons of 1912 keV, 30 keV above the reaction threshold. The resulting quasi-stellar neutron spectrum approximates a Maxwellian distribution for kT= 25.0 0.5 keV Ratynski and Käppeler (1988). Hence, the proper stellar capture cross section can be directly deduced from our measurement.
For the activations natural samples of selenium metal (0.89% 74Se) and various strontium compounds (0.56% 84Sr) were used. In order to verify the stoichiometry, samples of Sr(OH)2 and SrF2 were dried at 300∘C and 800∘C, respectively. The powders were pressed to thin pellets, which were enclosed in a 15 m thick aluminium foil and sandwiched between 10-30 m thick gold foils of the same diameter. In this way the neutron flux can be determined relative to the well-known capture cross section of 197Au Ratynski and Käppeler (1988). The activation measurements were carried out with the Van de Graaff accelerator operated in DC mode with a current of 100 A. The mean neutron flux over the period of the activations was 1.5109 n/s at the position of the samples, which were placed in close geometry to the Li target. Throughout the irradiation the neutron flux was recorded in intervals of 1 min using a 6Li-glass detector for later correction of the number of nuclei, which decayed during the activation (factor fb in Eq. 4).
Over the course of the present measurements, a total of 17 activations (5 for Se and 12 for Sr) have been carried out with modified experimental parameters (see Table 1). Five short-time activations of 3 h to 5 h were used for determining the partial cross section of the 84Sr(n,)85Srm reaction feeding the isomer in 85Sr with a half-life of 67.6 m. The 84Sr(n,)85Srg cross section to the ground state was separately deduced from seven long-time activations.
| Sample | Mass | Atoms | ta | tot | |
|---|---|---|---|---|---|
| No. | [mm] | [mg] | 74Se or 84Sr | [h] | [neutrons] |
| Se | |||||
| se-1 | 6 | 151.8 | 1.031019 | 16 | 1.101014 |
| se-2 | 10 | 200.2 | 1.361019 | 7 | 1.531013 |
| se-3 | 6 | 102.2 | 6.941018 | 23 | 1.641014 |
| se-4 | 10 | 207.8 | 1.411019 | 24 | 0.991014 |
| se-5 | 10 | 147.8 | 1.001019 | 24 | 1.161014 |
| Sr(OH)2 | |||||
| sr-1 | 6 | 67.6 | 1.881018 | 23 | 1.451014 |
| sr-2 | 10 | 161.2 | 4.471018 | 25 | 8.031013 |
| sr-3111Heated at 300∘C for 4 h. | 6 | 119.8 | 3.321018 | 21 | 1.591014 |
| sr-4m | 6 | 147.5 | 4.091018 | 3 | 1.131013 |
| sr-5m | 10 | 195.3 | 5.421018 | 3 | 2.271013 |
| SrF2 | |||||
| sr-6 | 10 | 478.3 | 1.281019 | 24 | 1.161014 |
| sr-7222Heated at 800∘C for 1 h. | 10 | 195.7 | 5.251018 | 43 | 1.311014 |
| sr-8m | 8 | 204.5 | 5.491018 | 4 | 3.291013 |
| sr-9m | 10 | 314.4 | 8.441018 | 5 | 2.771013 |
| SrCO3 | |||||
| sr-10 | 8 | 91.2 | 2.081018 | 21 | 1.641014 |
| sr-11 | 10 | 152.1 | 3.471018 | 21 | 9.301013 |
| sr-12m | 8 | 222.6 | 5.091018 | 3 | 1.911013 |
| Reaction | Isot. abund. [%] | Final state | Half life | Eγ [keV] | Iγ [%] | Ref. |
| 74Se(n,)75Se | 0.89 0.04 | Ground state | 119.79 0.04 d | 136.0 | 58.3 0.7 | Farhan and Singh (1999) |
| 264.7 | 58.9 0.3 | |||||
| 84Sr(n,)85Sr | 0.56 0.01 | Ground state | 64.84 0.02 d | 514.0 | 95.7 4.0 | Sievers (1991) |
| Isomer | 67.63 0.04 m | 151.2 (EC) | 12.9 0.7 | |||
| 231.9 (IT) | 84.4 2.2 | |||||
| 197Au(n,)198Au | 100 | Ground state | 2.69517 0.00021 d | 411.8 | 95.58 0.12 | Chunmei (2002) |
III Data analysis
III.1 General procedure
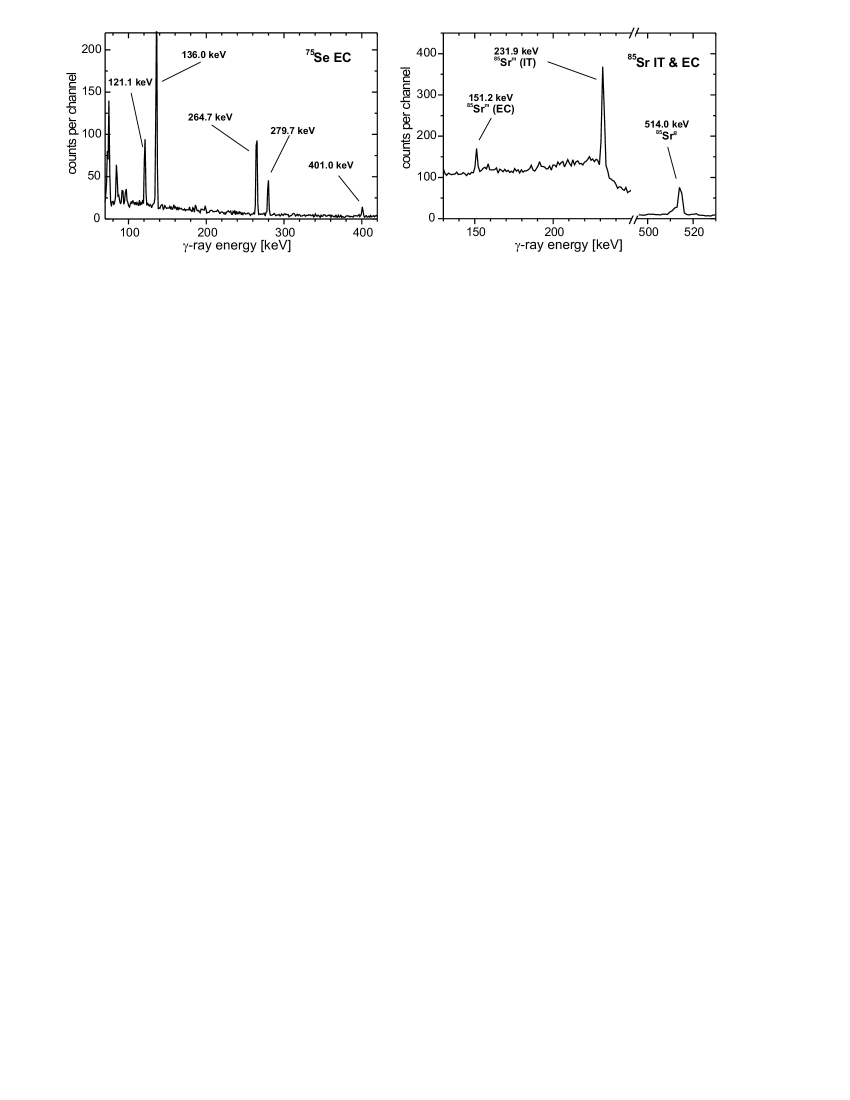
The induced -ray activities were counted after the irradiation in a well defined geometry of 76.00.5 mm distance using a shielded HPGe detector in a low background area. Energy and efficiency calibrations have been carried out with a set of reference -sources in the energy range between 60 keV and 2000 keV. Fig. 1 shows the -ray spectra of the induced activities in the 74Se and 84Sr samples.
The total amount of activated nuclei Z at the end of the irradiation can be deduced from the number of events C in a particular -ray line registered in the HPGe detector during the measuring time tm Beer and Käppeler (1980). The factor tw corresponds to the waiting time between irradiation and activity measurement.
| (2) |
The factors and Iγ account for the HPGe efficiency and the relative intensity per decay of the respective transition (Table 2). The factor kγ introduces the correction for -ray self-absorption in the sample Beer and Käppeler (1980). For disk shaped samples with a thickness d and -ray absorption coefficients Hubbell and Seltzer (2004), one obtains
| (3) |
The factor
| (4) |
accounts for the decay of activated nuclei during the irradiation time ta as well as for variations in the neutron flux. This factor can be calculated from the neutron flux history recorded throughout the irradiation with the 6Li glass detector in 91 cm distance from the target.
The number of activated nuclei Z can also be written as
| (5) |
where is the time-integrated neutron flux and Ni the number of atoms in the sample. As our measurements are carried out relative to 197Au as a standard, the neutron flux cancels out:
| (6) |
The reference value for the experimental 197Au cross section in the quasi-stellar spectrum of the 7Li(p,n)7Be source is 5868 mb Ratynski and Käppeler (1988). By averaging the induced activities of the gold foils, one can determine the neutron flux tot at the position of the sample and deduce the experimental cross section of the investigated sample as shown in Eq. 6.
III.2 Ground-state correction
In the case of the activation of 84Sr, where the neutron capture populates both, ground and isomeric state in 85Sr, the analyzing procedure is more complicated. While the partial cross section to the isomeric state can be easily calculated as described above, the partial cross section to the ground state has to be corrected for those nuclei, which decayed during activation and measuring time already by isomeric transition.
The amount of isomer and ground state nuclei after the activation time ta is described by Eq.7:
| (7) | |||
| (8) |
Y is the branching ratio of the isomeric transition (0.866 for 85Srm), and the factor gm is calculated with:
| (9) |
The relation between the activity of the ground state and the measured count rate Cg can be calculated by
| (10) |
Ag(t) is further described as
| (11) |
Inserting Ai=Zi , solving the integral and converting to Zg(ta) leads to
| (12) |
Thus, can finally be deduced from Eq. 8 by inserting Zg(ta):
| (13) |
The second term in Eq. 13 describes the isomeric transition, for which the ground-state cross section has to be corrected. For half-lives longer than the ground-state, this part introduces major corrections, whereas for very short half-lives this term becomes negligible.
IV Results and discussion
IV.1 General
In an astrophysical environment with temperature T, the neutron spectrum corresponds to a Maxwell-Boltzmann distribution
| (14) |
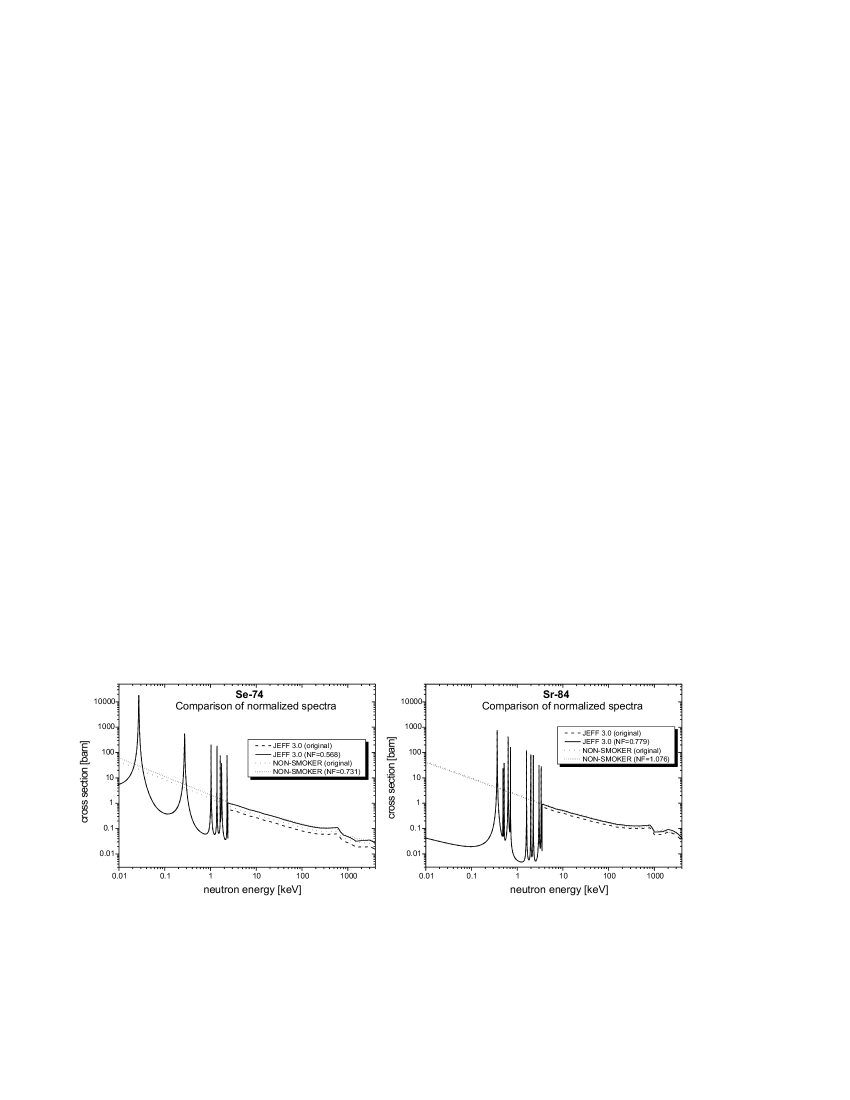
The experimental neutron spectrum of the 7Li(p,n)7Be reaction approximates a Maxwellian distribution with kT= 25 keV almost perfectly Ratynski and Käppeler (1988). But to obtain the exact Maxwellian averaged cross section = for the temperature T, the energy-dependent cross section (E) has to be folded with the experimental neutron distribution to derive a normalization factor NF=. The region beyond the resonances (2.4 keV for 74Se and 3.5 keV for 84Sr) was then multiplied with the normalization factor NF. The proper Maxwellian averaged cross section as a function of thermal energy kT was then derived from the normalized cross section (Fig. 2) in the energy range 0.01En4000 keV.
| (15) |
In this equation, is the normalized energy-dependent capture cross section and En the neutron energy. The factor = denotes the most probable velocity with the reduced mass m.
For astrophysical applications, laboratory cross sections have to be converted to stellar cross sections involving thermally excited targets by applying a correction factor, the so-called stellar enhancement factor (SEF) Rauscher and Thielemann (2000). While there are only comparatively few cases with low-lying nuclear states in the s process where the correction is important, it is to be expected that the SEF may be larger at the much higher p-process temperatures. However, this is not the case for the p nuclei considered here, as illustrated by Table 3.
| T [GK] | kT [keV] | SEF(74Se) | SEF(84Sr) |
|---|---|---|---|
| 0.3 | 26 | 1.00 | 1.00 |
| 2.0 | 172 | 1.01 | 1.02 |
| 2.5 | 215 | 1.02 | 1.06 |
| 3.0 | 260 | 1.03 | 1.09 |
For 74Se and 84Sr, energy-dependent neutron capture cross sections were available from JEFF 3.0 NEA (2004), ENDF-B VI.8 NNDC (2004), and NON-SMOKER Rauscher and Thielemann (2000, 2001); Rauscher (2001), whereas JENDL 3.3 Shibata et al. (2002) provides only data for 74Se. The energy region between 10 eV and 2.9 keV in JEFF, ENDF-B and JENDL includes experimentally evaluated data Sukhoruchkin et al. (1998) and differs only in the strength of the resonances. The trend beyond 2.9 keV is deduced from statistical model calculations and deviates from NON-SMOKER when the (n,p) channel opens at En600 keV (74Se) and En750 keV (84Sr), respectively. In the following sections we will use the energy dependencies of JEFF 3.0 to determine Maxwellian averaged cross sections and compare the results only with NON-SMOKER.
IV.2 Uncertainties
The experimental uncertainties are summarized in Table 4. Since nearly every stellar neutron cross section measurement was carried out relative to gold, the error of 1.4% Ratynski and Käppeler (1988) in the gold cross section cancels out.
Uncertainties between 1.4% (for samples with 10 mm diameter) and 2.9% (6 mm diameter) are due to an estimated sample position uncertainty of 0.25 mm relative to the Au foils during the activation, which affects neutron flux seen by the sample. For the Se samples, a fairly large contribution results from the 4.5% error of the isotopic abundance Rosman and Taylor (1998). In the case of the 84Sr(n,)85Srg+m capture cross sections, considerable contributions come from the uncertainties of the -ray intensities. The errors in the time factors fb, fw= and fm= are negligible in all measurements except those of the partial cross section to 85Srm (t1/2= 67.6 m) due to the rather long half-lives of the product nuclei in comparison with tw and tm. The error in the masses could be neglected for all samples except for the gold foils.
| Source of uncertainty | Uncertainty (%) | |||
|---|---|---|---|---|
| 197Au | 74Se | 84Srg | 84Srm | |
| Gold cross section | 1.4111Not included in the final uncertainty, see text. | - | - | - |
| Isotopic abundance | - | 4.5 | 1.8 | 1.8 |
| Detector efficiency | 1.5 | 1.5 | 1.5 | 1.5 |
| Divergence of n flux | - | 1.4 - 2.3 | 1.5 - 2.9 | 1.5 - 2.9 |
| Sample mass | 0.2 | - | - | - |
| -Ray intensity | 0.1 | 0.5/ 1.2222136 keV/ 265 keV. | 4.2333514 keV | 5.4/ 2.6444151 keV/ 232 keV. |
| -Ray self-absorption | - | 0.2 | 0.2 | 0.2 |
| Counting statistics | 1.0 | 0.4 - 1.6 | 3.6 - 5.3 | 0.4 - 2.0 |
| Time factors fb, fm, fw | - | - | - | 0.2 - 1.3 |
| Total uncertainty | 5.5 - 5.7555Incl. uncertainty from Au. | 6.5 - 7.9555Incl. uncertainty from Au. | 4.3 - 7.1555Incl. uncertainty from Au. | |
The conservatively assumed overall uncertainty for the Se measurements is 5.7%. The partial cross sections to the 85Sr ground and isomeric states have uncertainties of 7.1% and 5.3%, respectively, leading to a combined error of 5.6% in the total capture cross section. These uncertainties were also adopted for the Maxwellian averaged cross sections, assuming that the uncertainties of the theoretical energy dependence were negligible for the extrapolation to kT= 30 keV.
IV.3 74Se(n,)75Se
The 74Se(n,)75Se reaction was analyzed via the two strongest transitions in 75As at 136.0 keV and 264.7 keV. The results from the individual Se activations are listed in Table 5. The capture cross section derived with the experimental neutron distribution is 28116 mb and was calculated as the weighted mean value of all five activations.
| Activation | Cross section [mb] | |
|---|---|---|
| 74Se(n,)75Se | (136 keV) | (265 keV) |
| se-1 | 283 16 | 276 16 |
| se-2 | 270 15 | 259 14111Value not included in mean value. |
| se-3 | 273 16 | 265 15 |
| se-4 | 291 16 | 287 16 |
| se-5 | 300 17 | 284 16 |
| Mean cross section | 281 16 | |
IV.4 84Sr(n,)85Sr
In case of 84Sr, neutron captures populate both, ground and isomeric state of 85Sr. While 85Srg decays can be identified via the 514 keV transition in 85Rb, the decay of the isomer proceeds mainly via transitions of 232 keV and 151 keV. The isomeric state is 239 keV above the ground state and decays either via a 7 keV- 232 keV cascade (internal transition, 86.6%) or directly by electron capture (13.4%) into the 151 keV level of the daughter nucleus 85Rb.
The partial cross section to the isomeric state can be easily deduced from the above mentioned transitions at 151 keV and 232 keV and yields 18910 mb (see Table 6). The cross section to the ground state has to be corrected for the internal decay of the isomer during the activation and measuring time, and results in 1128 mb. This leads to a total capture cross section of 30118 mb.
The corresponding isomeric ratio is IR= 0.63 0.04, in perfect agreement with the value of 0.63 0.06 reported for thermal neutrons Mughabghab et al. (1981). A NON-SMOKER estimation showed that the isomeric ratio is almost independent of the energy kT in the relevant range.
| Activation | cross section [mb] | ||
|---|---|---|---|
| 84Sr(n,) | 85Srg | 85Srm | |
| (514 keV) | (151 keV) | (232 keV) | |
| sr-1 | 114 9 | ||
| sr-2 | 124 8 | ||
| sr-3 | 102 8 | ||
| sr-4m | 189 13 | 194 10 | |
| sr-5m | 194 13 | 194 8 | |
| sr-6 | 106 7 | 178 12 | 189 8 |
| sr-7 | 107 7 | ||
| sr-8m | 186 12 | 190 9 | |
| sr-9m | 187 12 | 191 8 | |
| sr-10 | 122 8 | 192 13 | 192 9 |
| sr-11 | 106 7 | ||
| sr-12m | 178 12 | 189 9 | |
| Mean cross section | 112 8 | 189 10 | |
V Comparison with theory
V.1 Maxwellian cross sections for kT= 25 keV
74Se(n,): Normalization of the energy dependent cross sections (En) from NON-SMOKER, JEFF 3.0, ENDF-B VI.8 and JENDL 3.3 with the experimental value of 281 mb yields normalization factors between 0.568 and 0.736 (see Table 7). Fig. 2 shows the normalized (E) spectra for JEFF and NON-SMOKER in comparison with the original spectra. The Maxwellian averaged cross section at kT= 25 keV deduced with the JEFF dependence is 25= 298 mb.
84Sr(n,): The normalization factors for 84Sr vary between 0.774 and 1.076 (Table 7). With the normalized spectra of JEFF (Fig. 2) the resulting total stellar capture cross section 25(total) is 326 mb. With our isomeric ratio of 0.63 we calculate for the partial cross section to the isomer 85Srm 25(part)= 205 mb.
| 74Se | 84Sr | |||
| cross section | NF | cross section | NF | |
| Experiment | 281 mb | 1.000 | 301 mb111Total capture cross section | 1.000 |
| JEFF 3.0 | 160 mb | 0.568 | 234 mb111Total capture cross section | 0.779 |
| ENDF-B VI.8 | 160 mb | 0.568 | 233 mb111Total capture cross section | 0.774 |
| JENDL 3.3 | 207 mb | 0.736 | - | - |
| NON-SMOKER | 206 mb | 0.731 | 324 mb111Total capture cross section | 1.076 |
V.2 Extrapolation to higher temperatures
Table 9 shows the Maxwellian averaged cross sections for different thermal energies deduced with JEFF. The respective reaction rates were calculated from kT via
| (16) |
with m being the reduced mass. The units for , the thermal energy kT and the reaction rate are [mb], [keV] and [mole-1 cm3 s-1], respectively. By convention, stellar neutron capture rates for s-process studies are compared at kT= 30 keV, which corresponds also to the freeze-out temperature of 3.5108 K. For p-process applications, the cross sections should be extrapolated to the energy range, which is relevant for the p process, i.e. 170 keV kT 260 keV, corresponding to temperatures of (2 to 3)109 K.
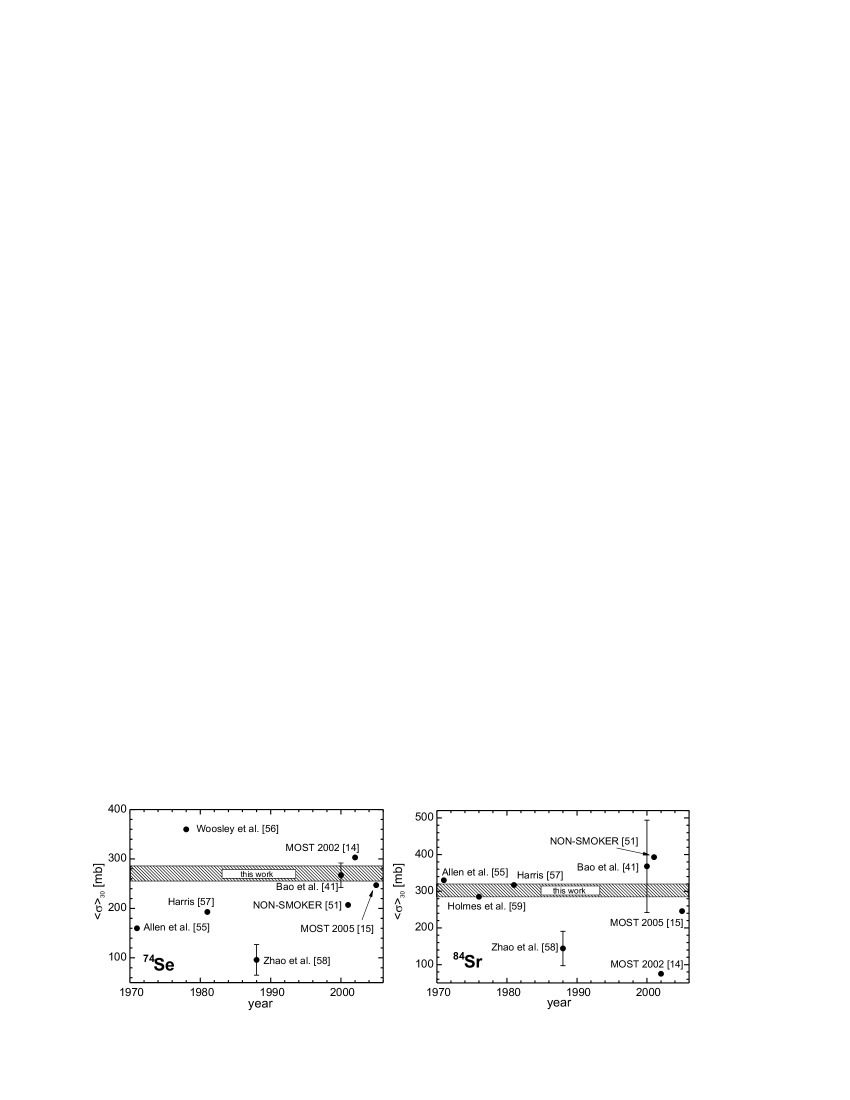
For 74Se a Maxwellian averaged cross section of 30= 271 mb is derived, in perfect agreement with the previously estimated value of 26725 mb from Ref. Bao et al. (2000). The result for 84Sr is 30(tot)= 300 mb, 18% lower than the 368125 mb from Ref. Bao et al. (2000). The partial cross section to the isomer yields 30(part)= 190 mb.
Fig. 3 shows theoretical predictions for the 30 values of 74Se Allen et al. (1971); Woosley et al. (1978); Harris (1981); Zhao et al. (1988); Bao et al. (2000); Rauscher and Thielemann (2001); Goriely (2002, 2005a) and 84Sr Allen et al. (1971); Holmes et al. (1976); Harris (1981); Zhao et al. (1988); Bao et al. (2000); Rauscher and Thielemann (2001); Goriely (2002, 2005a) in comparison with our experimental value. In the case of 74Se agreement is only found with the old and new MOST predictions Goriely (2002, 2005a) and with the normalized NON-SMOKER cross sections in Bao et al. (2000), which account for known systematic deficiencies in the nuclear inputs of the calculation. For 84Sr, older predictions from Refs. Allen et al. (1971); Holmes et al. (1976); Harris (1981) are in rather good agreement. Not shown in this plot is a corrected prediction from the old MOST code of 2002 Goriely (2005b) of 296 mb, which was also in good agreement with our experimental Maxwellian cross section at kT=30 keV. Table 8 gives a comparison between the two Hauser-Feshbach models MOST (with the versions of 2002 Goriely (2002) and 2005 Goriely (2005a)) and NON-SMOKER, and the previous recommended (semi-empirical) value from Ref. Bao et al. (2000). A full list of all 32 p nuclei can be found in Dillmann et al. (2005).
| 74Se | Source | 30 [mb] | Reference |
|---|---|---|---|
| NON-SMOKER | 207 | Rauscher and Thielemann (2001) | |
| MOST 2002 | 304 | Goriely (2002) | |
| MOST 2005 | 247 | Goriely (2005a) | |
| Bao et al. | 267 25 | Bao et al. (2000) | |
| This work | 271 15 | ||
| 84Sr | Source | 30 [mb]111 Total capture cross section. | Reference |
| NON-SMOKER | 393 | Rauscher and Thielemann (2001) | |
| MOST 2002 | 74222 Original value. Corrected value Goriely (2005b) is 296 mb for 84Sr. | Goriely (2002) | |
| MOST 2005 | 246 | Goriely (2005a) | |
| Bao et al. | 368 125 | Bao et al. (2000) | |
| This work | 300 17 |
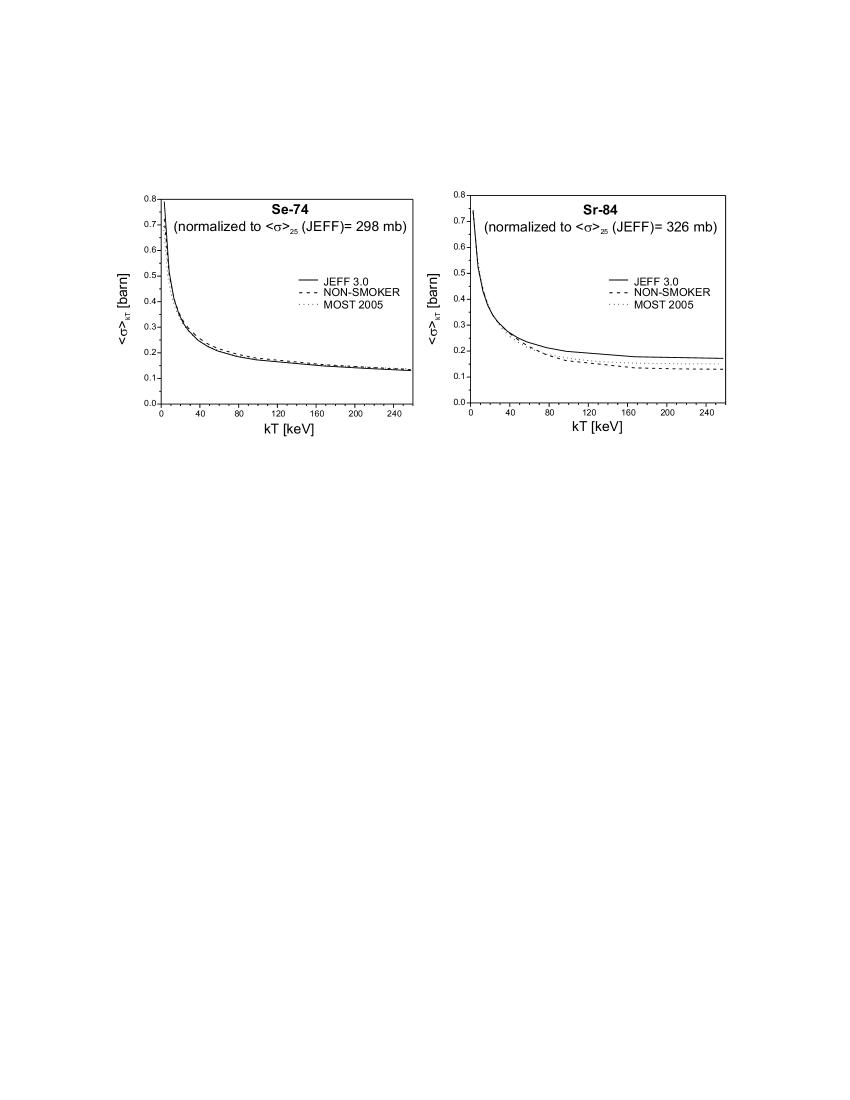
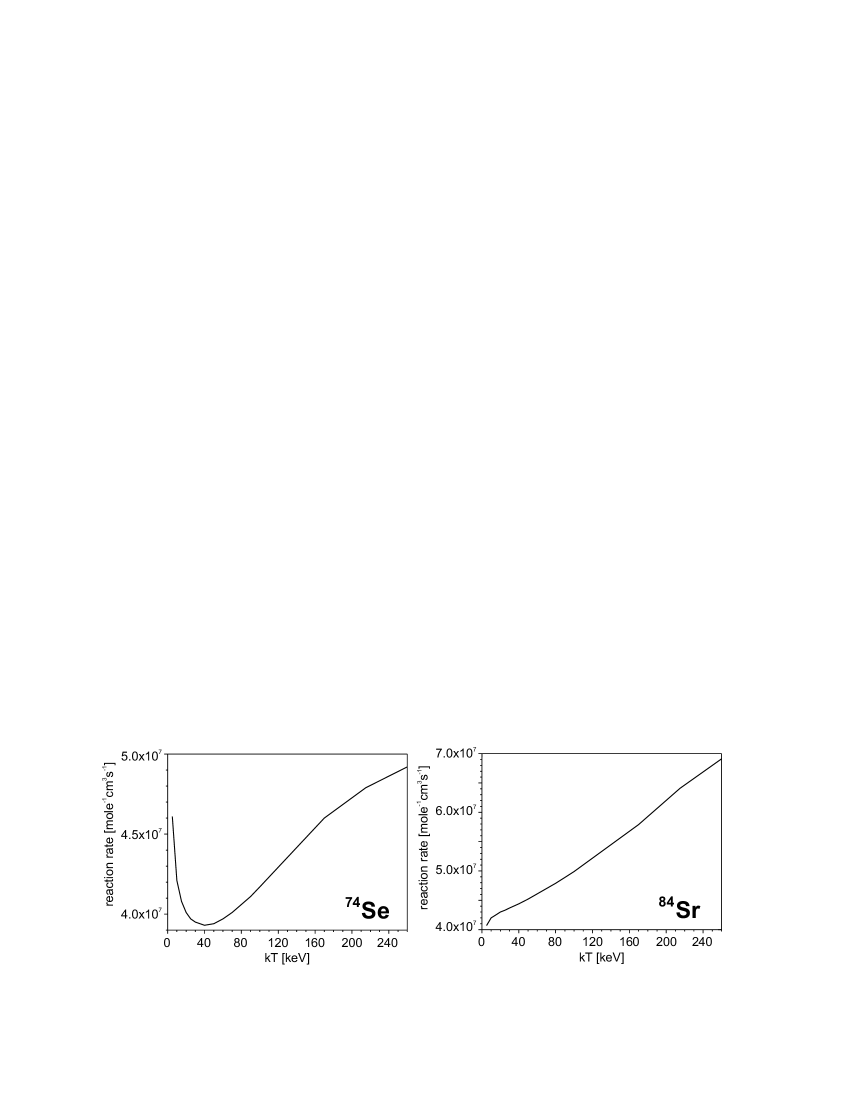
Further extrapolation to temperatures between kT= 5 keV and 260 keV (Fig. 4) shows the different energy dependence of the data based on the NON-SMOKER, JEFF and MOST predictions. For this plot, the curves of NON-SMOKER and MOST were normalized to the JEFF values at kT= 25 keV. In the case of 74Se the data libraries deviate at low and agree at higher energies, whereas 84Sr exhibits an opposite trend. The results for the Maxwellian averaged cross sections at p-process temperatures are 260= 115 mb for 74Se and 161 mb for 84Sr, corresponding to stellar reaction rates of 4.92107 and 6.91107 mole-1 cms-1, respectively. The temperature trends of the reaction rates are shown in Fig. 5.
| 74Se | 84Sr | |||||
|---|---|---|---|---|---|---|
| kT | kT | NA | kT111Total capture cross section | NA | ||
| keV | [mb] | [mole-1cm3s-1] | [mb] | [mole-1cm3s-1] | ||
| 5 | 775 | 4.61107 | 683 | 4.07107 | ||
| 10 | 500 | 4.21107 | 499 | 4.20107 | ||
| 15 | 395 | 4.08107 | 413 | 4.25107 | ||
| 20 | 337 | 4.01107 | 361 | 4.30107 | ||
| 25 | 298 | 3.97107 | 326 | 4.33107 | ||
| 30 | 271 | 3.95107 | 300 | 4.37107 | ||
| 40 | 233 | 3.93107 | 264 | 4.44107 | ||
| 50 | 209 | 3.94107 | 240 | 4.52107 | ||
| 60 | 192 | 3.97107 | 224 | 4.61107 | ||
| 80 | 170 | 4.06107 | 201 | 4.79107 | ||
| 100 | 157 | 4.17107 | 187 | 4.99107 | ||
| 170 | 133 | 4.60107 | 167 | 5.79107 | ||
| 215 | 123 | 4.79107 | 164 | 6.41107 | ||
| 260 | 115 | 4.92107 | 161 | 6.91107 | ||
VI Summary and Outlook
We have presented the first results of an ongoing experimental program to determine more precise p-process reaction rates in the mass range A=70-140. The stellar (n,) cross sections of the p nuclei 74Se and 84Sr have been measured for the first time, yielding values of 281 mb for 74Se, and 112 mb for the ground and 189 mb for the isomeric state to 85Sr with our experimental neutron spectrum. The respective Maxwellian averaged cross sections for kT= 30 keV were derived with the energy dependence of JEFF 3.0 and result in 30= 27115 mb for 74Se, and 30(total)= 300 17 mb for 84Sr. The isomeric ratio IR was found to be 0.63 0.04 and thus yields a partial stellar cross section of 30(part.)= 19010 mb.
Over the past decade, a lot of work has been devoted to measure cross sections and reaction rates of p nuclei, but experimental (p,), (,) and photodisintegration rates are still very scarce. The situation for stellar (n,) cross sections is somewhat better, but it should be pointed out that nearly all of the (n,) measurements were performed in energy regions relevant for the s process (kT= 30 keV instead of 100kT260 keV for the p process), whereas the charged particle rates are measured close to the respective p-process Gamow window.
The measurements presented in this paper mark the beginning of an extensive experimental program to determine more precise neutron cross sections of stable p nuclei. Within this program, we have already finished the measurement on 96Ru Rapp et al. (2002), and preliminary values are available for 102Pd, 120Te, 130Ba, 132Ba and 174Hf Dillmann et al. (2005). All available experimental information will be summarized in an upcoming paper, including an extrapolation to the full range of p-process temperatures and the calculation of inverse reaction rates by detailed balance.
Acknowledgements.
We thank E. P. Knaetsch, D. Roller and W. Seith for their help and support during the irradiations at the Van de Graaff accelerator. This work was supported by the Swiss National Science Foundation Grants 2024-067428.01 and 2000-105328.References
- Burbidge et al. (1957) E. Burbidge, G. Burbidge, W. Fowler, and F. Hoyle, Rev. Mod. Phys. 29, 547 (1957).
- Langanke and Wiescher (2001) K. Langanke and M. Wiescher, Rep. Prog. Phys. 64, 1657 (2001).
- Woosley and Howard (1978) S. Woosley and W. Howard, Ap. J. Suppl. 36, 285 (1978).
- Woosley and Howard (1990) S. Woosley and W. Howard, Ap. J. 354, L21 (1990).
- Rayet et al. (1995) M. Rayet, M. Arnould, M. Hashimoto, N. Prantzos, and K. Nomoto, Astron. Astrophys. 298, 517 (1995).
- Rauscher et al. (2002) T. Rauscher, A. Heger, R. Hoffman, and S. Woosley, Ap. J. 576, 323 (2002).
- Howard et al. (1991) W. Howard, B. Meyer, and S. Woosley, Ap. J. 373, L5 (1991).
- Schatz et al. (1998) H. Schatz, A. Aprahamian, J. Görres, M. Wiescher, T. Rauscher, J. Rembges, F.-K. Thielemann, B. Pfeiffer, P. Möller, H. Herndl, et al., Phys. Rep. 294, 167 (1998).
- Arnould and Goriely (2003) M. Arnould and S. Goriely, Phys. Rep. 384, 1 (2003).
- Hauser and Feshbach (1952) W. Hauser and H. Feshbach, Phys. Rev. 87, 366 (1952).
- Rauscher et al. (1995) T. Rauscher, F.-K. Thielemann, and H. Oberhummer, Ap. J. 451, L37 (1995).
- Rauscher and Thielemann (2000) T. Rauscher and F.-K. Thielemann, ADNDT 75, 1 (2000).
- Rauscher and Thielemann (2001) T. Rauscher and F.-K. Thielemann, ADNDT 79, 47 (2001).
- Goriely (2002) S. Goriely, Hauser-Feshbach rates for neutron capture reactions (version 09/12/02), http://www-astro.ulb.ac.be/Html/hfr.html (2002).
- Goriely (2005a) S. Goriely, Hauser-Feshbach rates for neutron capture reactions (version 08/26/05), http://www-astro.ulb.ac.be/Html/hfr.html (2005a).
- Rauscher (2005) T. Rauscher, Nucl. Phys. A 758, 549c (2005).
- Rapp (2004) W. Rapp, Report FZKA 6956, Forschungszentrum Karlsruhe (2004).
- Rayet et al. (1990) M. Rayet, N. Prantzos, and M. Arnould, Astron. Astrophys. 227, 271 (1990).
- Mohr et al. (2000) P. Mohr, K. Vogt, M. Babilon, J. Enders, T. Hartmann, C. Hutter, T. Rauscher, S. Volz, and A. Zilges, Phys. Lett. B 488, 127 (2000).
- Vogt et al. (2001) K. Vogt, P. Mohr, M. Babilon, J. Enders, T. Hartmann, C. Hutter, T. Rauscher, S. Volz, and A. Zilges, Phys. Rev. C 63, 055802 (2001).
- Utsunomiya et al. (2003a) H. Utsunomiya, H. Akimune, S. Goko, T. Hayakawa, Y.-W. Lui, H. Ohgaki, M. Ohta, T. Shizuma, H. Toyokawa, and T. Yamagata, Nucl. Phys. A 718, 199c (2003a).
- Utsunomiya et al. (2003b) H. Utsunomiya, H. Akimune, S. Goko, M. Ohta, H. Ueda, T. Yamagata, K. Yamasaki, H. Ohgaki, H. Toyokawa, Y.-W. Lui, et al., Phys. Rev. C 67, 015807 (2003b).
- Sonnabend et al. (2003) K. Sonnabend, P. Mohr, K. Vogt, A. Zilges, A. Mengoni, T. Rauscher, H. Beer, F. Käppeler, and R. Gallino, Ap. J. 583, 506 (2003).
- Sonnabend et al. (2004) K. Sonnabend, K. Vogt, D. Galaviz, S. Müller, and A. Zilges, Phys. Rev. C 70, 035802 (2004).
- Rauscher and Thielemann (2004) T. Rauscher and F.-K. Thielemann, ADNDT 88, 1 (2004).
- Fülöp et al. (1996) Z. Fülöp, A. Kiss, E. Somorjai, C. Rolfs, H.-P. Trautvetter, T. Rauscher, and H. Oberhummer, Z. Phys. A 355, 203 (1996).
- Sauter and Käppeler (1997) T. Sauter and F. Käppeler, Phys. Rev. C 55, 3127 (1997).
- Somorjai et al. (1998a) E. Somorjai, Z. Fülöp, A. Kiss, C. Rolfs, H.-P. Trautvetter, U. Greife, M. Junker, M. Arnould, M. Rayet, S. Goriely, et al., Astron. Astrophys. 333, 1112 (1998a).
- Somorjai et al. (1998b) E. Somorjai, Z. Fülöp, A. Kiss, C. Rolfs, H.-P. Trautvetter, U. Greife, M. Junker, M. Arnould, M. Rayet, S. Goriely, et al., Proc. Nuclei in the Cosmos V, edts. N. Prantzos and S. Harissopulos, Editions Frontires p. 459 (1998b).
- Bork et al. (1998) J. Bork, H. Schatz, F. Käppeler, and T. Rauscher, Phys. Rev. C 58, 524 (1998).
- Chloupek et al. (1999) F. Chloupek, A. Murphy, R. Boyd, A. Cole, J. Görres, R. Guray, G. Raimann, J. Zach, T. Rauscher, J. Schwarzenberg, et al., Nucl. Phys. A 652, 391 (1999).
- Harissopulos et al. (2001) S. Harissopulos, E. Skreti, P. Tsagari, G. Souliotis, P. Demetriou, T. Paradellis, J. Hammer, R. Kunz, C. Angulo, S. Goriely, et al., Phys. Rev. C 64, 055804 (2001).
- Gyürky et al. (2001) G. Gyürky, E. Somorjai, Z. Fülöp, S. Harissopulos, P. Demetriou, and T. Rauscher, Phys. Rev. C 64, 065803 (2001).
- Özkan et al. (2002) N. Özkan, A. Murphy, R. Boyd, A. Cole, M. Famiano, M. Howard, L. Sahin, J. Zach, R. de Haan, J. Görres, et al., Nucl. Phys. A 710, 469 (2002).
- Rapp et al. (2002) W. Rapp, M. Heil, D. Hentschel, F. Käppeler, R. Reifarth, H.J. Brede, H. Klein, and T. Rauscher, Phys. Rev. C 66, 015803 (2002).
- Galanopoulos et al. (2003) S. Galanopoulos, P. Demetriou, M. Kokkoris, S. Harissopulos, R. Kunz, M. Fey, J. Hammer, G. Gyürky, E. Somorjai, Z. Fülöp, et al., Phys. Rev. C 67, 015801 (2003).
- Gyürky et al. (2003) G. Gyürky, Z. Fülöp, E. Somorjai, M. Kokkoris, S. Galanopoulos, P. Demetriou, S. Harissopulos, T. Rauscher, and S. Goriely, Phys. Rev. C 68, 055803 (2003).
- Harissopulos et al. (2003) S. Harissopulos, S. Galanopulos, P. Demetriou, A. Syrou, G. Kriembardis, M. Kokkoris, A. Karydas, C. Zarkardas, R. Kunz, R., et al., Nucl. Phys. A 719, 115c (2003).
- Wisshak et al. (1996) K. Wisshak, F. Voss, C. Theis, F. Käppeler, K. Guber, L. Kazakov, N. Kornilov, and G. Reffo, Phys. Rev. C 54, 1451 (1996).
- Theis et al. (1998) C. Theis, F. Käppeler, K. Wisshak, and F. Voss, Ap. J. 500, 1039 (1998).
- Bao et al. (2000) Z. Bao, H. Beer, F. Käppeler, F. Voss, K. Wisshak, and T. Rauscher, ADNDT 76, 70 (2000).
- Ratynski and Käppeler (1988) W. Ratynski and F. Käppeler, Phys. Rev. C 37, 595 (1988).
- Rosman and Taylor (1998) K. Rosman and P. Taylor, Pure and Appl. Chem. 70, 217 (1998).
- Farhan and Singh (1999) A. Farhan and B. Singh, Nucl. Data Sheets 86, 785 (1999).
- Sievers (1991) H. Sievers, Nucl. Data Sheets 62, 271 (1991).
- Chunmei (2002) Z. Chunmei, Nucl. Data Sheets 95, 59 (2002).
- Beer and Käppeler (1980) H. Beer and F. Käppeler, Phys. Rev. C 21, 534 (1980).
- Hubbell and Seltzer (2004) J. Hubbell and S. Seltzer, Table of X-Ray Mass Attenuation Coefficients and Mass Energy-Absorption Coefficients (v. 1.4), National Institute of Standards and Technology, Gaithersburg, MD ; http://physics.nist.gov/PhysRefData/XrayMassCoef/ (2004).
- NEA (2004) NEA, Joint Evaluated Fission and Fusion General Purpose File: JEFF 3.0; Online: www.nea.fr/html/dbdata/eva/evaret.cgi (2004).
- NNDC (2004) NNDC, National Nuclear Data Center, Brookhaven NH: ENDF/B-VI Release 8; Online: www.nndc.bnl.gov/exfor1/endf00.htm (2004).
- Rauscher (2001) T. Rauscher, HTML Interface NON-SMOKER; Online: http://nucastro.org/nosmo.html (2001).
- Shibata et al. (2002) K. Shibata, T. Kawano, and T. Nakagawa, Japanese Evaluated Nuclear Data Library Version 3 Revision 3: JENDL 3.3, J. Nucl. Sci. Technol. 39, 1125 (2002).
- Sukhoruchkin et al. (1998) S. Sukhoruchkin, Z. Soroko, and V. Deriglazov, Landolt-Börnstein, Group I: Elementary Particles, Nuclei and Atoms, Vol. 16; Low Energy Neutron Physics - Subvolume B; edited by H. Schopper (1998).
- Mughabghab et al. (1981) S. Mughabghab, M. Divadeenam, and N. Holden, Neutron Cross Sections, BNL-325, 1st ed., 1 (1981).
- Allen et al. (1971) B. Allen, J. Gibbons, and R. Macklin, Adv. Nucl. Phys. 4, 205 (1971).
- Woosley et al. (1978) S. Woosley, W. Fowler, J. Holmes, and B. Zimmerman, ADNDT 22, 371 (1978).
- Harris (1981) M. Harris, Astrophys. Space Sci. 77, 357 (1981).
- Zhao et al. (1988) Z. Zhao, D. Zhou, and D. Cai, Nuclear Data for Science and Technology, edts. S. Igarasi (Saikon, Tokyo) p. 513 (1988).
- Holmes et al. (1976) J. Holmes, S. Woosley, W. Fowler, and B. Zimmerman, ADNDT 18, 305 (1976).
- Goriely (2005b) S. Goriely, private comm. (2005b).
- Dillmann et al. (2005) I. Dillmann, M. Heil, F. Käppeler, R. Plag, T. Rauscher, and F.-K. Thielemann, Proceedings of the 12th Int. Conference on Capture Gamma-Ray Spectroscopy and Related Topcis, Notre Dame/USA, Sept. 4-9, 2005, to be published by AIP (2005).