Precision measurements of positronium decay rate and energy level
Abstract
Positronium is an ideal system for the research of the bound state QED. New precise measurement of orthopositronium decay rate has been performed with an accuracy of 150 ppm, and the result combined with the last three is 7.04010.0007. It is the first result to validate the 2nd order correction. The Hyper Fine Splitting of positronium is sensitive to the higher order corrections of the QED prediction and also to the new physics beyond Standard Model via the quantum oscillation into virtual photon. The discrepancy of 3.5 is found recently between the measured values and the QED prediction (). It might be due to the contribution of the new physics or the systematic problems in the previous measurements: (non-thermalized Ps and non-uniformity of the magnetic field). We propose new methods to measure HFS precisely without the these uncertainties.
Keywords:
Positronium, QED, decay rate, HFS:
PACS numbers1 Introduction
Positronium (Ps), the bound state of an electron and a positron, is a purely leptonic system and the triplet () state of Ps, orthopositronium(o-Ps), decays slowly into three photons. It is good sample to measure decay rate directly and precisely. The o-Ps has an energy higher than the single state () of Ps, parapositronium(p-Ps). The difference of the energy level is called as Hyper Fine Splitting (HFS) and is significantly larger(about 203 GHz) than the hydrogen-atom (1.4 GHz). Since o-Ps has the same quantum number of photon, the quantum oscillation o-Ps o-Ps contributes the HFS (87 GHz), and the oscillation has the good sensitivity to the new physics beyond Standard Model.
Precise measurements of the decay rate of o-Ps and the HFS give us direct information about quantum electrodynamics(QED) in bound state. The higher order calculations in the bound state have be developed recently, and the we have a good chance to compare the experimental results with the QED predictions directly.
There are two topics in this note. We report the first test of the 2nd order calculation of the orthopositronium decay rate in the first part. We perform the accurate measurement (error 150ppm) of the o-Ps decay rate, and the 2nd order calculation is directly validated for the first time. In the second part, we propose the new methods to measure the HFS. There is discrepancy(3.5) between the prediction() and the precise measured values. We point out the possible two systematic errors in the previous measurements and propose the new methods without these systematic uncertainties.
2 orthopositronium decay rate
2.1 History and current status
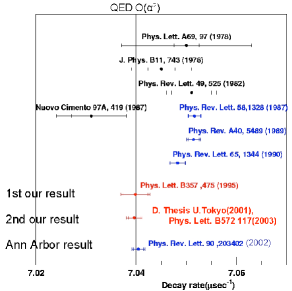
Three precise measurementsGAS87 ; GAS89 ; CAV90 of the o-PS decay rate were performed, in which reported decay rate values much larger, i.e., 5.2 – 9.1 experimental standard deviations, than a QED predictionADKINS-4 () corrected up to . This discrepancy has been referred as ‘orthopositronium lifetime puzzle’, and was long-standing problem.
As some fraction of o-Ps inevitably results in ‘pick-off’ annihilation due to collisions with atomic electrons of the target material, the observed o-Ps decay rate is a sum of the intrinsic o-Ps decay rate and the pick-off annihilation rate into ’s, , i.e.,
| (1) |
In the old measurementsGAS87 ; GAS89 ; CAV90 , ’s were measured by varying the densities of the target materials, size of the cavities and also the entrance aperture of the cavities. The extrapolation to zero density or aperture was expected to yield the decay rate in a vacuum, , under the assumption of the constant o-Ps velocity. We pointed outPEKIN ; ASAI95 that this assumption was the common/serious systematic uncertainties in these results, since it takes much time that Ps is well thermalized.
We have proposed the following entirely new methodASAI95 , which is free from above-mentioned systematic error. The energy distribution of photons emitted from the 3-body decay is continuous below the steep edge at 511 keV, whereas the pick-off annihilation is 2-body which produces a 511 keV monochromatic peak. Energy and timing information are simultaneously measured with high-energy resolution germanium detectors such that can be determined from the energy spectrum of the emitted photon. Once a precise thermalization function is obtained, will contain all information about the process. The population of o-Ps at time , can be expressed as
| (2) |
Providing the ratio is determined as a function of time, the intrinsic decay rate of o-Ps, , can be directly obtained by fitting the observed time spectrum.
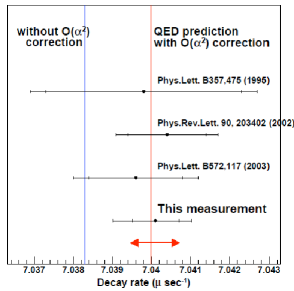
We obtained decay rate of ASAI95 , are consistent with the first order QED calculation, and quite differ from the previous results as shown in Fig. 1. This result are confirmed by two different and more accurate (200ppm) measurementsJIN ; MPOL and the ’lifetime puzzle’ has been solved. Now the interesting is focused on the validation of the higher order correction itself.
Non relativistic QED approximation has been developed recently, and it is useful to calculate higher oder correction of the bound state. The second order correctionADKINS-4 , whose contribution is about 160ppm, has been performed in 2002, and the more accurate measurement is necessary to examine the 2nd order correction.
2.2 Experimental setup
Figure 2 shows a diagram of the experimental setupkataD ; A positron source (dia., ) with the strength of , being sandwiched between two sheets of plastic scintillators(NE102 thickness=200m) and held by a cone made of aluminized mylar. The cone was situated at the center of a cylindrical vacuum container made of -thick plastic scintillators and glass, being filled with aerogel (RUN-I) or powder (RUN-II), and evacuated down to Torr. Density of the aerogel and powder is 0.03g/cc both, and the surface of the primary grain are replaced into hydrophobic in oder to remove the electric dipole of the OH-. The sizes of the primary grain are 10 and 16 nm for the aerogel and powder, respectively. Thus the mean free path of the collision between positronium and are different, and it makes difference in the thermalization process and the pickoff probability.
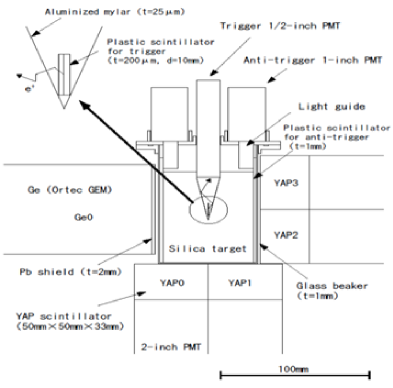
The emitted positrons pass through thin scintillator, transmitting a light pulse to a photomultiplier(Trigger PMT) and forming Ps when stopped in the silica powder or aerogel. Since the kinetic energy of the positron is high (=1.9MeV: ) about 40% of the positron pass through the silica and annihilate at the vacuum container. If the positron deposits energy(¿100 keV) in the -thick plastic scintillators, inside wall of the vacuum container, the produced trigger signal is vetoed to remove these annihilate events in the wall.
Three high-purity coaxial germanium detectors (Ortec GEM38195) precisely measured the thermalization process. Energy resolutions were measured using several line sources, with typical resultant values of 0.5 keV at 514 keV. Four YAP(: Ce doped: size is 505033 mm) scintillators simultaneously measured the time and energy information from each decay. The good time resolution of (1 nsec) is obtained for 150 keV. Since the decay constant of the YAP is fast(30 nsec) and the slow components of the scintillation is negligible smallkataD , the event pileup probability is small and the time walk correction can be performed perfectly as function of the deposited energy.
2.3 Analysis
The ratio is determined using the energy spectrum measured by the Ge detectors. The energy spectrum of the o-Ps decay sample, referred to as the o-Ps spectrum, is obtained by subtracting accidental contributions from the measured spectrum. The -decay continuum spectrum is estimated using Monte Carlo simulation in which the geometry and various material distributions are reproduced in detailkataD . For every simulated event, three photons are generated according to an order--corrected energy spectrum. Successive photoelectric, Compton, or Rayleigh scattering interactions of every photon are then followed through the materials until all photon energy is either deposited or escapes from the detectors. The response function of the detectors is determined based on the measured spectrum of monochromatic -rays emitted from , , and , with this function being used in the simulationkataD . These material and detector effects are taken into account precisely, and the -spectrum is obtained. These are continuous distributions, and is normalized to the observed o-Ps spectrum with the ratio of event numbers within the region (480-505 keV).
Figure 3(a) shows the o-Ps spectrum and spectrum observed in RUN-II (powder). The pick-off 2 spectrum, which is obtained from the o-Ps spectrum after subtracting the -spectrum, is also superimposed in the same figure. The can be calculated directly from the ratio of the pick-off 2 and 3 spectrum, the ratio does not depend on the absolute values of the detection efficiencies. The calculations of the are performed for the various time windows, and its time dependence is shown in Fig.3(b). Horizontal axis of the figure is the time between the positrons emission and decay, this slop show the thermalization process of the positronium. It takes much time than the lifetime to well thermalized, as we have already shown in the previous measurementsASAI95 ; JIN .
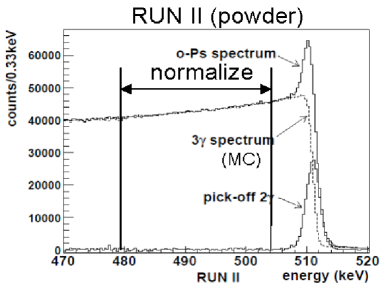
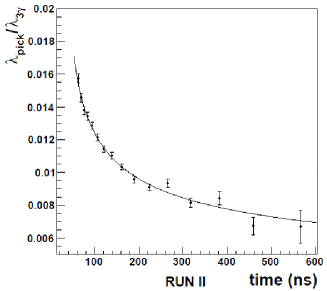
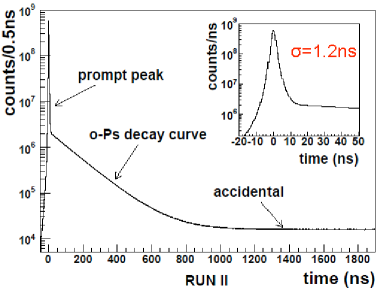
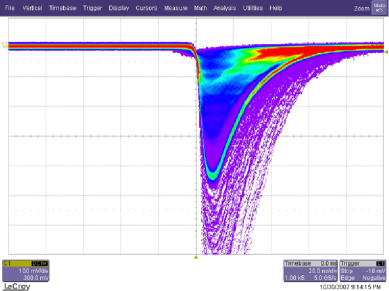
Figure 4 shows the time spectrum of the YAP scintillators with an energy window above 150 keV, in which a sharp peak of the prompt annihilation is followed by the exponential decay curve of o-Ps and then the constant accidental spectrum. Time resolution is 1.2 nsec is obtained and the o-Ps curve is widely observed over . We fit resultant time spectrum using the least square method, i.e.,
| (3) |
where and are the detection efficiencies for pick-off annihilation and decays, and is an experimental random counting rate representing the fact that time interval measurement always accept the first as a stop signal. is about due to the low-density of the powder or aerogel, i.e., the ratio of error propagation to decay rate is suppressed by a factor of 100.
The obtained decay rateskataD are for RUN-I and for RUN-II, which are consistent with each other.
Estimates of various systematic errors are summarized in Table 1 and the details are shown in referencekataD . We just mention here about errors related to simulation and physics source(Stark effect and 3 annihilation in the pick-off collision).
| Source | RUN-I(ppm) | RUN-II(ppm) |
|---|---|---|
| TDC non linearity | 15 | 15 |
| Pile up | 10 | 10 |
| Pickoff estimation | ||
| (1) 3 subtraction | 89 | 91 |
| (2) Ge efficiency | 33 | 28 |
| (3) YAP efficiency | 64 | 19 |
| Physics source | ||
| (1) Zeeman effect | 5 | 5 |
| (2) Stark effect | 3 | 4 |
| (3) 3 annihilation | 91 | 33 |
| Total | -147 and + 115 | -104 and +98 |
The predominant contribution to total systematic error is produced by uncertain normalization of the 3 spectrum. That is, the number of pick-off events are determined by subtracting the normalized 3- spectrum of Monte Carlo simulation from the o-Ps spectrum, where changing the normalization factor affects the values and eventually propagates to the final result. Since the sharp fall-off of the 3-spectrum at 511 keV is solely produced by the good Ge energy resolution of keV, this subtraction only affects the lower side of the pick-off spectrum such that improper subtraction results in asymmetry of the pick-off spectrum shape. Comparison of the asymmetries of the pick-off peak shape and the prompt peak annihilation spectrum is a good parameter for estimating this systematic error. The errors are about 90 ppm for both measurements.
The Stark shift stretches the lifetime of Ps atoms, i.e., a probative calculation shows that the shift is proportional to a square of the effective electric field such that , where . Silanol functional groups on the surface of the grain behave as an electrical dipole moment creating an effective field around the grains. Average densities of Silanol are measured to be and the effective field can be analytically calculated such that the contribution to the o-Ps decay rate is determined to be . These estimations were confirmed using results from precise hyper-fine-structure (HFS) interval measurements of ground state Ps in silica powderHFS , where the interval is proportional to the size of Stark effect. Considering the difference in powder densities used, the HFS results are consistent with our estimation.
Other sources of systematic errors: Error contribution due to the Zeeman effect is estimated using the measured absolute magnetic field around the positronium assembly (). Since the 3- pick-off process can only occur at a certain ratio, the calculated relative frequency is consistent with previous measurements3-pick , being for RUN-I and for RUN-II.
The above discussed systematic errors are regarded as independent contributions such that the total systematic error can be calculated as their quadratic sum, resulting in , for RUN-I and , for RUN-II. The combined result with systematic error is , and total error is 150 ppm.
2.4 Results and discussion
Figure 5 shows the summary of the measured decay rate after 1995, three results are obtained with our method and one result is obtained using thin polymer, with which the produced positronium is very slows and the the effect of the thermalized positronium is suppressed. These four results are consistent with each other. and the combined value is and shown in the red arrow in the figure. The correlations of the systematic errors are carefully taken into account. The combined result is consistent with the all four results and accuracy is 100 ppm. This result is consistent with the O() correctionADKINS04, and differs from the only up to O() by 2.6.
3 Hyper Fine Splitting
3.1 Current status
The hyper fine splitting (HFS) is the difference of the energy level between the singlet () state, parapositronium(p-Ps) and the o-Ps. The HFS of the positronium is large because of the following two reasons: (1) The magnetic moment is proportional to the inverse of the mass, and large spin-spin interaction is expected for o-Ps. (2) o-Ps has the same quantum number as photon, and o-Ps has quantum oscillation into virtual photon, o-Ps o-Ps. This frequency of 87GHz contributes only to the o-Ps, and makes HFS larger.
The precise measurement of the HFS gives the direct information about the higher order calculation of the QED, especially of the bound state QED. If an unknown light particle (like as axion or millichaged particle) exits, it contributes to the energy level, and makes discrepancy from the QED prediction. Since the quantum oscillation has good sensitivity to the hypothesis particle, whose coupling is super-weak, the precise measurement of HFS is good tool to search for the new physics beyond the Standard Model indirectly.
The precise measurements have been performed in 70’s and 80’s. These results are consistent with each other and the final precision is 3.6 ppm HFSnew . No higher order correction() has been performed at that time and these results “were” consistent with the 1st order calculation of the QED. New method to calculate the higher order correction on the bound state is established in 2000, and the 2nd and 3rd corrections have been performedHFSth . The QED prediction is 203.3917(6) GHz and it differs from the measured value of 203.38910(74) GHz. The discrepancy of 3.5 is observed. It is still marginal for statistical fluctuation, but there would be possibility of the new physics or the common systematic errors in the previous measurements. (There is also possibility that NRQED approximation is wrong.)
3.2 Old experiments and the systematic errors
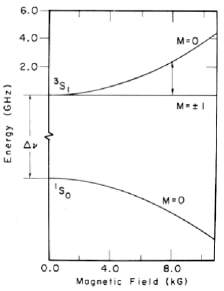
In the previous all measurements, the HFS transition was not directly measured, since 203GHz was too high frequency to be handled. The static magnetic field makes Zeeman mixing between =0 state of o-Ps and p-Ps, the resultant energy level of =0 state becomes higher than 1. This energy shift is proportional to the HFS energy level. Figure 6 shows the energy levels as function of the static magnetic field. The 1 state of o-Ps do not couple to the static magnetic field, and do not change the energy level.
Positronium was produced with the source and gas(, Argon etc) in the RF cavity, in which the high power 2.3GHz microwave was stored. Static magnetic field (about 8kGauss shown with arrow in the figure) was also applied and scanned near the resonance of the Zeeman shift. When the Zeeman energy shift is just on the RF frequency, the transition from 1 to =0 increases, and the =0 state decays into 2 immediately through p-Ps state. The 2 decay, which were tagged with back-to-back topology, increases on the resonance. HFS can be determined as center value of the resonance peak by scanning the magnetic field. Since Ps is produced in the gas, the Ps collides with the gas molecule and the electric field of the gas molecule makes the shift of the energy state, which is called as the Stark effect, and about 10ppm shift was observed for 1 atm gasHFSnew . The HFS in gas were measured by changing the gas pressures. The measured values were extrapolate to zero pressure, and the HFS in the vacuum was obtained. This extrapolation method was the exactly same as in the decay rate measurementsGAS87 ; GAS89 ; CAV90 .
There are two possibilities of systematic errors in this method. (1) First is the effect of the non-thermalized o-Ps, which is the same as in the decay rate measurement. Extrapolation procedure is assumed that Ps is well thermalized and the mean velocity of the Ps is the same for the various pressured gases. We have already shown in the decay rate measurements that this well-thermalized assumption is not satisfied, and that this method makes big systematic errors. The non-thermal Ps would affect also on the HFS measurement. (2) The Ps is widely spread in the RF cavity (size 17cm in diameter) and non-uniformity of the static magnetic field was the main source of the uncertainties of the results. Size of the used magnet were limited and the uniformity of the filed was about 10ppm level, which has been corrected.
3.3 Our new methods
We propose the following two new methods in order to solve these systematic uncertainties in the previous measurements.
3.3.1 Conventional Zeeman method using the magnet field
positron source(1MBq) is installed in the thin plastic scintillator(100m), and the timing information of the positron emission is tagged (positron emits at t=0). There are two benefits to have time information: (1) Many part of positron is just annihilated into 2 at t=0, and this 2 annihilation events make S/N seriously worse. The 2 annihilation background events can be removed dramatically with the requirement of t10nsec. (2) Thermalization process can be determined with the energy spectrum measured by the germanium semiconducting detectors, as the same as in the measurement of the decay rate. Stark effect (material effect) can be measured changing gas pressure and the non-thermalization effect are measured directly.
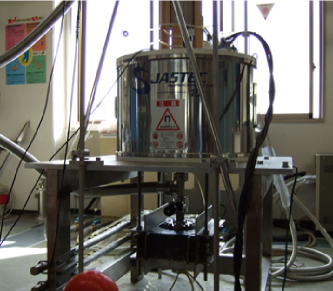
Magnetic filed is provided with the superconducting magnet developed for the medical NMR. Figure 7 shows the photograph of the magnet, which has the large bore size (80cm) and strong (about 1T) magnetic field. The magnetic filed is uniform well, we can reduce the uncertainties due to non-uniformity of the magnetic filed. 0.9T of the magnetic filed will be applied with 2.8GHz RF (power 500W) microwave. Cavity with TM110 mode resonance is used to store the RF power.

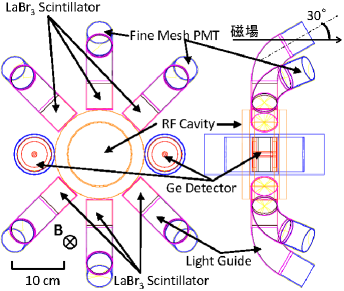
Figure 8(a) shows the gamma ray detectors and the RF cavity. Six LaBr3 scintillators and two germanium detectors are used to detect gamma ray from the Ps decay. LaBr3 scintillator has the fast signal shape as shown in Fig.8(b). Fast raising time, faster than 10 nsec, provides the good time resolution of about 300psec (FWHM at 511KeV), and the fast decay time (26nsec) grantees the pileup effect can be reduced. Energy can be measured with the high resolution (FWHM=3% at 511keV) as shown in Fig.8(b). The energy resolution is better than NaI by factor 2, then 2 processes can be tagged with the single scintillator using the energy information (Energy tagging). Since the tagging efficiency of the energy tagging is significantly higher than the ‘geometrical tagging’, in which 2 decay is tagged with two scintillators located back-to-back. The expected numbers are summarized in table 2. First measurement with this new method will be performed in this Autumn, and a few ppm accuracy will be obtained for a half year.
| geometrical tagging | Energy tagging | |
|---|---|---|
| 2 decay | 4.3 | 3.2 |
| 3 decay | 7 | 2 |
3.3.2 Direct transition using sub THz RF
(Sub) THz RF is the unexplored filed, since (sub) THz RF has the characters between the optics and the radio wave. Developing the high quality/high power source for the (sub) THz RF is useful and interesting for both science and technology. We can observe the direct transition of the HFS without magnet field, if we have good source of 203GHz RF. It is free from the systematic error due to magnetic filed, and it open the new paradigm of the atomic/particle physics using (sub) THz.
Figure9(a) shows photograph of the gyrotron RF generatorTHZ , in which high power(¿100W) sub THz RF can be produced continuously. The accelerated electron emits RF in the strong magnetic filed, and the one/specific frequency is enhanced with the resonance cavity. Arbitrary RF frequency can be picked up with the tuning resonance cavity. Tunable frequency is also big challenge of THz RF source. Improvement stability of the power is in progress and the final design of stability is about 10 ppm. This is big challenge on the THz technology and we can expect various spin off for not only basic science but also technology.
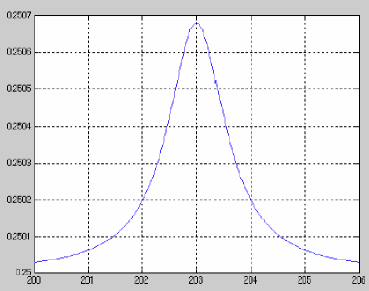
203 1GHz (tunable frequency) CW RF source will be ready in this year. The gamma ray detectors mentioned above are used, and the positron timing is also measured in order to reduce annihilation 2 and measure the thermalization process. The Fabry-Perot cavity is used for RF storage, since 203GHz has optical characters. Figure 9(b) shows the expected resonance curve with 100W RF power and Q=6000 cavity. The width(FWHM 0.63GHz) is determined with the decay rate of p-Ps, and the center value can be determined with accuracy of about 100 ppm.
4 Conclusion
The decay rate of o-Ps was measured using a direct correction method in which the thermalization effect of o-Ps is accounted for and integrated into the time spectrum fitting procedure. The new result is , and total error is 150 ppmkataD . It is most accurate result and agrees well with the last three resultsASAI95 ; JIN ; MPOL . The combined result of these four measurements is 7.04010.0007, which is consistent well with th NRQED prediction corrected up to termADKINS-4 , and differ from the result up to by 2.6. It is the first result to validate the correction.
The Hyper Fine Splitting between o-Ps and p-Ps is sensitive to the higher order corrections of the QED calculation, and the discrepancy of 3.5 is found between the measured values and the 3rd order QED prediction. We point out that there are two possibilities of the common systematic errors in the previous all measurements. (1) Non-thermalized Ps makes error in the extrapolation method as the same as in the decay rate measurements. This was serious source of the orthopositronium lifetime puzzle. (2) Non-uniformity of the magnetic field is also serious source of the systematic error.
We propose new methods to measure HFS precisely without the these uncertainties. Thermalization processes are measured with the ratio, and also 2 annihilation background events can be reduced by requirement of t ¿ 10 nsec. LaBr3 scintillators are used for tagging 2 decay, since its energy resolution is better than the conventional scintillator i.e. NaI and CsI, we can tag 2 decay only with the energy information, not with back-to-back topology. It gains by factor 70 for the tagging efficiency. Large bore superconducting magnet is prepared for new measurement, it provides the uniform/strong magnetic filed.
203GHz high power and stable RF source are developed. It makes possible to transit p-Ps into o-Ps directly. We can measure HFS directly instead of Zeeman shift. It will be the first application of sub THz RF source to the basic science.
References
- (1) C. I. Westbrook, D. W. Gidley, R. S. Conti, and A. Rich, Phys. Rev. Lett 58 1328 (1987).
- (2) C. I. Westbrook, D. W. Gidley, R. S. Conti, and A. Rich, Phys. Rev. A40 5489 (1989).
- (3) J. S. Nico, D. W. Gidley, A. Rich, and P. W. Zitzewitz, Phys. Rev. Lett. 65 1344 (1990).
- (4) G. S. Adkins, R. N. Fell, and J. Sapirstein, Phys. Rev. Lett. 84 5086 (2000) and Ann. Phys. 295 136 (2002).
- (5) S. Asai , T. Hyodo, Y. Nagashima, T.B. Chang and S. Orito, Materials Science Forum, 619 175 (1995).
- (6) S.Asai New measurement of orthopositronium lifetime, Ph. D. thesis, University of Tokyo (1994); S. Asai, S. Orito, and N. Shinohara, Phys. Lett. B357 475 (1995).
- (7) O. Jinnouchi, Study of bound state QED: precision measurement of the orthopositronium decay rate, Ph. D. thesis, University of Tokyo (2001); O. Jinnouchi, S. Asai, and T. Kobayashi, Phys. Lett. B572 117 (2003).
- (8) R.S. Vallery, P.W. Zitzewitz and D.W. Gidley, Phys. Rev. Lett 90 203402 (2002).
- (9) Y. Kataoka Test of bound State QED: Higher order correction: Precision measurement of orthopositronium decay rate, Ph. D. thesis, University of Tokyo (2007), http://tabletop.icepp.s.u-tokyo.ac.jp/oPs-life/main.final.pdf
- (10) M.H. Yam, P.O. Egan, W.E. Frieze, and V.M. Hughes, Phys. Rev. A18 350 (1978).
- (11) J. A. Rich, Phys. Rev 61 140 (1951).
- (12) M.W. Ritter, P.O. Egan, V.W.Highes and K.A.Woodle, Phys. Rev. A30 1331 (1984). A.P. Mills. Jr, Phys. Rev. A27 262 (1983).
- (13) G.S. Adkins, R.N. Fell, and P.Mitrikov. Phys. Rev. Lett. 79 3387 (1997). B. kniehl and A.A.Penin, Phys. Rev. Lett. 85 5094 (2000).
- (14) T. Idehara et al. Int. J. of Infrared and Millimeter Waves 28 433 (2007).