Enhancement of the Deuteron-Fusion Reactions in Metals and its Experimental Implications
Abstract
Recent measurements of the reaction 2H(d,p)3H in metallic environments at very low energies performed by different experimental groups point to an enhanced electron screening effect. However, the resulting screening energies differ strongly for divers host metals and different experiments. Here, we present new experimental results and investigations of interfering processes in the irradiated targets. These measurements inside metals set special challenges and pitfalls which make them and the data analysis particularly error-prone. There are multi-parameter collateral effects which are crucial for the correct interpretation of the observed experimental yields. They mainly originate from target surface contaminations due to residual gases in the vacuum as well as from inhomogeneities and instabilities in the deuteron density distribution in the targets. In order to address these problems an improved differential analysis method beyond the standard procedures has been implemented. Profound scrutiny of the other experiments demonstrates that the observed unusual changes in the reaction yields are mainly due to deuteron density dynamics simulating the alleged screening energy values. The experimental results are compared with different theoretical models of the electron screening in metals. The Debye-Hückel model that has been previously proposed to explain the influence of the electron screening on both nuclear reactions and radioactive decays could be clearly excluded.
pacs:
25.45.-z, 25.60.Pj, 26.20.+f, 23.90.+wI INTRODUCTION
The cross section for nuclear reactions between charged particles at low energies is mainly determined by the penetration probability through the Coulomb barrier, which results in a steep exponential decrease towards lower energies. At sufficiently low energies, however, this decrease is slowed down due to screening the Coulomb barrier by the inevitable presence of surrounding electrons. The electron screening was originally taken into account for nuclear reactions preceding in dense astrophysical plasmas in the interior of stars (Salpeter, 1954) where the nuclear reaction rates can be increased even by many orders of magnitude. For laboratory investigations of nuclear reactions at very low energies, this effect was theoretically described (Assenbaum et al., 1987) and experimentally observed in different fusion reactions on gas targets, e.g. (Rolfs and Somorjai, 1995). The corresponding enhancement of the nuclear cross section could be explained by the gain of electron binding energies between the initial distant atoms and the final fused atom. This was attributed to the raise of the kinetic energy of colliding nuclei and called electron screening energy. For the first time, the electron screening effect resulting from much more important for astrophysical applications free electrons was investigated in the d+d fusion reactions taking place in metallic environments (Czerski et al., 1998, 2001; Huke, 2002). The experimentally determined screening energies for some heavier metals were one order of magnitude larger than the gas target value (Greife et al., 1995) and larger by a factor of about four than the theoretical predictions (Ichimaru, 1993). These experimental results were also confirmed by other authors (Yuki et al., 1998; Kasagi et al., 2002; Raiola et al., 2002a, b; Bonomo et al., 2003; Raiola et al., 2004).
Meanwhile, the electron screening effect in the d+d fusion reactions has been studied for over 50 different metals and some insulators (Raiola et al., 2002b; Bonomo et al., 2003; Raiola et al., 2004) allowing, in principle, for a systematic study of the target material dependence of the electron screening energy. Unfortunately, there are some discrepancies between experimental values obtained by different groups (Czerski et al., 2006a). They probably arise from some experimental systematic uncertainties connected with oxidation of the target surface or with a high mobility of the implanted deuterons under beam irradiation, which can lead to unstable deuteron density profiles within the target. Both effects play a crucial role for the experimental determination of the screening energies (Huke, 2002; Huke et al., 2007). The basic quantity received from the experiment is the nuclear reaction yield which is given for a thick target as an integral over the range of the projectiles with the target nuclei density distribution and the cross section . So deviations in the observed yield have the two principal causes: changes in the deuteron density profile and modification of the cross section, probably by the screening effect, which are merged in the integrant product . Some standard experimental difficulties have been already discussed in our preceding paper (Huke et al., 2007) where an especially adapted data acquisition and analysis method, allowing us to discern between changes in and , has been presented in a systematic manner. Based on this method, we report here some new experimental results and estimate experimental uncertainties of previous experiments. We additionally compare data obtained by different groups and discuss systematic errors of applied experimental and analytical methods.
From the theoretical point of view, the large number of experimental data corrected for the discussed experimental uncertainties enables a comparison with theoretical predictions. The first ab-initio quantum mechanical calculation of the screening energy in a crystal environment has been recently performed using realistic wave functions (Huke et al., 2008). However, the results are still unsatisfying because of the very high demand for computational power limiting the model accuracy. Thus, the self-consistent dielectric function theory developed previously (Czerski et al., 2004) will be used here for the calculation of the screening energy contributions coming not only from free electrons but also from bound electrons of reacting nuclei and host metals. Additionally, the interaction with the crystal lattice will be included. The theoretical results will be extended for comparison with the last experimental studies of the electron screening in nuclear reactions between heavier nuclei (Kasagi et al., 2004; Cruz et al., 2005; Kettner et al., 2006) and in radioactive decays (Limata et al., 2006; Rolfs, 2006; Ruprecht et al., 2006). On the other hand, it has recently been suggested that the enhanced electron screening can be explained within the classical Debye-Hückel model (Bonomo et al., 2003). The idea has been supported by an observation of the predicted inverse proportionality of the experimental screening energies to the square root of the absolute target temperature (Raiola et al., 2005, 2006). As a consequence one could expect a magnification of the and decay rates when radioactive sources would be put in metals at cryogenic temperatures. Even though the Debye screening cannot be applied to strongly coupled electron plasmas, as metals at moderate temperatures are, the suggestion has found much public interest (Ball, 2006; Muir, 2006; Rolfs, ; Rolfs, 2006). Thus, both experimental and theoretical aspects of the temperature effect of the electron screening will be subject of a critical discussion clearly showing the inapplicability of the Debye-Hückel model for these issues.
II Experimental set-up, data acquisition and analysis
The experiments have been carried out at an accelerator optimized for low energy beams. Fig. 1 illustrates the principal set-up and the data acquisition system.
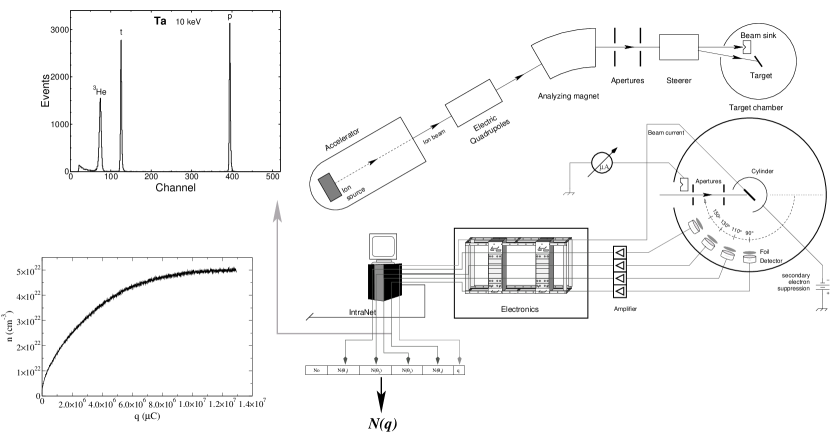
The accelerator consists of a radio frequency ion source, an acceleration line powered by a highly stabilized supply and subsequent electric quadrupoles for focusing and a magnetic dipole for beam analysis. The beam impinges onto a Faraday cup just inside the target chamber where beam adjustment can be done without disturbing the deuteron density in the targets. A horizontal magnetic steerer is used to deflect the beam onto the target, such removing neutral particles and contaminations carried along by the beam. A cylinder box set to a negative potential surrounds the target in order to suppress secondary electrons. The isolated target holder is connected to a current integrator. The targets were disks made from different pure metals becoming self-implanted deuterium targets under the beam irradiation. Four Si-detectors at the laboratory angles of 90∘, 110∘, 130∘ and 150∘ were used for the detection of all charged particles, p, t, 3He, of the reactions 2H(d,p)t and 2H(d,n)3He. The detectors needed to be shielded from the backscattered deuterons in order to prevent a congestion of them and the data acquisition system. Therefore grounded Al-foils of thicknesses from were placed in front of the detectors. The thickness is sufficient to block deuterons up to while all other ejectiles could pass. The detector voltage pulses travel through pre-amplifiers and spectroscopic amplifiers. The signals are digitized by four ADCs in an embedded VME system connected to a computer which automatically integrates the proton lines of the spectra in fixed time intervals 111down to limited by the serial line and records the four differential counting numbers and the charge of the integrated beam current at the target in a file which then can be further processed. An example spectrum is shown in fig 1; all ejectile lines are clearly identifiable. Due to the anisotropic angular distribution of the ejectiles of the d+d fusion reactions even at the lowest energies, a total counting number is calculated providing the tabulated function which is the basic quantity for the further data analysis.
Correspondingly, the experimental reaction yield is given by
| (1) |
where the number of impacting projectiles is already substituted by their charge, is the detector efficiency and the charge state of the projectile. On the other hand the yield can be calculated for an infinitely thick target (regarding the projectile range ) by
| (2) |
with the number density of the target nuclei and the cross section . Unlike other chemical compounds the small hydrogen atoms are not trapped in firm chemical bonds with metals. The hydrogen density is not bound to a fixed stoichiometric ratio and can and indeed does change under ion irradiation. Changes in the yield may now originate from both the deuteron density and the cross section and need to be discriminated. The density is here a function of the target depth, the projectile energy, the implanted charge, the beam flux and other target material dependent and environmental conditions. The tabulated function provided by our data acquisition system makes it possible to retain the differentiation in (1) and thereby gain information on the charge development of a depth averaged density . So assuming depth homogeneity of the deuteron density in (2) the depth can be substituted by the projectile energy with the stopping power differential equation (Anderson and Ziegler, 1977)
| (3) |
where and are the stopping power coefficients in the metal and in hydrogen, the appendant hydrogen density. Applying this substitution one arrives at a motivation and an expression for the reduced yield (Czerski et al., 2001; Huke, 2002; Huke et al., 2007)
| (4) |
Since both the cross section in the metallic environment and the deuteron density are unknown the yield need to be set in relation to a known gas target cross section. We therefore chose the parameterization from (Brown and Jarmie, 1990) because it has the highest precision. It forms together with the low energy function () of the stopping power (3) the integral in the denominator on the right hand side. The gray printed expression is per se a constant. So if the reduced yield is not constant it is based on deviations of the prescribed progression in the cross section or in the functional dependence of the stopping powers or changes in the density. It is a sensitive measure for such deviations but the distinction of the possible reasons is a matter of reasonable interpretation. Fig. 2 shows plots of the reduced yield at two different energies.
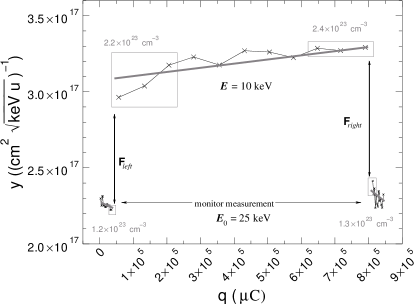
One can see long term changes in the individual measurements indicated by the straight lines. These are attributed to changes in the deuteron density profiles scattered by the counting statistics, of course. In contrast, the large discontinuities of the reduced yield at the switching of the beam energy result from a modification of the cross section. This is taken into account by the enhancement factor in (4). Since the absolute quantity of the deuteron density is unknown for the practical analysis a normalized enhancement factor is defined
| (5) |
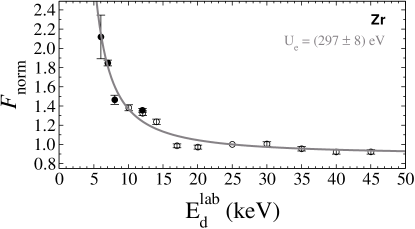
with the normalization energy which is chosen to be for the monitor measurements. The gray rectangles indicate the points from which the experimental error for is inferred. Thus not only errors from the counting statistics but also from long term changes of the density are included. Results obtained for different projectile energies are displayed in Fig. 3.
Assuming electron screening as the reason for the increase of and adopting as a kinetic energy shift parameter called the screening energy in the cross section (Assenbaum et al., 1987) of the yield one receives (Czerski et al., 2001; Huke, 2002; Huke et al., 2007)
| (6) |
for the screening enhancement factor of thick target yields 222The screening energy should only be applied to the Coulomb barrier penetration in , see (Huke et al., 2007; Czerski et al., 2004). The correction becomes only important for far lower beam energies.. The factor 2 arises from the CM-Lab-transformation. So is an enhancement factor for thick targets in analogy to the enhancement factor for thin targets from (Assenbaum et al., 1987)
using the S-factor parametrization of the cross section with the Sommerfeld parameter in the second line and applying an approximation in the third line, which demonstrates its qualitative behaviour as a roughly exponential increase for decreasing energies. The corresponding curve in Fig. 3 obtained for a fitted value of supports the screening hypothesis. Our data analysis procedure is thus independent of the absolute value of the deuteron densities inside the targets and the stopping power coefficients which otherwise would introduce errors of . The functional dependency of the stopping powers on the energy has been repeatedly confirmed, see (Møller et al., 2004) and references therein. The reduced yield can be used to calculate a deuteron density estimate by solving (4) for and supposing (Huke et al., 2007, Eq. (10)). Only for this purpose the stopping power coefficients are explicitly required. A corresponding density plot for an initial implantation in Al is shown in Fig. 1. The numbers above the gray boxes in Fig. 2 are density estimates for that areas.
This is in brief the basic experimental procedure as of (Czerski et al., 2001; Huke, 2002; Huke et al., 2007). For the study of the electron screening effect two experimental campaigns were executed. Since the special physico-chemical properties of the hydrogen compounds and the beam induced chemical reactions at the target heavily influence the obtained results (Huke, 2002; Huke et al., 2007), the second more extensive campaign needed to investigate these interfering effects (Huke et al., 2007, Sec. 4) which are sketched in a concise survey in the next section III.
III Experimental specialties and pitfalls
The investigation of nuclear reaction cross sections on deuterium in metals should be performed at the lowest possible energies. This means that the composition of the topmost atomic layers of the metallic target is of crucial importance because of the quickly decreasing range of the beam ions, considerably below . This exactly is unusual for experimental nuclear physics. The usual set-ups in experimental nuclear physics are constructed in high vacuum technology. But here the contained water vapour from the surfaces of all materials leads under ion impact to a progressing oxidation of the target metal because of the stronger electron negativity of oxygen in comparison to hydrogen. Hence, hydrogen is contained in metal oxides only in segregation at low and unstable densities. Consequently, the oxidation diminishes and eventually destroys the screening effect with the growing thickness of the metal oxide layer. Carbon hydrides contained in HV systems pose another problem leading to carbon layers on the target as will be discussed below. In such a way generated alterations in the depth profile of the deuteron density distribution in the target is the singular dominating error source for the observed enhancement and the inferred screening energies. Our vacuum system is made of aluminium with elastomer gaskets pumped by turbo molecular pumps with auxiliary oil lubricated two stage rotary vane pumps and LN2 cooled cryogenic traps (Huke et al., 2007, Fig. 1). A residual gas analyzer (RGA) was used in order to monitor the composition of the residual gas in the vacuum. This is here merely a concise presentation; for a more extensive description see (Huke et al., 2007).
In accordance to the literature about HV systems the main constituent of the residual gas is water. Water vapour is due to its extraordinarily high dipole moment very adhesive to solids and is hence chemisorbed to surfaces. Now under the ion irradiation several processes are enabled. Via heating and phonon excitation at the surface the beam provides the activation energy for dissociative chemisorption of the water molecule, i.e. the protons are splitted off and the remaining oxygen radical forms a chemical bond to the metal atoms. Essentially, the same happens by direct impact excitation of the water molecule by the ions. The hydrogen implantation into the metal causes aside from the usual surface deterioration a in depth destruction of the crystal integrity of the material known as embrittlement which always occurs if the hydrogen loading rate is too high and not proceeding in thermal equilibrium (Mueller et al., 1968). Thus, the surface is fractalized and the oxidation can progress into the bulk of the metal quickly creating a thick metal oxide layer. Fig. 4 contains as an example for it a picture of the surface of an Al target which turned into a sponge like structure.
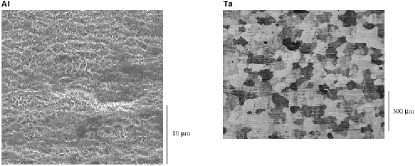
The rate of the oxidation process depends on the concrete form of the mutual interaction potential between the water molecule and the surface atoms, establishing a material dependency. The energy supply of the beam enables these processes even for the noble metals. Albeit generally spoken, more reactive metals apt more to oxidation and embrittlement while for the latter the structural difference between the metal and the metal hydride is more important. Aside from the overall beam heating the energy of the projectiles is also important because lower energy projectiles are more effective at the surface (Ensinger, 1997). The partial pressure of water in HV is so high that there are ample supplies for the surface chemical reactions. The hit rate of water molecules with a sticking coefficient of almost one is in comparable orders of magnitude as usual beam currents of . This implies a dependence on the ion flux, too. There are two counteracting processes: Sputtering and thermal or ion stimulated desorption. The sputtering yield of the lightweight deuterons is far too low in order to keep the surface clean with the resulting sputtering rate. One would expect that an increased temperature of the surface would increase the desorption rate of the water molecules. If the activation energy barrier for dissociative chemisorption of water is positive an increased temperature yet proliferates the oxidation333see e.g. (Zangwill, 1988) or any surface physics textbook. Similar is valid for ion stimulated desorption/chemisorption. Such again depends on the interaction potential but usually oxidation prevails. Unless UHV systems equipped for entire baking are used the oxidation cannot be avoided. A deuteron irradiation of only is enough to produce a considerable metal oxide layer, see (Huke et al., 2007, Fig. 6). There is, however, a process that is nonetheless able to prevent oxidation: large carbon hydride molecules, e.g. backstreaming from the forepumps, can be physisorbed at the surface, cracked up and the carbon atoms can react with the oxygen radicals to carbon monoxide keeping in that way the surface clean. Differently from water, carbon hydrides are physisorbed to surfaces. The strength of this weaker bond increases with growing molecular mass. The ratio of absorption and desorption under the ion irradiation has similar dependencies. An evidence for this chemical surface reaction is the detection of a considerable CO fraction by the RGA which was below the detection threshold without beam irradiation (Huke et al., 2007, Fig. 7). These processes were thoroughly explored by the regulated infusion of decane with monitoring feedback as the main part of the second experimental campaign. The surface can only be kept clean if the fraction of water and carbon hydrides in the residual gas are in an equilibrium which is of course also dependent on prementioned parameters. If the fraction of carbon hydrides is too low the surface will oxidize. If it is too high a carbon layer will build up. Both is essentially irreversible. Fig. 5 shows some of the results of these experiments for Ta demonstrating the high spread in the inferred screening energies depending on the surface composition which were verified by electron dispersive X-ray micro analysis (EDX).
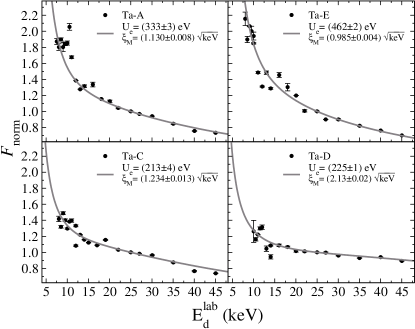
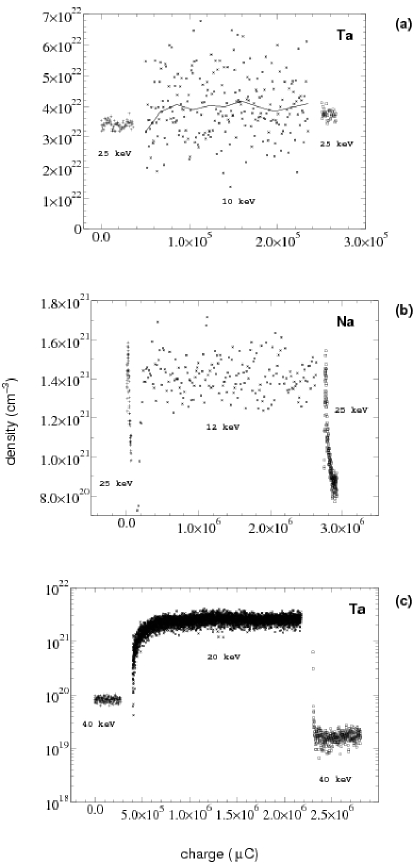
In order to limit the layer formation the totally implanted charge was reduced (Huke et al., 2007, Sec. 4.2). For the analysis a more sophisticated expression for the yield in (4, 5) was used based on a model of the target with three stacked layers (Huke et al., 2007, Sec. 4.3): The top layer consisting of either metal oxide or carbon, a deuterized zone of the metal and the bulk of the metal containing essentially no hydrogen. Each can have different thicknesses and relative deuterium contents. The results for in Fig.5 were obtained with only the additional parameter for the thickness of the deuterated zone in the metal in energy equivalent units of the stopping (Huke et al., 2007, Sec. 5). The differences for Ta-A and Ta-E are already considerable though the thicknesses of the surface layers were small and just started forming. Fig. 4 shows the beginning of the formation of a carbon layer starting from islands which will eventually cover the whole surface in concordance with experiences from thin film technology (Ensinger, 1997). Ta-C has already a relatively thick carbon layer which strongly reduced the screening energy. Just as the metal oxide layer does in Ta-D. Those layers were just thick enough in order to be included in the model and infer their thickness. The thickness of the metal oxide layer is , which conforms to about . The corresponding screening energy would be (Huke et al., 2007, Sec. 5, Table 2). are enough to let the screening enhancement completely vanish (Huke et al., 2007, Sec. 4.3). The deduced deuteron density is hardly affected and still in the vicinity of the stoichiometric ratio as the example in Fig. 6(a) shows (Huke et al., 2007, Sec. 6, Fig. 13.(e,f)).
Much thinner surface layers already reduce the inferred screening energy considerably. So the real value for the screening energy of Ta is possibly around (Huke et al., 2007, Sec. 5, Table 2). Anyhow, the screening energy values ranging from give an imagination of the systematic error originating from the surface layer formation. Carbon can achieve high deuteron densities but it does not show the electron screening effect as Fig. 7 proves. Thin deuterated carbon layers can, however, simulate a screening enhancement as inhomogeneous density profiles can do (Huke et al., 2007, Sec. 4.3). Though the former could be excluded in our experiments but is a theoretical possibility when thin deuterated carbon layers form on targets containing few deuterium in segregation as below.
As already said, the metal oxide contains only few deuterium in segregation. Those low densities are unstable and change under different conditions. At the example of a Na target with a very thick metal oxide layer the development of the calculated deuteron density is illustrated in Fig. 6(b) (also (Huke et al., 2007, Fig. 13.(b-d))). The density estimates are calculated from the reduced yield as previously described. Before the monitor measurement at a measurement at a low energy had been taken. Then the density quickly decreased at . Thereafter a measurement at were started. Now, the density very quickly increased reaching a higher level than at . But the discontinuity at the beginning was in the opposite direction. The density for the sequencing monitor measurement started once again at a high density which quickly decreased. The discontinuity at the beginning was once again in the wrong direction. So there is definitely no screening in contrast to the positive case of Fig. 2. The quick shifts in the densities after the change of the implantation energy going to a ’saturation’ level originate from a shift of the deuteron distribution depth profile in the metal oxide linked to the different ranges of the ions (Huke et al., 2007, Sec. 6, Fig. 14). With our method of recording a yield function over the implanted charge we can recognize those shifts and reject them. If, however, only the total yields of the long time measurements are regarded as in the usually applied standard method (like in the other experiments discussed in Sec. V.1) their comparison would erroneously lead to a screening interpretation.
The same problem arises when working with low implantation densities below the stoichiometric ratio even when the metal oxide layer is negligible. Except for insufficient implantation the density remains low if the thermal energy of the deuterons is higher than their chemical binding energy to the metal so that they can float. This applies mainly to transition metals with low ability to bind hydrogen (groups 6A-8A, 1B) or if the metals are heated. An example for the consequences of heating is shown in Fig. 6(c) for a Ta-foil of which was heated by the beam power. One observes the same behaviour and no real screening enhancement. The density returns to an equal saturation level if the surrounding conditions are the same, i.e. same beam energy, current, target heat flow etc. Tests with a Au-foil showed an alike behaviour. The most effective heat transportation mechanism in solids is the free electron gas. Cooling the target holder has little effect since the thermal resistance at the connection is very high. Besides from heating the density profile of the deuterons in target materials with low binding ability for deuterons (metal oxides, metals with low affinity to hydrogen, metals at high temperatures) is also changed by direct projectile hits and close phonon generation at the target deuterons depending on the beam energy. Furthermore, the metal oxide as a thermal insulator will be considerably heated by the beam power. It is therefore preferable to use thick target disks at moderate temperatures with high densities. On the other side, cooling a target to very deep temperatures would transform it into a cryogenic trap accumulating water in thick layers on its surface prior to irradiation promoting the oxidation. The detailed investigation is covered in (Huke, 2002).
Summarizing, our data analysis method is independent of the absolute deuteron density and allows for the discrimination between changes in the reaction yield due to the density dynamics as in Fig. 6(b,c) which are rejected and actual changes in the cross section which become manifest in the discontinuities at the edges of the measurements like in Fig. 2. That the discontinuities signify cross section modifications is further ensured by analyzing measurements which are taken in proximity of the stoichiometric ratio only, where changes of parameters like beam flux and temperature have marginal influence on the overall deuteron density, at most. The error of is a convolution of the error from the counting statistics and long term changes of the density. The use of high vacuum systems will inevitably cause the build-up of contamination layers. Thanks to our analysis method those layers can only diminish the inferred screening energy since feigned enhancements due to density dynamics get rejected (Huke et al., 2007, Sec. 6). The utilization of carbon hydrides embanks the layer formation enabling the results in HV at all (Huke et al., 2007, Sec. 4.2). Indeed this is a difficult and labile equilibrium in the residual gas. So layers are present, which were examined by EDX allowing for a relative measurement of element abundances (Huke, 2002). But the thickness can hardly be quantified because of the fractal structure of the target surfaces (e.g. Fig. 4). Though the model suggests that are sufficient to completely dispose of the screening enhancement. All in all, the obtained screening energies represent lower limits to the real value. The magnitude of the dominating systematic error from the unknown layer thickness can be assessed by the measurements in Fig. 5.
IV Results
IV.1 Experiment
The experimentally determined results for the screening energies are summarized in Table 1.
| Metal | MDx111Approximate average deuterium contents in relation to the number density of the metal | in eV |
| Ta | 0.9 | 322 15 |
| Zr | 2.1 | 297 8 |
| Al | 0.8 | 190 15 |
| Sr | 1.0 | 350 - 800 |
| Li | 0.03 | |
| Na | 0.03 | —333An oxidation layer impeded the determination of |
| Pd | 0.3222The initial implantation was deliberately prematurely aborted. | 313 2 |
| C | —444Carbon density unknown. See text. | 0 |
The values from the campaign I are in the upper part of the table. In the lower part of the table are accessory results from the campaign II. In the second column of the table are the ratios of the deuterium number density to that of the hostmetals. Since the deuteron density can and does vary during a measurement these values are estimated averages. The values for Strontium and Lithium are heavily impaired by the layer formation due to the high reactivity of both metals, for Li more than for Sr. Such expressed itself as strong variations in the deuteron densites and accordingly in the reduced yields during the course of the measurement, leading to ambiguous values for the discontinuities of the reduced yields. So these screening energies should be regarded as estimations, at best. The results were obtained utilizing the equilibrium in the residual gas in order to keep the target surface clean which was subsequently verified by EDX analysis (Sec. III and more detailed (Huke et al., 2007, Sec. 4.2)).
The first plot in Fig. 7 is a measurement on palladium with roughly equal residual gas conditions as for the Ta-measurements (Huke et al., 2007, Sec. 5). The totally implanted charge was limited for the same reason, i.e. layer formation, as in the Ta-measurements of Fig. 5.
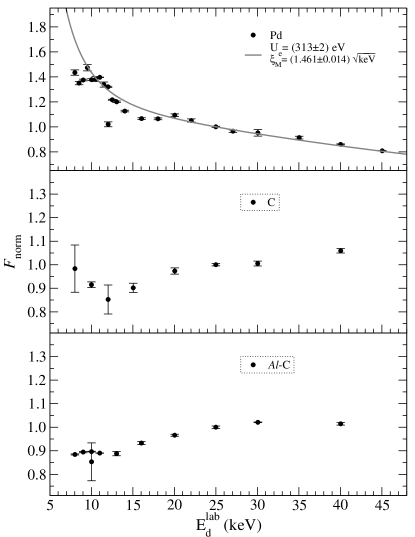
The beam spot contains traces of carbon specifically some dark stains (Huke et al., 2007, Fig. 8). The other two plots are the experimental prove that carbon has no screening enhancement. The drop to the lower energies originated from a lower deuterium content in the upper layers of the targets. This drop can also be caused by the voltage drop in the plasma inside the RF-ion source (Kamke, 1956) (Huke et al., 2007, Sec. 2) which has a higher impact for lower energies relative to the monitor measurement at . The two carbon targets were preparated with different methods. The first one was made by deposition of soot from a ethine flame on a backing plate. A flame of ethine (C2H2) burning with insufficient oxygene supply produces very pure carbon. However, the material is amorphous and rather fluffy. Accordingly, the deuteron density reaches only values of about . The second target is a carbon film produced by the irradiation of aluminium with high decane pressure. That in such way deposited carbon was compactified by the impacting beam ions while forcing it to adopt the lattice structure of the substrate to a certain extend (Hering, 1999). Hence the density of the carbon atoms is higher, so is the deuteron density with about . Howbeit, these are only estimates since the carbon densities are not known and as a result the correct stopping power coefficient which is required (4) (Huke et al., 2007, Eq. (10)) neither. Anyway, the resulting enhancement factors show no significant disagreement. Thus, carbon films present no signs of electron screening. These results are listed in the lower part of Table 1.
The highly reactive metal natrium corroded so easily that only low deuteron densities could be achieved and no screening was visible. Two tests with Y and Er led to thick metal oxide layers, too. Different to the other metals the concomitant analysis of the 3He spectral peak revealed in both experimental campaigns for Li, Na and Sr a significant suppression of the neutron reaction channel and a simultaneous alteration of the angular anisotropy (Huke et al., 2006; Huke, 2002).
IV.2 Theory
From the theoretical point of view the deuterized metals can be treated as a strongly coupled plasma (Ichimaru, 1993). Since the velocity of reacting nuclei is smaller than the Fermi velocity, the electron screening effect corresponds to a static polarization of surrounding conduction and bound electrons. Consequently, the electrostatic potential energy between reacting nuclei of charges and shielded in a metallic medium can be described within the self-consistent dielectric function theory (Czerski et al., 2004):
| (8) | |||||
The wave-number dependent dielectric functions and describe polarization of valence and core electrons of host atoms induced by a charged impurity taking into account the short range electron correlation and the exchange interaction between electrons (for details see (Czerski et al., 2004)). and functions are the screening function and electronic charge-formfactors of reacting nuclei, respectively. At small distances (applicable for nuclear reactions and decays) the potential energy can be approximated using the energy independent polarization screening energy which scales with the product of the charges of the involved nuclei. For the d+d reactions we used the self-consistent charge form-factor within the Thomas-Fermi approximation (Grosso and Parravicini, 2000; Czerski et al., 2004):
| (9) |
Here, the Thomas-Fermi wave number has been applied; and are the electron number density and the Fermi energy, respectively. The number corresponds to the fraction of electrons bound to deuterons and is for metals close to unity. Since we are interested in the evaluation of the strongest possible screening effect, we uniformly set for all target materials. In the absence of screening and , reduces to the bare Coulomb potential ().
In the metallic lattice, besides electrons also positive ions can contribute to the screening of the Coulomb barrier between reacting nuclei. This effect, called cohesion screening (Czerski et al., 2004), can be calculated as a gain of the potential energy of two deuterons in the lattice field of the host metal compared to that of the helium atom produced in the fusion reaction. To calculate the potential energies we used the universal ion-ion interaction given by Ziegler, Biersack and Littmark (Ziegler et al., 1985). For a rough estimation of the cohesion screening energy , we calculated the potential energy gain resulting from the surrounding 12 host atoms assuming the same fcc crystal structure for all target materials investigated. The cohesion screening is a slowly increasing function of the atomic number. The total screening energy is the sum of both contributions .
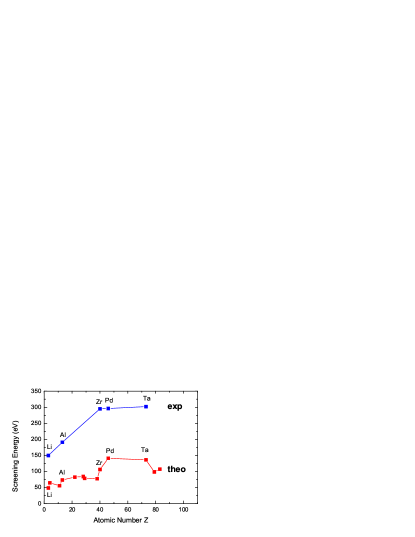
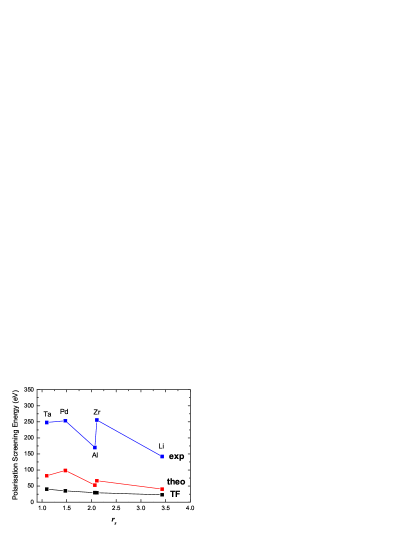
The results of the theoretical calculations obtained for the d+d reactions taking place in different metallic targets are presented in Fig. 8 together with our experimental values. The electron screening energies moderately increase with the atomic number of host atoms (Czerski et al., 2006a) reaching for heavier nuclei the value of about . The experimental target material dependence agrees with the theoretical expectations. However, the experimental screening energies are larger by a factor of about 2 compared to the theoretical values. Since the experimental screening energies obtained for insulating materials are much smaller () (Czerski et al., 2006a) and taking into account that the screening contributions arising from polarization of bound host electrons and cohesion should be similar for both metallic and insulating targets, we can conclude that the enhanced screening effect results from conducting electrons. Thus, for a comparison between different target materials the electron-gas parameter where and are the valence electron density and the Bohr radius, respectively, is much more suitable. Using this parameter, the experimental polarization screening energies obtained by subtraction of the theoretical cohesion contribution are displayed in Fig. 9 together with the theoretical polarization screening energies.
Now, the quality of the theoretical description is much better visible. In contrast to the simple Thomas-Fermi model (Grosso and Parravicini, 2000) providing for free electrons a smooth dependence of the screening energy given by the dielectric function theory describes fluctuations of the experimental polarization screening energy very well. The fluctuations result from the polarization of bound (core) electrons which contribution to the total screening energy depends very strongly on their binding energy (Czerski et al., 2004). If the bound electron contribution is eliminated from the experimental polarization screening energies we get experimental values for the free electron polarization which can be parameterized by a smooth dependence on . This result can be used for an estimation of the free electron contribution in metallic environment to the screening energy in reactions between nuclei with charges and . Different to the d+d reactions, the contribution coming from electrons bound by heavier reacting nuclei is much larger and should be included separately. This can be calculated as the gain in electron binding energies between distant atoms and the final united atom. Similar results are to obtain using the Thomas-Fermi model leading to (Czerski et al., 2006b). In the case of heavier nuclei the cohesion screening energy can be neglected, since the strength of the interaction with the lattice atoms increases much weaker than the product . Thus, the total screening energy is only the sum of the free electron and bound electron contributions. The same estimation can also be applied for radioactive and decays (Czerski et al., 2006b).
The dielectric function theory does not predict any temperature dependence of the polarization screening energy unless the electron density of the target material remains constant and the projectile velocity is smaller than the Fermi velocity. That is typical for a strongly coupled plasma. For velocities higher than the Fermi velocity the electrons are not able to follow the ions and the electron screening gets weaker. In this limit of a weakly coupled plasma (Debye-Hückel limit) the screening length becomes larger than the mean atomic distance and classic description of the electron screening is applicable. The screening energy is inversely proportional to the square root of the kinetic energy or equivalently of the plasma temperature (). An analytical formula connecting both limits has been derived by Lifschitz and Arista (Lifschitz and Arista, 1998) for the stopping power of moving ions in the electron gas and can be applied for the electron screening in nuclear reactions (Czerski et al., 2006a). Thus, the velocity dependence of the screening energy can be given as follows:
| (10) |
where and denote dynamic and adiabatic screening energies, respectively. The Fermi velocity depends on the electron density and therefore is characteristic for the target material. The above relation calculated for the d+d reactions in the Ta environment is presented in Fig. 10.
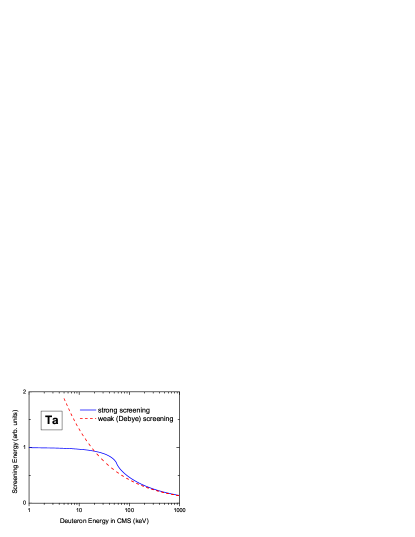
Additionally, the energy dependence of the Debye-Hückel screening is shown. It is visible that the electron screening can be described by the Debye-Hückel theory only for projectile energies higher than the Fermi energy (the Fermi energy of deuterons in Ta amounts to about ) or equivalently for temperatures higher than the Fermi temperature (for Ta ). Thus, in the cases discussed here, the Debye-Hückel screening is not applicable for both nuclear reactions and radioactive decays.
V Comparison with other experiments
In view of the augmented information provided by our differential analysis method and experimental procedure the results of other groups will be discussed.
V.1 d+d Experiments
In Fig. 11 an overview of screening energy results and appendant deuteron densities from other experiments is plotted.
All were carried out in high vacuum systems hence suffering from the same progressive oxidation process under ion irradiation with the inherent problems as of Sec. III and (Huke et al., 2007). A quick glance already shows that the screening energy results are pretty much scattered not revealing a pattern. But in conjunction with the deuterium metal ratio aka the deuteron density peculiarities become evident. Our high screening energy results (Table 1) were achieved at high absolute densities in the proximity of the chemical stoichiometric ratio where the ion beam flux has no influence on the target deuteron distribution. Whereas the high screening results of the other groups were exclusively attained at low deuteron densities below the metal number density. Complementary high densities did not yield enhanced screening in those experiments. Both classes of screening results are associated to groups in the periodic table exposing the chemical relationship with respect to the surface reactions and hydrogen binding ability of the targets as described in Sec. III. Particularly manifest is that in Fig. 11 for the group 3A metals including the lanthanoides which have low screening values at high densities and conform to the counter example case of Fig. 6(a). But also the transition metals show three clusters of high screening results at low densities in Fig. 11 corresponding to the case of Fig. 6(b) and Fig. 6(c) respectively. Such will be substantiated in the following.
V.1.1 The Garching Experiment
The first accelerator experiment with the aim to search for modifications of the cross section in the d+d fusion reactions caused by the metallic environment was done on Ti (Roth et al., 1990). No enhancement could be observed. The measurements were performed on a Ti foil fixed in a copper target holder frame with flow channels for LN2 cooling and a thermocouple for temperature determination. No effort was made to specify the deuteron density in the target. Instead a fixed value from material research was adopted which is inadequate. Due to the deep cooling of the target water is accumulated on its surface, which produces under ion irradiation a considerable oxide layer 444This is sustained by (Roth et al., 1990, Fig. 3). There the proton counting number is plotted over the implanted charge with a coarse resolution. The gradient of this curve is proportional to the yield and the deuteron density (1, 2). The curve should be linear at and after saturation. At is a hump in the curve after which the gradient is clearly lower than before. The authors explain it by a hydrogen release from the foil because of a short temperature increase. However the gradient remains significantly below the previous value which altogether rather complies to the curve from a metal oxide build up in (Huke et al., 2007, Fig. 6), C/O=0.4.. In addition, the beam current up to leads to a distinct temperature increase inside the de-acceleration volume of the ions in the thin foil which will also alter the density profile away from the supposed unit value. All further measurements on Ti in Fig. 11 resulted in very low screening values with densities in proximity of the chemical stoichiometric ratio. The higher the deuteron density, the lower the screening value. Ti is chemically very similar to Zr, both belong to the group 4A. From our experience Zr oxidizes readily. So a relatively thick metal oxide layer complying to the third case in (Huke et al., 2007, Fig. 13.(e,f)), Fig. 6(a) explains the results.
V.1.2 The Tohoku Experiments
The results of (Yuki et al., 1998; Kasagi et al., 2002) are based on the analysis of the total yield of the proton measurements (Yuki et al., 1998, Eq. (1)) with one detector at the lab-angle and at the projectile energy
| (11) |
after depth energy substitution (Sec. II) with the proton detection efficiency a cross section parameterization of (Bosch and Hale, 1992) and finally the target deuteron number density which is presumed to be constant for all energies and ranges. With the stopping power relation the additional error of the stopping power coefficients is introduced. In order to determine and observe the density value repeated monitor measurements were performed at . The density was then calculated from the yield by solving (11) for with the supposition that the screening enhancement is there negligible. According to the not unambigious text ((Kasagi et al., 2002) and suitable back references) for the quantification of the enhancement and extraction of the screening energy the yields are normalized to the experimental one at thus becoming independent of the actual value of :
| (12) |
| (13) |
where the theoretical expression for the thick target enhancement factor is simply adopted from the approximated term in (II) of (Assenbaum et al., 1987) for the enhancement of the cross sections in thin targets. This expression is, however, derived for cross sections based on an increase of the effective projectile energy. It might be introduced in the integrant in (11) at the most and must not be pulled out of the integral in that manner. A thick target enhancement factor should retain the energy integration like in (6). The approximation as in (II) is only valid for which is not longer fulfilled by the given experimental circumstances with beam energies of some k eV and screening energies of several hundred eV . This also means that the supposition of a negligible screening enhancement at is not valid either. Moreover, the term (13) diverges for energies approaching zero. While the invalid approximation leads to an underestimation of the derived screening energy the neglect of the enhancement at effectuates a gross exaggeration because the curvature of the enhancement curve must be greater in order to describe the steeper slope of the data (analog to the difference in the curves #1 and #2 in (Huke et al., 2007, Fig. 12)). The inclusion of measurements taken at higher energies would have revealed such. The deuteron density value obtained at ought be heavily altered, too. The target holder was cooled with LN2. The constancy (and thence concluded the homogeneity) of the density in the target was investigated by measurements at with target heating by different beam flux or a mounted heater in the case of Pd in the interval determined with a thermocouple. The results in (Kasagi et al., 2002, Fig. 1) show a strong dependency of the ’saturation’ density on the target temperature and material with a considerable general decrease with raising temperatures. The density descends from Ti over Au, Fe, Pd to PdO. Conspicuous are the differences in the deuteron densities between (Yuki et al., 1998) and (Kasagi et al., 2002) for Ti, Au and Pd which are almost one order of magnitude while the corresponding screening values accord within their errors (Fig. 11) though the latter are generally higher. This discrepancy remains unexplained in (Kasagi et al., 2002). While Au and Fe do not build up firm bonds to hydrogen the achieved densities are proportionally higher at these deep temperatures. A deliberately produced thick PdO layer on a Pd target in (Kasagi et al., 2002) yielded an especially high screening energy with an especially low density. Such a thick PdO layer would show quick shifts in the deuteron density profiles with higher averaged densities at lower projectile energies like in the second case in (Huke et al., 2007, Fig. 13.(b-d)), Fig. 6(b) when changing the projectile energy and using the differential analysis method. So this large screening is simulated by the density alteration during the total yield measurement. Whereas the density in the Pd target of (Kasagi et al., 2002) is noticeably low which points on the formation of an oxide layer distinctly thicker than on the Ti target approaching the PdO target. This means that the screening value is also rather generated by density dynamics and the agreement with our value is by chance. Albeit our Pd value was obtained from measurements with a limited total ion dose and still growing densities prior to saturation in order to minimize surface contaminations the highest density of all experiments was achieved. While the targets as described in (Kasagi et al., 2002) are thick enough to guarantee an effective heat transport in the bulk of the material by the electron gas, the heterogeneous target Au/Pd/PdO with a total thickness of only (thereof Au) (Yuki et al., 1998) is too thin therefore leading to a considerable temperature increase in the beam stopping volume which is to this extent not detectable by any outside mounted thermocouple. So, the observed high screening energy of can be explained by the shifts in the density profile due to elevated temperatures like in Fig. 6(c), (Huke et al., 2007, Fig. 13.a) and the heterogeneity of the target and accordingly the density.
In order to explain the ascertained relation between the screening energy and the density depicted in (Kasagi et al., 2002, Fig. 4), i.e. high screening comes along with low deuteron densities, the concept of a deuteron ’fluidity’ was introduced in (Kasagi et al., 2002) where fluid deuterons and conduction electrons are to behave like a hot plasma. But in palladium oxide there are no conduction electrons. In view of the stated density dynamics this explanation is decrepit. The explanation by density dynamics is also sustained by the significantly larger standard deviations of the repeated density measurements at for targets with low densities in (Kasagi et al., 2002, Fig. 2). Indeed, the saturation density in our experiments returns to the same level for the same conditions but with higher deviations. In order to avoid the observed temperature changes of the deuteron densities in the targets the beam current was adapted in such a way that the power input into the target was kept constant. Although in (Kasagi et al., 2002) is admitted that this procedure does not keep constant the power density due to the stopping power relation the mobility of the deuterons is not only influenced by the indirect ambient temperature but also by direct ion interaction and changes in the distribution of the stopped projectile deuterons. The authors conceded that they were not able do detect possible short time changes in the proton counting rate. With our differential method we did not observe any discontinuity belonging to screening on oxidized targets with low absolute densities being independent of the actual beam current and power input. The trustiest screening value seems to be the result for Au in (Yuki et al., 1998) obtained at a high density which conforms to our test with a Au foil at a very low density yielding no enhanced screening. But under ion irradiation even noble metals can oxidize.
Postscript: Very recently the experiments have been continued using the same accelerator set-up, procedure, and analyzing method as above (Wang et al., 2007); consequently the same considerations apply. As before the target holder was cooled with LN2 further approaching the boiling temperature of nitrogen. For the Sm target a screening energy of was deduced 555The experiment was meant to sustain the temperature dependence of the inapplicable Debye model (Eq. 19), see next subsection thereto.. But not even an estimate for the deuteron density was given unlike in the previous puplications. The high statistical errors in (Wang et al., 2007, Fig. 5) and the vague statements regarding the deuteron ’fluidity’ obtrude the inference of a low density with the same consequences, too.
V.1.3 The Bochum Experiments
The largest data set of screening energies is provided by (Raiola et al., 2004; Bonomo et al., 2003; Raiola et al., 2002b). The applied experimental procedure and data analysis method explained in (Raiola et al., 2002a, b) is exactly the standard strategy in nuclear astrophysics as described in (Rolfs and Rodney, 1988) including measuring relative excitation functions with normalization to known cross sections. As such it is a step back behind (Yuki et al., 1998) where already concessions to the special situation of hydrogen in metals were made. Again just the total yield for the thick target of the measurement of the protons with 4 detectors at the polar lab-angle of at the energy was determined. The total yield was repeatedly taken at fixed energies with equal stepsizes of and for . Thereof an energy differentiated yield is calculated (14) in order to extract the cross section (V.1.3) (Raiola et al., 2002a, Eq. (5), (7), (8))666The symbol names granted by the authors have been changed for the sake of the uniformity of the notation and comparability.:
| (14) | |||||
The energy integration prior to (V.1.3) vanished by means of the mean value theorem of calculus leaving behind the integrand to be evaluated at the effective energy where one half of the yield is attained. Except for for all other factors in (V.1.3) is assumed that their change within the energy interval can be neglected. Moreover, the angular terms are collected in the factor which is supposed to be constant for the whole energy range of the measurement. is the solid angle of the detectors, its transformation to the CM-system and the angular distribution of the reaction yield. is there the stopping cross section, i.e. the energy loss per particle areal density and not the linear stopping power . The effective stopping cross section is assembled from the one for deuterium and the host metal (Raiola et al., 2002a, Eq. (9)):
| (16) |
with the metal atom fraction MxD. Thus, the dependence of the composition of the target is completely shuffled from the stopping factor into . Consequently, the deuteron density described by is forced to be fixed for all projectile energies, the range in the target and the whole measurement series on the target. For the determination of the absolute value of the cross section in (V.1.3) was scaled to a known cross section for gaseous deuterium (Greife et al., 1995) at . This means that the deduced uniform deuteron density for the whole measurement series is only dependent on the one value at and only there validated, at most. So this method is even less sensitive to changes of the density during the course of the experiment than (Yuki et al., 1998). Then the S-factor is calculated. The screening energy is obtained from another fit to the S-factor data with three parameters of the expression in the second line of (II) together with a linear S-factor function. Furthermore, additional error sources were introduced without need by sticking to the standard procedure: repeated yield differences at fixed energies, introduction of the effective energy, the stopping power coefficients, S-factor computation. The errors of the computed S-factors are said to be dominated by the spread in the yields from various runs ((Raiola et al., 2002a, Sec. 4, p. 380), (Raiola et al., 2002b, Sec. 2, p. 195)), i.e. the yields were repeatedly measured with stepwise increasing and decreasing beam energies. (This implies that the errors from different -values are distinctly higher than the corresponding statistical errors, which can be seen in (Raiola et al., 2002b, 2004, Fig. 1).) As can be seen from the position and errorbars of the datapoints in (Raiola et al., 2002b, 2004, Fig. 1) the differences of the -values must be significant. It complies with our experience that the density profile returns to the same depth averaged value for the same surrounding conditions but with higher deviations at lower densities. The comparatively large errors relative to the number of the datapoints from the non-linear fit routine for the parameter reflect a significant correlation between the 3 fit parameters (as could have been read off the covariance matrix) and hence judging the capableness of the applied model.
From Fig. 11 one can recognize once again the conspicuous connection between the deuteron density and the screening energy like in the data of (Yuki et al., 1998; Kasagi et al., 2002). High densities are linked to low screening energies because of moderately thick metal oxide layers as in the third case of (Huke et al., 2007, Fig. 13.(e,f)), Fig. 6(a). Examples are the elements of the groups 3A (21Sc, 39Y and the lanthanoides ) and 4A (Ti, Zr and 72Hf) emphasizing the chemical kinship with regard to the described surface reactions in (Huke et al., 2007, Sec. 4.1), Sec. III. Low densities generate high screening energy findings due to shifts in the density profile either in thick metal oxide layers or materials with low hydrogen binding ability as in (Huke et al., 2007, Fig. 13.(a-d)), Fig. 6(b,c). Such can be recognized at the transition metals (groups 6A-8A: ) for example. It is argued in (Raiola et al., 2002b) that the large enhancement findings are most likely due to electron screening because the data could be fitted well with the screening parameter . In view of the dispersion of the data points in (Raiola et al., 2002b, 2004, Fig. 1) their functional progression can also be described with the target model of (Huke et al., 2007, Sec. 4.3). It implements a simple static stepfunction for the density profile. The model can mimic a exponential like increase towards low energies quite passable by an inhomogeneous density profile with a super-deuterated surface layer alone without screening enhancement, i.e. , (Huke et al., 2007, Fig. 10.c). A existing screening increase can also be largely exaggerated by the density profile of a deuterated zone in the metal with a limited thickness (Huke et al., 2007, Fig. 10.d). Those were only static density profiles. A density profile dynamically changing with the energy as vindicated by Fig. 6, (Huke et al., 2007, Fig. 13) could perfectly imitate the exponential-like screening enhancement given the data distribution. In contradistinction thereto our data does not allow for such a description as quantitatively demonstrated in (Huke et al., 2007, Sec. 5, Fig. 12). The Monte-Carlo code Srim for the simulation of ion stopping processes in matter was used in order to ratify the assumption of a homogeneous depth distribution of the deuterons over the range of the ions (Raiola et al., 2002a). But Srim does not take into account the ability of hydrogen to diffuse. The homogeneity assumption was experimentally reconfirmed by a subsequent off-line ERDA on a tandem accelerator with the outcome that the distribution is uniform within for ’most’ materials (Raiola et al., 2002b). Self-evidently a subsequent examination cannot detect dynamic changes but only the state of thermodynamic equilibration. Having been pointed to the problem of oxidation (Huke et al., 2003) RBS analysis was performed on the targets with the result that there were ’no detectable surface contaminations’ with the exception of Al where there was an Al2O3 layer with a thickness of about 150 monolayers (Bonomo et al., 2003; Raiola et al., 2004). Those findings prove that the resolution and sensitivity of the applied analysis techniques are too low; at least the passivation oxide layers from the unavoidable exposition to air with the used equipment should have been visible. For both ERDA and RBS it is valid that light projectile ions with a kinetic energy of some M eV cannot provide a wide energy spectrum of the ejectiles which would be necessary in order to resolve single atomic layers. Therefore a HIERDA with incident energies of the heavy ions in the order of magnitude would be required with sophisticated magnetic analyzing systems (e.g. (Hering, 1999)). This is additionally complicated by the circumstance that these methods deliver expressive results only if heterogeneous samples are made up of well defined layers. This is not fulfilled for the implantation targets with indistinct chemical composition and surfaces fractalized by embrittlement and beam deterioration (Fig. 4, (Huke et al., 2007, Fig. 8)). So the applied methods are not able to detect metal oxides with a thickness of a few tens monolayers (some nanometers), which is already sufficient to obliterate the screening enhancement (Sec. III, (Huke et al., 2007, Sec. 4.3)) while they are not thick enough to affect the applied density determination at significantly.
The thick oxide layer found on Al was defined to be of natural origin due to the said property of Al to readily oxidize on air. Hence a Kr ion sputtering treatment at or was applied prior to the implantation measurements in order to remove those natural metal oxide layers which is the main difference from (Raiola et al., 2002b) to (Bonomo et al., 2003) and (Raiola et al., 2004). This procedure does not take into account that the major cause of the oxidation is contributed by the water in HV systems under deuteron irradiation which keeps going on nevertheless. While the high sputter yield of the Kr ions may allow for a surface cleaning the large Kr atoms thoroughly destroy the crystal structure of the target and get trapped in the material fractalizing the surface and thus possibly even promoting the oxidation process under subsequent deuteron irradiation since the necessary annealing step is omitted. The deviations in the screening energies between (Raiola et al., 2002b), (Bonomo et al., 2003) and (Raiola et al., 2004) are in both directions, anyhow giving an indication for the magnitude of the true error in the determination of the screening energies in this way similar to our experiments on Ta (Fig. 5). Whether the increase or decrease of the screening finding comes from an increase or decrease of the thickness of the oxide layer, or low hydrogen binding ability of the metal, or a too thin overheated target foil can scarcely be told afterwards on the basis of the available information. But there are peculiarities. It becomes not clear which beam currents were used, i.e. 54, 5 or 2.4 µ A , and how they influence the stability and the inferred screening values. In (Raiola et al., 2002b) it was reported about instable yields dependent on the beam current for In and ’other elements with a low melting point’ 777In (Raiola et al., 2004) In has a very high screening value without explanation whether the problem has been solved or simply ignored, likewise the elements Bi, Tl, Zn which have a low melting point. The elements Rh, Re and Ir were measured with a beam current of in (Raiola et al., 2002b) resulting in high screening energies which decreased considerably in (Bonomo et al., 2003; Raiola et al., 2004). Re decreased from over to indicating a beam current dependence even though these elements have high melting points.. The elements of the group 1B (Cu, Ag, Au) had a small screening value in (Raiola et al., 2002b; Bonomo et al., 2003) complying to the gas target value which became large in (Raiola et al., 2004). That is in contradiction to the very low screening energy for Au of (Yuki et al., 1998) and our finding of no screening. The extraordinary high screening value for Pd does not change with the Kr sputtering but matches best to the PdO value of (Kasagi et al., 2002) which is another proof for the nevertheless continued oxidation process. Due to the moderately thick metal oxide layer and the stable deuteron density close to the stoichiometric ratio the metals of the groups 3A, 4A including the lanthanoides neither allow for a real screening observation nor a simulated screening by density dynamics in the experiment of (Raiola et al., 2004). In the coextensive publications (Raiola et al., 2005, 2006) these metals where heated to thus overcoming the chemical bond between the metal atoms and deuterium conveying it into segregation and leading to a density drop of two orders of magnitude, i.e. the case of (Huke et al., 2007, Fig. 13.(e,f)), Fig. 6(a) is transformed to (Huke et al., 2007, Fig. 13.(a-d)), Fig. 6(b,c). The than observed high screening energies again can be informally explained by the density dynamics due to the high mobility of the deuterons induced by the high temperature and conjectural promoted metal oxide layer formation. This is made clear at the example of Ti where five datapoints taken at different temperatures show the transition in (Raiola et al., 2005, 2006, Fig. 3). In (Bonomo et al., 2003) it was reported on difficulties in attaining stable reaction yields for Ta at high temperatures which was subsequently not further elucidated. The stability test for the density in (Raiola et al., 2005) is inapplicable since the used analysis method cannot recognize the short time changes of the density.
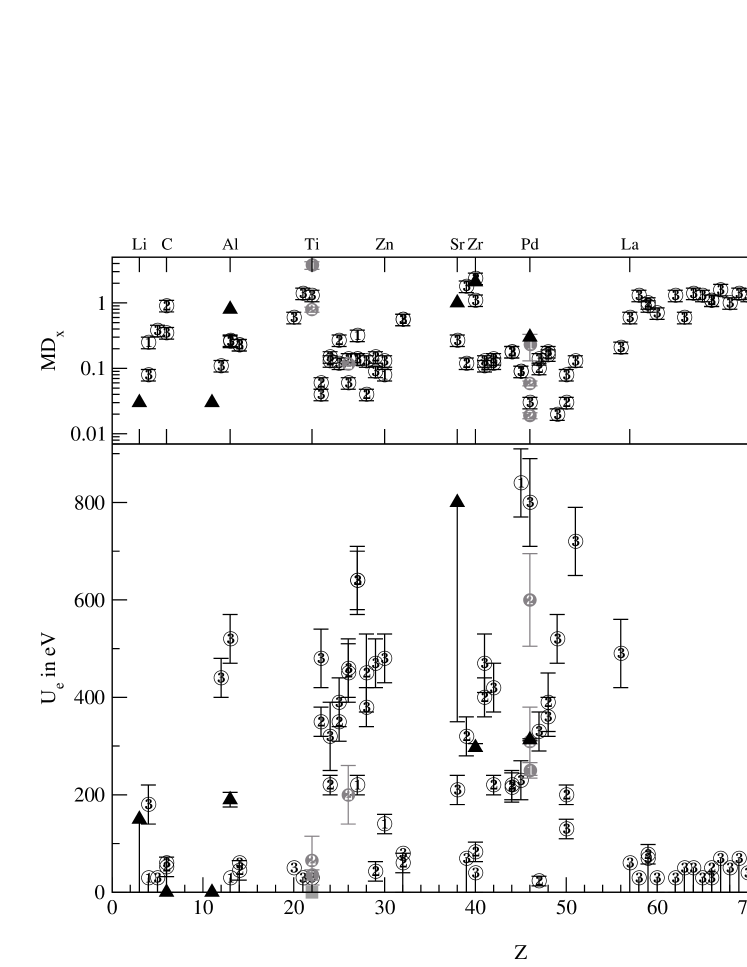
The intention of these comprising experiments was to find a connection between the observed screening energy and some electronic properties of the elements, something that is to be underscored since it is an important step towards the understanding of this phenomenon. The authors propose the Hall coefficient to be this quantity stating that the effective density of the free charge carriers, i.e. electrons and holes likewise, form a Debye sphere around the deuterons and thus generate the screening potential (Bonomo et al., 2003):
| (17) | |||||
| (18) | |||||
| (19) |
with the number density of the atoms the temperature of the free electron gas and the atomic number of the projectile. The classical Debye screening is, however, not applicable for low temperatures (electron energies below the Fermi energy) and dense plasmas (solid states) where the quantum mechanical effects dominate and the screening effect depends only on the charged particle density and not on the temperature (Salpeter, 1954; Czerski et al., 2006a, b). Additionally, the motion of the bound electrons simulating the hole is not free but governed by quantum mechanical tunneling between neighbor atoms. The fact that the screening energy is vanishing for high deuteron densities is explained by the assertion that these metal hydrides are insulators. This is not right for the majority of the metal hydrides which are metallicly or covalently bound and retain their metallic properties. In fact, the electrons of the hydrogen are added to the conduction band of the metal. The Baranowsky-curve of the electric resistance of metal hydrides shows that the resistance at the chemical stoichiometric ratio is even lower than for somewhat lower densities and comparable to the metal (Mueller et al., 1968). Using a 3He beam on a deuterated 78Pt target via the reaction d(3He,p)4He (Raiola et al., 2002b) a screening energy was inferred about twice as high ( at ) as for the d beam () which was regarded as a confirmation of the dependency (19) of the Debye hypothesis (Bonomo et al., 2003). In (Raiola et al., 2004) however the screening energies for 3He () and d beams () at Pt became equal without explanation. The inconsistency of the Pt-data also comprises the measurements (Raiola et al., 2005, 2006) for the verification of the temperatur dependence (19) of . With the exception of the room temperature data point the other four data points are equal within their error interval. So the temperature dependence is based on a single uncertain point. Furthermore, the findings for the metals of the groups 3A and 4A are in contradiction to it which cannot be resolved by the introduction of a highhanded function (Raiola et al., 2005, 2006, Eq. (4)).
In order to arrive at a more quantitative assessment of the hypotheses, methods of statistical data description and analysis can be applied (e.g. (Stahel, 2002)). Of the 58 examined elements in (Raiola et al., 2004, Table 1) the effective charge densities calculated from the Hall coefficient are selectively specified for the 25 elements with high screening values only, because the authors erroneously precondemned the others to be insulators with zero charge carriers. Effective charge densities for the elements In, Sn, Sb, Pb, Bi which do not fit in the explanation scheme were also omitted 888The Hall coefficients originate from (Hurd, 1972). In (Bonomo et al., 2003) the values for for Sn and Pb in Table 1 were left out on the grounds that they were unreasonably high (Table footnote ’f’). In (Raiola et al., 2004, Table 1) the values for In (), Sn (), Sb (), Pb (), Bi () were omitted without vindication (the values for Sb and Bi are much smaller than expected). Instead the Hall coefficient for Pd was remeasured with a better fitting result giving reason to doubt other values for the Hall coefficients. But no description of the measurement procedure was given.. It needs to be particularly pointed out that the authors impute themselves a flat error of 20% for the Hall coefficients but not the original experimental uncertainties. Both have severe impact on the interpretation.
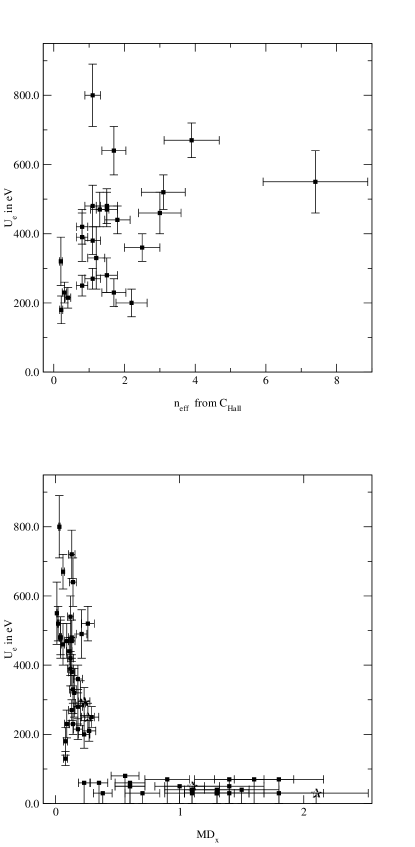
A visual survey based on Fig. 12 already shows that the distribution in the scatter plot for the case of is rather dispersed while the distribution for roughly indicates a hyperbolic connection. The temperature dependent data points for Ti (Raiola et al., 2005, 2006, Table 1) are additionally included in the bottom scatter plot (tagged with a star) demonstrating the transition from a high stable density to a low instable density allowing for the density dynamics which simulate the high screening findings. Three testing methods for continuous variables were used: Pearson’s linear correlation which assumes a linear association between the variables. The Spearman rank correlation measures the monotone association between the variables and is therefore invariant under monotone transformations. Kendall’s is even more nonparametric since it uses only the relative ordering of the ranks by counting the inversions in the paired data points. It also enables the easy inclusion of errors by adaptive binning. The latter both are robust in opposition to the linear correlation. All such tests attempt to falsify the null hypothesis of no correlation. Their correlation coefficient describes the strength of the correlation ranging in where 0 stands for no correlation and (-)1 for total (anti)correlation. Complementary the -value determines the significance of the obtained correlation, the lower the higher is the significance. The results are in tendency congruent wherefore representatives from the Spearman rank correlation are listed in Table 2.
| No.111Data of (Raiola et al., 2004, Table 1). | correl. | -value | |
|---|---|---|---|
| 1 | 0.0130 | ||
| 2 | 5.1404 | ||
| 3222Including (Raiola et al., 2005, 2006, Table 1). | 0.0768 | ||
| 4333Including (Raiola et al., 2005, 2006, Table 1) and for the omitted elements. | 0.4171 | ||
| 5444Additional consideration of the sign of the Hall coefficient. | 0.9096 | ||
| 6222Including (Raiola et al., 2005, 2006, Table 1). | 2.3602 |
The assumed functional dependency in (19) is tested on the restricted data set (Raiola et al., 2004, Table 1) (#1); the correlation coefficient is below with a low significance. In contradistinction thereto the correlation to the density has considerably higher values with utmost strong significances (#2). Including the temperature dependent data (Raiola et al., 2005, 2006, Table 1) into the calculations leads to a considerable decrease in the correlation coefficient (#3) which is further reduced when for the omitted elements In, Sn, Sb, Pb, Bi is regarded (#4), with a concurrent decrease in the significance. The consideration of the sign of the Hall coefficient lets the correlation approach zero (#5). On the other hand the enlarged data set has only slight impact on the correlation to (#6). Logarithmizing (19) leads to a linear model with a slope of and a positive intercept containing the other quantities. Regression attempts based on it are listed in Table 3, is here the corresponding standard error of the two parameters.
| No.111Data of (Raiola et al., 2004, Table 1). | -value | |||||
|---|---|---|---|---|---|---|
| 1 | 5.87 | 0.41 | 0.03 | 0.04 | 1.99 | |
| 2222 | 5.91 | 0.34 | 0.03 | 0.04 | 5.01 | |
| 3333Including (Raiola et al., 2005, 2006, Table 1) and for the omitted elements. | 6.03 | -0.02 | 0.02 | 0.01 | 1.50 |
The influence of the error can be seen in comparison of #1 and #2, where #1 has the willfully by the authors imputed error of 20% while #2 adopts a more realistic value of 10% in contrast. Anyway, the resulting slopes definitely stay behind the necessary value of . Making worse the -value which is the goodness of the fit remains tiny. Conventionally if the goodness is smaller than the model is considered incorrect or the errors are still roughly underestimated. Here (#3) the inclusion of the temperature dependent data (Raiola et al., 2005, 2006, Table 1) and for the omitted elements In, Sn, Sb, Pb, Bi into the calculations leads to a slope close to zero and a goodness disqualifying the linear model. The value of the Hall coefficient of Pd was doubted in (Raiola et al., 2004) and replaced by an own measurement with minor impact. So in both instances, correlation and regression, the explanation by the Debye hypothesis is ruled out. The disaffirmation of the Debye hypothesis on basis of the correlation tests alone might be disputable, together with the other aforementioned points it is decrepeted. The density hypothesis as an alternative clearly could not be falsified. Complemented by the preceding argumentation and the physico-chemical effects as described in (Huke et al., 2007, Sec. 4, 6)and Sec. III the deuteron density dynamics provide the explanation for the alleged screening results. Thus the assumptions for reactions with heavier nuclei and radioactive decay are refuted as well with the consequence that any experimental evidence offered for them need to come under scrutiny, Sec. V.2, V.3.
V.2 Experiments with heavier nuclei
As a consequence of Sec. V.1 the erratic high screening findings of the other groups cannot really serve as a confirmation of our results. Therefore the experiments on Li target nuclei achieve special significance as a independent reassurance for the overall effect of the enhancement of nuclear reactions in metallic environments. With regard to the reliability the most outstanding result discussed in Sec. V is from the experiment d+Li in binary alloys with Pd and Au (Kasagi et al., 2004). The -yield from the reactions at 6,7Li (natural abundance: 7.42% 6Li, 92.58% 7Li) in both alloys was observed normalized to the yield at in complete analogy to the procedure for the d+d reaction (Yuki et al., 1998; Kasagi et al., 2002) and set in relation to LiF targets. The inferred screening energies are for PdLix and for AuLix, where was initially at 5-10% for the alloys. The screening energy for PdLix is therewith one order of magnitude higher than our value of for 6LiF which is in agreement with the simple theory (Czerski et al., 1997). The latter screening energy is substantially smaller than the from (Engstler et al., 1992). This is because a significant share of the increase of the observed S-factor towards low energies is caused by a subthreshold resonance at . It needs to be included in the data analysis by sophisticated nuclear reaction theoretical calculations (Czerski et al., 1997; Ruprecht et al., 2004). The advantage of this experiment on Li targets over deuterium is that the small hydrogen atoms have a mobility in metals which is several orders of magnitude greater than other atom species. Thus, different to the auto implanted deuterium targets there is no such fatal target atom density dynamics possible as in (Huke et al., 2007, Fig. 13.(a-d)), Fig. 6(b,c). The also here inevitable oxidation process will only decrease – but not completely supplant – the Li fraction in the surface layers. This explains together with the higher sputtering yield for light atoms the observed asymptotic bisection of the yield with the ion dose (Kasagi et al., 2004, Fig. 2) at the monitor energy of . Both leads to an inhomogeneous depth distribution of the Li target atoms with a lower Li fraction at the surface and due to the higher beam energies with lower impact. So this time the observed enhancement can be regarded as a lower limit, too. Whereas the inferred value of the screening energy needs to be corrected for the influence of the subthreshold resonance and the same questions regarding the screening energy calculation of the authors apply as in the case of deuterium. The low value for AuLix is so far in conformity with the negative findings for the d+d reaction in Au (Raiola et al., 2002b; Bonomo et al., 2003; Yuki et al., 1998; Kasagi et al., 2002). A similar experiment (Cruz et al., 2005) was later performed using the proton induced reactions on 6,7Li in an environment of Li2WO4, Li-metal and PdLix (). The results for the screening energies of the reaction 7Li(p,) are for Li2WO4, for the metal and for PdLi1% which were obtained using standard procedures (14), (V.1.3), (Raiola et al., 2002a; Rolfs and Rodney, 1988). The results for LiPd0.01% and the reaction 6Li(p,)3He agree within . In a microscopic view it is universally valid that the screening effect depends on the impact of the electronic configuration of the environment on the Coulomb barrier of the entrance channel only (e.g. (Shoppa et al., 1993, 1996)), i.e. the pure Coulomb energy is modified by a Yukawa factor for simplicity with being the screening length. As such the inferred screening energy is merely the second term in a Taylor-expansion of , i.e. , and a coarse mathematical parametrization in the simple model (Assenbaum et al., 1987), (II), (Huke et al., 2007, Eq. (20)). The screening modification of the Coulomb potential only acts as if the projectile gained . So there is no ’acceleration mechanism’ in reality and one must neither decompose the screening effect nor transfer the result of one environment to another as in (Cruz et al., 2005) where the ’atomic’ screening energy for 7LiH2 is used as a linear addend in the screening energy for p(Li-metal or PdLix). Consequently, the screening energy is independent of the isotopes in the reaction and should be equal for 1,2H+6,7Li in (Kasagi et al., 2004) and (Cruz et al., 2005). Whereas there are two discrepancies between (Cruz et al., 2005) and (Kasagi et al., 2004): First, the more than twice as high screening energy for PdLix of (Cruz et al., 2005) relative to (Kasagi et al., 2004). But 4 of the 7 datapoints lay offside the fitted curve and only the fit error is given for (Cruz et al., 2005, Fig. 1,2). Second the assertion in (Cruz et al., 2005) that the yield remained stable better than 10% while (Kasagi et al., 2004) observed a bisection of the yield at which is plausible due to irradiation effects. Both discrepancies can be explained by the different target fabrication techniques. In (Kasagi et al., 2004) Pd and Li are made into an alloy by arc melting while in (Cruz et al., 2005) Li was inserted in a Pd-disk in a plasma discharge. The latter is prone to depth inhomogeneities. This was verified by a NRA analysis of the target using the resonance with a width of in the reaction 7Li(,)11B yielding the ascertainment of a homogeneous depth distribution (Cruz et al., 2005). However, the depth resolution of this method is limited by the energy uncertainty and spread of the beam and the width of the resonance. The most prominent example of the NRA is the resonance with a width of in the 1H(15N,)12C for the investigation of hydrogen distributions. It has a minimal resolution ranging (Schatz and Weidinger, 1992). So the resolution of the Li-NRA is worse given a 2.2 times higher width of the resonance. Since most of the yield is contributed by the topmost atomic layers here too ((Huke et al., 2007, Sec. 4.3, Fig. 10.d)), an enlarged Li contents below the NRA-resolution at the surface would explain the more than two times higher screening energy and the much lower decrease of the yield with the ion dose. The high screening value for PdLix was regarded as a confirmation for the Debye model. If this was true the measurements for AuLix (Kasagi et al., 2004) should also have yielded a high value and not one close to zero, since the d+d screening energy for Au of (Raiola et al., 2004) was about in difference to (Raiola et al., 2002b; Bonomo et al., 2003; Yuki et al., 1998; Kasagi et al., 2002) and our observation.
The theoretical model of the electron screening presented in Sec. IV.2 predicts different screening energies for different target material environments. In the case of an insulator the electron screening should reach the value of , which results only from the gain of the electron binding energies. For metallic environments the contribution coming from free electrons has to be included additionally. Due to different electron densities for Pd () and Li () the free electron contributions to the screening energy is equal to and , respectively. Thus, we finally expect total screening energies of for an insulating target material, for metallic Lithium targets and for the PdLix alloy. Experimental results, despite large uncertainties, confirm different electron screening energies for insulating and metallic materials with various electron densities.
Extending this thread, a first effort was undertaken in (Kettner et al., 2006) to study the environmental influence for heavy nuclei using the (p,n) reaction on 50V and 176Lu nuclei in an oxide, as pure metal, and as an alloy with Pd in the energy range . Because of insufficient cross section data the screening energies were obtained by comparison with the metal oxides VO2 and Lu2O3. The inferred screening energies are and for V and PdV10% and and for Lu and PdLu10%. The comparison was done by taking the ratio of the yields between the metal and the oxide alias the insulator
| (20) |
where is the efficiency of the neutron detector. It is now assumed that the ratio of the stopping cross sections between the two materials can be expressed by an energy independent constant which is mathematically doubtful considering Bragg’s rule (Bragg, 1905). So the following substitutions where done and with the enhancement factor as in (II) with the presupposition of a constant . The ratio of the integrals is further simplified by the energy differentiation of the yields using the effective energy as in (14), (V.1.3) (Raiola et al., 2002a, Eq. (5), (7), (8)) arriving at . The screening energy resulted together with from a fit to the yield ratios. This procedure was, however, only applied to V. The screening energies for Lu were gathered from the shift of the Lewis peak along the energy axis between the different targets originating from a narrow resonance close to (Kettner et al., 2006, Fig. 3). The Lewis effect comes from the discrete energy loss of the projectiles in the target (Lewis, 1962). This energy shift was indeed erroneously interpreted as the screening energy. As already pointed out the screening effect is merely a modification of the Coulomb barrier and no real energy shift. So this shift can not originate from the screening effect. Thus, it is probable that the energy shift is caused by target properties. Strikingly the oxide targets being the normalization standard are made by pressing a metal oxide powder into a cylindrical hole of a Cu disk. It is well known from powder metallurgy and silicate technology that pressing of a powder like in this case is insufficient in order to remove the hollow spaces between the powder particles unless a sintering step is performed. So the used metal oxide targets contain hollow spaces with a size of the same order of magnitude as the powder particles. Consequently the stopping of M eV protons is heavily altered in comparison to a monolithic metal oxide ceramic and different in its mathematical description to (Anderson and Ziegler, 1977). We observed effects of porous targets on the stopping (Huke et al., 2006, Fig. 2). So the shift of the lewis peak can be explained by the differences of the stopping between the porous metal oxide target and the metal targets. Additionally, it is well known that the position and form of the Lewis peak depends very critically on the composition, homogeneity and contamination of the target (Lewis, 1962; Walters et al., 1961; Donhowe et al., 1967) also (Rolfs and Rodney, 1988). This in turn casts serious doubts on the results for V. A critical point of the data analysis (20) is the presupposition that the ratio of the stopping cross sections of the metal oxide and the metal is a constant over the energy. This is inappropriate for the porous target and can lead to a misinterpretation of the data. The conspicuously high errors of the screening and values from the fit — about 33% making the effect compatible with zero within — are a strong indication for a high correlation between the two fit parameters showing the improperness of the fit model. The covariance matrix of the fit parameters could have given information about this.
From the theoretical point of view the large screening energies obtained for the d+d reactions at energies below cannot be used for the estimation of the screening energies in the above case since the proton energy is much higher and does not fulfill the adiabatic approximation. Since the surrounding electrons are much slower than the protons, the resulting screening energy obeys rather assumptions of the sudden approximation and thus should be of order of a few k eV in contradiction to statements involved in (Cruz et al., 2005; Kettner et al., 2006).
V.3 Radioactive decay of embedded nuclei
As the electron screening enhances the cross section at low impact energies, a similar effect can be expected for the radioactive decay. However, since the energies of the decay products are fixed by the Q value, only a few nuclei with lowest-energy emitters are candidates for a measurable change in the lifetime. In general, for positive charged ejectiles ( and decay), screening reduces the Coulomb barrier and therefore enhances the decay rate while the opposite is true for decay. As recently pointed out by Zinner (Zinner, 2007) the effect of a changed Coulomb barrier is partially canceled by a modified Q value that stems from the extension of the screened potential into the inner part of the nucleus. For heavy nuclei the effect can still be strong as the screening potential scales approximately with the product of the charge number of the end nuclei.
Recently, based on an extrapolation of the Debye-Hückel electron screening model to low temperatures, it has been suggested that half-lives of radioactive isotopes may change by orders of magnitude if they are embedded in a metal lattice and cooled to cryogenic temperatures (Ball, 2006; Muir, 2006; Rolfs, 2006; Kettner et al., 2006; Raiola et al., 2005) 999This effect has also been proposed as a new method of disposing radioactive waste from nuclear power plants (Ball, 2006; Muir, 2006; Rolfs, 2006).. In support of these predictions, a series of measurements has been published the results of which are listed in the table 4, together with the half-life changes predicted by the Debye-Hückel model.
| Ref. | nuclide | decay mode | host | prediction | measurement |
|---|---|---|---|---|---|
| (Limata et al., 2006) | 22Na | 90% | Pd | 11% | ()% |
| (Spillane et al., 2007) | 198Au | 100% | Au | -34% | (-)% |
| (Raiola et al., 2007) | 210Po | 100% | Cu | 3300% | ()% |
The striking disagreement with the predictions have been attributed to an oxygen layer build-up on the metal surface leading to an insufficient implantation of the radioisotope 101010Publications concerning a change in 7Be lifetime are not taken into account as 7Be decays via capture of s-wave electrons which is not influenced by electron screening..
A recently published measurement (Ruprecht et al., 2008a, b) where 22Na was activated in Al (and therefore deeply implanted) clearly shows a zero effect on a level of 0.04%, again in striking disagreement to the results by (Limata et al., 2006) with a reported lifetime change of (see table 4). No description has been given in (Limata et al., 2006) how the data have been analyzed. If the 511-keV annihilation line has been included in the analysis, the results are certainly not correct (see (Canter et al., 1974)). For the decay, even the observed 6% (Raiola et al., 2007) change is surprising as embedding radioactive nuclei in metals and cooling the samples to cryogenic temperatures is a routine procedure in low temperature nuclear orientation (LTNO) experiments since several decades 111111It should be noted that polonium is known to be very movable in metals (Zastawny et al., 1992), therefore an alteration of the measured activity could be due to changes in the polonium distribution.. Stone et al. (Stone et al., 2006) studied in detail the expected effect w.r.t. decay on complete decay chains starting with 224Rn, 225Ra, and 227Ac and compared it with available LTNO data. None of those data indicate any change of the lifetime of any of the nuclei involved when they are implanted into Iron, neither at room temperature nor when cooled to 20 millikelvin. The same applies for active nuclei in multiple host metals, see (Stone et al., 2006) and references therein. The precision of these measurements is typically 1% and less. Another follow-up measurement performed at ISOLDE/CERN (Jeppesen et al., 2007) focused on a possible change of the 221Fr ( decay) half-life when embedded in a metal and an insulator; there is also no clear effect (50% error) on a level of 0.3%. Severijns et al. (Severijns et al., 2007) investigated the decay of 253Es in Fe between 4 K and 50 mK and could not observe any effect on a level of 2%. Finally, also the decay of 198Au embedded in Au and Al-Au has been measured independently by three different groups (Goodwin et al., 2007; Kumar et al., 2008; Ruprecht et al., 2008b), and no lifetime change could be observed on a sub-percent level when the sample was cooled to 10 K. The latest result (Ruprecht et al., 2008b) was measured with a 30 times better error but the same conditions as in (Spillane et al., 2007).
In conclusion, all the follow-up measurements are in agreement with the theoretical expectations presented already in Sec. IV.2. The Debye-Hückel screening can be applied only for temperatures higher than the Fermi temperature being typically , far above the evaporation temperature of metals. For lower temperatures one should not observe any temperature dependence of the screening energy.
However, another effect can be expected (Czerski et al., 2006b): a change of the lifetime by just embedding the unstable nuclei into a metal, but this requires an absolute measurement of the lifetime and therefore much more experimental effort. A re-analysis of past lifetime measurements data with respect to the chemical composition could also reveal such a dependence. For instance, the lifetime of 238U has been determined with electroplated samples (metallic uranium), with U3O8, and other compounds, see (Schön et al., 2004; Jaffey et al., 1971). Although the measurements scatter by 1-2%, no systematic enhancement of the decay rate can be seen for the metallic uranium. As can be seen from the aforementioned CERN measurement (Jeppesen et al., 2007) the effect will be small anyway even for high screening values but an evidence would be a great contribution to a better understanding of the screening mechanism from a very different approach.
VI Conclusion
We presented some new experimental electron screening energies for d+d reactions taking place in different target material environments. We applied a differential data analysis method which gains the maximum information from the raw data. The method is independent of the unprecise stopping power coefficients and the actual absolute value of the deuteron number density in the targets. It enables the on-line monitoring of the deuteron densities and the observation of short time deuteron density profile changes. Thus, it allows for the recognition and rejection of measurements with unwanted shifts in the density depth distribution profile. Therefore, it adequately considers the special situation of potentially highly mobile hydrogen in solid states where neither a homogeneous nor a stable density distribution can be presupposed any longer. The problem of the density dynamics is entangled with the effects from the actual target composition, i.e. the undesirable density profile changes occur in targets with low hydrogen binding ability, like many of the transition metals, at elevated temperatures and heterogeneous targets with metal oxide or carbon layers or different (relatively) thin metal layers. The formation of metal oxide layers is inevitable in common high vacuum systems used in experimental nuclear physics while the other unpropitious environments were produced deliberately. Thorough investigation of the contamination layer formation showed their momentousness and assured together with the differential analysis method that our screening energy values ranging between represent lower limits. In addition the alteration of the inferred screening energies due to layer formation under beam irradiation depends on many parameters. Logically it makes no sense to measure larger portions of the periodic table since any observed material dependence results from differences in the chemical reactivity and related physico-chemical properties for the contamination layer formation, unless this problem is reliably solved. Different to the other two groups our high screening energy results were achieved at high densities in the proximity of the chemical stoichiometric ratio clearly without evidence for short time density profile shifts. Whereas the high screening results of the other groups were exclusively attained at low densities yielded from the customary analysis of the total yields of the measurements which is blind for the then happening density dynamics. The target diagnosis methods are unusable because of their too bad resolution and off-line application. So the inferred screening energies are conjecturally simulated by the density dynamics. Utilization of explorative statistics to the data sets including the temperature measurements sustains this explanation while on the other hand the Debye-Hückel hypothesis is clearly falsified. It is likewise falsified from the theoretical side since calculations performed within an improved dielectric function theory predict only a weak material dependence of on the valence electron density. The quantitative scale of the phenomenon is not yet understood, since our analytical model still fails to describe the values by at least a factor of 2. So further unidentified effects play a role. Consequently any conclusion based on the alleged material dependence of the inferred screening energies is premature. For it the precise determination of the screening energies is demandable which is only feasible in an ultra high vacuum system with pressures well below , where only hydrogen and noble gases are in the residual gas, and equipped with in-situ target diagnosis techniques. We performed the first measurements under UHV conditions, whose results confirm the previous measurements and the framework of surface physics and chemical effects (Czerski et al., 2008).
Nuclear reactions with heavier nuclei embedded in metallic environments gave evidence for an alike enhanced screening effect. However, there are analogue problems. The results for deuterated metals with 3He projectiles are contradictory, most probably due to deuteron dynamics. The data for Li nuclei are partially conflicting between the Tohoku and the Bochum group, which used different target preparation techniques, and can be attributed to inhomogeneous densities and inadequate diagnosis techniques as well. The results, however, confirm theoretical predictions based on the dielectric function theory concerning the free electron density of the target material. The screening energy data for the heavier nuclei V and Lu were obtained from a comparison between a metal and a metal oxide powder target ignoring the hollow spaces in the powder and its strong influences on beam stopping, thus disabling conclusions.
As discussed, the predictions of the Debye-Hückel hypothesis given by the Bochum group for the temperature dependence of the radioactive decay of embedded nuclei could not be verified by their own experiments; the measured values are orders of magnitude below their predictions. Moreover, their experimental results are in contradiction to all other experiments, in particular the LTNO measurements of the past 30 years. A material dependence is conceivable though a small effect. Otherwise it would have been already discovered given that nuclei of importance for nuclear technology have been investigated in multiple chemical compounds including pure metals for decades.
References
- Salpeter (1954) E. E. Salpeter, Aust. J. Phys. 7, 373 (1954).
- Assenbaum et al. (1987) H. J. Assenbaum, K. Langanke, and C. Rolfs, Z. Phys.A 327, 461 (1987).
- Rolfs and Somorjai (1995) C. Rolfs and E. Somorjai, Nucl. Instrum. Methods B, 297 (1995).
- Czerski et al. (1998) K. Czerski, A. Huke, P. Heide, M. Hoeft, and G. Ruprecht, in Nuclei in the Cosmos V, edited by N. Prantzos and S. Harissopulos (Editions Frontières, Volos, Greece, 1998), Proceedings of the International Symposium on Nuclear Astrophysics, p. 152.
- Czerski et al. (2001) K. Czerski, A. Huke, A. Biller, P. Heide, M. Hoeft, and G. Ruprecht, Europhys. Lett. 54, 449 (2001).
- Huke (2002) A. Huke, Ph.D. thesis, Technische Universität Berlin (2002), URL http://edocs.tu-berlin.de/diss/2002/huke_armin.htm.
- Greife et al. (1995) U. Greife, F. Gorris, M. Junker, C. Rolfs, and D. Zahnow, Z. Phys. A 351, 107 (1995).
- Ichimaru (1993) S. Ichimaru, Rev. Mod. Phys. 65, 252 (1993).
- Yuki et al. (1998) H. Yuki, J. Kasagi, A. G. Lipson, T. Ohtsuki, T. Baba, T. Noda, B. F. Lyakhov, and N. Asami, JETP Lett. 68, 823 (1998).
- Kasagi et al. (2002) J. Kasagi, H. Yuki, T. Baba, T. Noda, T. Ohtsuki, and A. G. Lipson, J. Phys. Soc. Jpn. 71, 2881 (2002).
- Raiola et al. (2002a) F. Raiola et al., Eur. Phys. J. A 13, 377 (2002a).
- Raiola et al. (2002b) F. Raiola et al., Phys. Lett. B 547, 193 (2002b).
- Bonomo et al. (2003) C. Bonomo et al., Nucl. Phys. A 719, 37c (2003).
- Raiola et al. (2004) F. Raiola et al., Eur. Phys. J. A 19, 283 (2004).
- Czerski et al. (2006a) K. Czerski, A. Huke, P. Heide, and G. Ruprecht, Eur. Phys. J. A 27, 83 (2006a).
- Huke et al. (2007) A. Huke, K. Czerski, and P. Heide, Nucl. Instr. Meth. B 256, 599 (2007), eprint nucl-ex/0701065.
- Huke et al. (2008) A. Huke, K. Czerski, S. M. Chun, A. Biller, and P. Heide, Eur. Phys. J. A 35, 243 (2008), eprint arXiv:0803.1071 [nucl-th].
- Czerski et al. (2004) K. Czerski, A. Huke, P. Heide, and G. Ruprecht, Europhys. Lett. 68, 363 (2004).
- Kasagi et al. (2004) J. Kasagi, H. Yuki, T. Baba, T. Noda, J. Taguchi, M. Shimokawa, and W. Galster, J. Phys. Soc. Jpn. 73, 608 (2004).
- Cruz et al. (2005) J. Cruz et al., Phys. Lett. B 624, 181 (2005).
- Kettner et al. (2006) K. U. Kettner, H. W. Becker, F. Strieder, and C. Rolfs, J. Phys. G 32, 489 (2006).
- Limata et al. (2006) B. Limata, F. Raiola, B. Wang, S. Yan, H. W. Becker, A. D’Onofrio, L. Gialanella, V. Roca, C. Rolfs, M. Romano, et al., Eur. Phys. J. A 28, 251 (2006).
- Rolfs (2006) C. Rolfs, Nuclear Physics News 16, 9 (2006), URL http://www.nupecc.org/npn/npn162.pdf.
- Ruprecht et al. (2006) G. Ruprecht, L. Buchmann, D. Hutcheon, D. Ottewell, C. Ruiz, P. Walden, C. Vockenhuber, and K. Czerski, in Nuclei in the Cosmos IX (Proc. Sci., 2006), vol. PoS(NIC-IX)171 of Proceedings of the International Symposium on Nuclear Astrophysics.
- Raiola et al. (2005) F. Raiola et al., J. Phys. G 31, 1141 (2005).
- Raiola et al. (2006) F. Raiola et al., Eur. Phys. J. A 27, 79 (2006).
- Ball (2006) P. Ball, Nature News (2006), doi:10.1038/news060731-13.
- Muir (2006) H. Muir, New Scientist 2574, 36 (2006).
- (29) C. Rolfs, as quoted in Frankfurter Allgemeine Zeitung 13.8.2006, p. 56.
- Anderson and Ziegler (1977) H. Anderson and J. F. Ziegler, The Stopping and Ranges of Ions in Matter, vol. 3 (Pergamon Press, New York, 1977).
- Brown and Jarmie (1990) R. E. Brown and N. Jarmie, Phys. Rev. C 41, 1391 (1990).
- Møller et al. (2004) S. P. Møller, A. Csete, T. Ichioka, H. Knudsen, U. I. Uggerhøj, and H. H. Andersen, Phys. Rev. Lett. 93, 042502 (2004).
- Mueller et al. (1968) W. M. Mueller, J. P. Blackledge, and G. G. Libowitz, eds., Metal Hydrides (Academic Press, New York, London, 1968).
- Ensinger (1997) W. Ensinger, Nucl. Instr. Meth. B, 796 (1997).
- Kamke (1956) D. Kamke, Handbuch der Physik (Springer Verlag, Berlin, 1956), vol. XXXIII, chap. 1. Elektronen- und Ionenquelle.
- Hering (1999) W. T. Hering, Angewandte Kernphysik (B. G. Teubner, Stuttgart, Leipzig, 1999).
- Huke et al. (2006) A. Huke, K. Czerski, T. Dorsch, A. Biller, P. Heide, and G. Ruprecht, Eur. Phys. J. A 27, 187 (2006).
- Grosso and Parravicini (2000) G. Grosso and G. P. Parravicini, Solid State Physics (Academic Press, 2000).
- Ziegler et al. (1985) J. F. Ziegler, J. P. Biersack, and U. Littmark, The Stopping and Ranges of Ions in Matter (Pergamon Press, New York, 1985).
- Czerski et al. (2006b) K. Czerski, P. Heide, A. Huke, L. Martin, and G. Ruprecht, in Nuclei in the Cosmos IX (Proc. Sci., 2006b), vol. PoS(NIC-IX)044 of Proceedings of the International Symposium on Nuclear Astrophysics.
- Lifschitz and Arista (1998) A. Lifschitz and N. Arista, Phys. Rev. A 57, 200 (1998).
- Roth et al. (1990) J. Roth, R. Behrisch, W. M ller, and W. Ottenberger, Nuclear Fusion 30, 441 (1990).
- Bosch and Hale (1992) H. S. Bosch and G. M. Hale, Nucl. Fusion 32, 611 (1992).
- Wang et al. (2007) T. S. Wang, Z. Yang, H. Yunemura, A. Nakagawa, H. Y. Lv, J. Y. Chen, S. J. Liu, and J. Kasagi, J. Phys. G 34, 2255 (2007).
- Rolfs and Rodney (1988) C. E. Rolfs and W. S. Rodney, Cauldrons in the Cosmos, Theoretical Astrophysics (The University of Chicago Press, Chicago and London, 1988).
- Huke et al. (2003) A. Huke, K. Czerski, and P. Heide, Nucl. Phys. A 719, 279c (2003).
- Stahel (2002) W. Stahel, Statistische Datenanalyse (Vieweg, Braunschweig, Wiesbaden, 2002), 4th ed.
- Czerski et al. (1997) K. Czerski, A. Huke, H. Bucka, P. Heide, G. Ruprecht, and B. Unrau, Phys. Rev. C 55, 1517 (1997).
- Engstler et al. (1992) S. Engstler, G. Raimann, C. Angulo, U. Greife, C. Rolfs, U. Schr der, E. Somorjai, B. Kirch, and K. Langanke, Phys. Lett. B 279, 20 (1992).
- Ruprecht et al. (2004) G. Ruprecht, K. Czerski, D. Bemmerer, M. Hoeft, and P. Heide, Phys. Rev. C 70, 025803 (2004).
- Shoppa et al. (1993) T. D. Shoppa, S. E. Koonin, K. Langanke, and R. Seki, Phys. Rev. C 48, 837 (1993).
- Shoppa et al. (1996) T. D. Shoppa, M. Jeng, S. E. Koonin, K. Langanke, and R. Seki, Nucl. Phys. A 605, 387 (1996).
- Schatz and Weidinger (1992) G. Schatz and A. Weidinger, Nukleare Festk rperphysik (B. G. Teubner, Stuttgart, 1992), 2nd ed.
- Bragg (1905) R. Bragg, Phil. Mag. p. 318 (1905).
- Lewis (1962) H. W. Lewis, Phys. Rev. 125, 937 (1962).
- Walters et al. (1961) W. L. Walters, D. G. Costello, J. G. Skofronick, D. W. Palmer, W. E. Kane, and R. G. Herb, Phys. Rev. Lett. 7, 284 (1961).
- Donhowe et al. (1967) J. M. Donhowe, J. A. Ferry, W. G. Monrad, and R. G. Herb, Nucl. Phys. A 102, 383 (1967).
- Zinner (2007) N. T. Zinner, Nucl. Phys. A 781, 81 (2007), eprint nucl-th/0608049.
- Spillane et al. (2007) T. Spillane, F. Raiola, F. Zeng, H. W. Becker, L. Gialanella, K. Kettner, R. Kunze, C. Rolfs, M. Romano, D. Schürmann, et al., Eur. Phys. J. A 31, 203 (2007).
- Raiola et al. (2007) F. Raiola et al., Eur. Phys. J. A 32, 51 (2007).
- Ruprecht et al. (2008a) G. Ruprecht, C. Vockenhuber, C. Ruiz, L. Buchmann, J. Pearson, D. Ottewell, K. Czerski, and A. Huke, Journal of Physics G: Nuclear and Particle Physics 35, 014017 (4pp) (2008a), URL http://stacks.iop.org/0954-3899/35/014017.
- Ruprecht et al. (2008b) G. Ruprecht, C. Vockenhuber, L. Buchmann, R. Woods, C. Ruiz, S. Lapi, and D. Bemmerer, Phys. Rev. C (2008b), accepted.
- Canter et al. (1974) K. F. Canter, A. P. Mills, and S. Berko, Phys. Rev. Lett. 33, 7 (1974).
- Stone et al. (2006) N. J. Stone, J. R. Stone, M. Lindroos, P. Richards, M. Veskovic, and D. A. Williams, Nucl. Phys. A 793, 1 (2006), eprint nucl-ex/0611041.
- Jeppesen et al. (2007) H. B. Jeppesen, J. Byskov-Nielsen, P. Wright, J. G. Correia, L. M. Fraile, H. O. U. Fynbo, K. Johnston, and K. Riisager, Eur. Phys. J. A 32, 31 (2007).
- Severijns et al. (2007) N. Severijns, A. A. Belyaev, A. L. Erzinkyan, P.-D. Eversheim, V. T. Filimonov, V. V. Golovko, G. M. Gurevich, P. Herzog, I. S. Kraev, A. A. Lukhanin, et al., Physical Review C (Nuclear Physics) 76, 024304 (pages 4) (2007), URL http://link.aps.org/abstract/PRC/v76/e024304.
- Goodwin et al. (2007) J. R. Goodwin, V. V. Golovko, V. E. Iacob, and J. C. Hardy, Eur. Phys. J. A 34, 271 (2007).
- Kumar et al. (2008) V. Kumar, M. Hass, Y. Nir-El, G. Haquin, and Z. Yungreiss, Phys. Rev. C, rap. comm. (2008), accepted, eprint arXiv:0805.0024 [nucl-ex].
- Schön et al. (2004) R. Schön, G. Winkler, and W. Kutschera, Appl. Radiat. Isot. 60, 263 (2004).
- Jaffey et al. (1971) A. H. Jaffey, K. F. Flynn, L. E. Glendenin, W. C. Bentley, and A. M. Essling, Phys. Rev. C 4, 1889 (1971).
- Czerski et al. (2008) K. Czerski, A. Huke, L. Martin, N. Targosz, D. Blauth, A. G rska, P. Heide, and H. Winter, J. Phys. G 35, 014012 (2008).
- Zangwill (1988) A. Zangwill, Physics at surfaces (Cambridge University Press, Cambridge, 1988).
- Hurd (1972) C. M. Hurd, The Hall Effect in Metals and Alloys (Plenum Press, 1972).
- Zastawny et al. (1992) A. Zastawny et al., Appl. Radiat. Isot. 43, 1147 (1992).