On the Discovery of the GZK Cut-off.
Abstract
The recent claim of the ’5 sigma’ observation of the Greisen and Zatzepin and Kuzmin cut-off by the HiRes group based on their nine years data is a significant step toward the eventual solution of the one of the most intriguing questions which has been present in physics for more than forty years. However the word ’significance’ is used in the mentioned paper in the sense which is not quite obvious. In the present paper we persuade that this claim is a little premature.
I Introduction
According to the usual practise the ‘5 sigma confidence level (the chance probability of occurrence of about 1:10000000) is the level of discovery in physics. An observation of something which by chance can appear so rarely gives as all rights to believe that there is some cause, yet unknown, but worth to be studied further. The discussion of the case of recent GZK cut-off discovery is the subject the present paper.
After almost 100 years of research, the origin of cosmic rays is still an open question. The CR energy spectrum exhibits little structure and is approximated by broken power laws. The first break, called the “knee”, appears at the energy of eV , the flux of particles steepens from a power law index of about 2.7 to one of index 3.0. The bulk of the CRs up to at least that energy is believed to originate within the Galaxy. The spectrum continues with a further steepening to 3.3 at eV, sometimes called the “second knee”. There are some indications, see, e.g., Ref. hor , that the mass composition changes from light at the knee to heavy dominated by iron nuclei at the second knee. This is expected if acceleration and propagation is due to magnetic fields only and depends on particle rigidity.
The second knee could be related to the transition from the Galactic cosmic ray flux to the extragalactic one around the “dip” structure at eV. Some argue that this switch takes place before my , and some that after bere the dip, but anyhow, the spectrum then flattens again to a power law with an index of forming the so-called “ankle”.
The possibility of another change of CR composition around the ankle is a subject of extensive experimental studies. If there is a proton dominated extragalactic cosmic ray flux above the ankle, then, according to the works of Greisen Greisen-1966-PRL-16-748 , and Zatsepin and Kuzmin Zatsepin-1966-JETPL-4-78 (GZK) published in 1966 just after the Cosmic Microwave Background (CMB) had been discovered, the suppression in cosmic-ray flux beyond certain energy is inevitable. The mechanism of this cut-off is that protons travelling intergalactic distances would interact with the CMB photons losing energy producing the resonance. A energy threshold for this process was predicted in 1966 at eV.
The observation of sharp cut-off of the CR flux around this energy gives the strong evidence of the proton dominant composition of the Ultra High-Energy Cosmic Ray (UHECR).
On the other side, the observation of the absence of the cut-off is no less meaningful. It means that the particles there, because there should be no protons, ought to be heavy nuclei or something even much more exotic. The heavy nuclei doubtlessly disprove any top-down mechanisms of UHECR particle creation.
Of course there is still a possibility that all extragalactic UHECR (including protons above the GZK threshold) are coming from distances less than Mpc which is very close in cosmological scales.
The HiRes experiment group claim recently that the idea of Greisen and Zatzepin and Kuzmin was confirmed with the statistical significance of 5 standard deviations.
From the experimental point of view the determination of particle energy is based on well known for more than sixty years fact that the particle entering the atmosphere initiates the cascade of secondary particles created in the chain of subsequent interactions. This cascade, called Extensive Air Shower (EAS) consists a huge number of charged particles (mostly electrons and positrons) which lose energy exciting the atmospheric particles. They in turn could then emit light, mainly in the UV region, and this light could be, in principle, registered. Registration of this scintillation light flashes is the one way of counting the number of charged particles in EAS. Another one is to count the particles reaching the ground with the number of detectors spread over the wide area. The number of particles, shower size, is related of course to the total primary energy of the UHECR particle. The problem how to transform the EAS size in each individual case to the primary particle energy, or the whole measured size spectrum to primary energy spectrum is the subject of extensive simulation studies. It is believed that our knowledge allows experimentalists to perform such transformation with some reasonable accuracy (of order of about 20%).
The HiRes project is using the fluorescent technique. It has been described, e.g., in AbuZayyad-1999-ICRC-26-5-349 ; Boyer-2002-NIMA-482-457 . The experiment consists of two detector stations (HiRes-I and HiRes-II) located on the Dugway Desert in Utah, US, 12.6 km apart. Each station is assembled from telescope modules (22 at HiRes-I and 42 at HiRes-II) pointing at different parts of the sky, covering nearly in azimuth, and – (HiRes-I), and – (Hires-II) in elevation. Each telescope module collects light from air showers using a spherical mirror of about 4 m2 area. The camera for each telescope is a cluster of photomultipliers of the field of view of a diameter cone on the sky Sokolsky-2007-ICRC-30-1262 .
The data of HiRes consists of three sets: two of them are the monocular data collected by HiRes-I and HiRes-II detector stations, and the third is the set of events registered simultaneously by both stations. The smaller statistics of the last one is related to the high energy threshold for the showers to be seen by both stations as well as the limited geometry and thus effective collection area. However the stereo observation makes the energy estimation much more accurate and gives the possibility to check the mono-eye reconstruction procedures for systematic biases at least in the limited sample of stereo events.
The Ref. Abbasi:2007sv conclusions are based only the monocular HiRes data from both stations (the showers seen by both were excluded from the HiRes-I sample to preserved the statistical independence of both station measurements). We would like to look as well to the stereo data which can be found, e.g., in Ref. Sokolsky:2007hf .
We don’t want also to discuss here also all the details concerning energy determination procedures, sources of uncertainties, also these systematic, as well as the complicated question of the apertures estimation. These question were subjects of the extensive analysis made by the HiRes team for years. The published statements make the procedures as trustful as one can get, taking into account the inevitable knowledge of the very high interaction mechanism, still not known very precisely fluorescence yield, the status of the atmosphere in every particular case, possible uncertainties, oversimplifications of the simulation and reconstruction programs, to name only few possible sources of experimental difficulties, not to mention the problems of the hardware nature.
II The probability
The paper Abbasi:2007sv can be used as an example of misunderstanding, or rather, as an illustration of the general problem with the concept of probability.
There are at least two (main) interpretations of the probability itself. One called classical is well known and obvious, but it should be remembered that it is common not for very long time. Approximately, as classical as ’classical’ is the special theory of relativity (since the times of Pearson), or even as old as quantum physics (since Neyman or Fisher milestone papers). Sir Francis Galton the pioneer of the statistical treatment of the data, was knighted less then hundred years ago, in the year 1909. The frequentalist meaning of the probability is given already at schools. In the common form, as a limit of the fraction of successes in the infinitely long sequence of identical trials. (The ’identity’ should be understand as the requirement that the ’probability’ in question remains constant during the sequence of trials. This circulus in definiendo is one of nightmares of the frequentalists.)
Another way of thinking about the probability comes from Thomas Bayes and it is more than a hundred years older, however, in its modern form as ”Bayesianism” has been used since about 1950. The Bayesian point of view stands for the probability as a rate of rational bet, a degree of belief
The Bayesian treatment of the probability makes it closer to the common sense. People don’t have to have the big (infinite) sample of results of the repeated experiment (in exactly the same conditions etc.) to say something about, e.g., the Higgs boson mass, or the appearance of the sun tomorrow morning.
The Bayesian definition of probability is ’by definition’ subjective. The probability itself doesn’t exist, in a sense agostini . The most important for the discussed problem is the fact that the Bayesian probability of the event is defined in a certain moment in time. When the time passed, the value of the probability (the rational bet) may change caused by the increase or decrease (we’ll come back to this last intriguing possibility in Sec. V.1): a change, in general, of the information about the subject one has gathered in the meantime.
This situation is common in physics. The progress of our understanding of the Universe is expected to be related to the new experiences, observations, measurements. All of them change a background which makes the base of the estimation of our rational bets on reality (to be made, e.g., for further experiment outputs).
The Bayesian analysis is based on his famous theorem, which can be expressed as: , where the proportionality constant is determined by the normalisation of the . The first factor is the probability of the hypothesis to be true prior to the experiment output is known. The is the likelihood of the output if the hypothesis is true. The left side of the equation is the improved new probability of the hypothesis to be true if we know the result .
The question of the existence of the GZK cut-off can be answered in terms of probability. The proposition ”there is a sharp cut-off of the very high energy cosmic ray spectrum” and the opposite ”no such cut-off exists”. These are statements about the reality and of course only one of them can be true. To judge this in a scientific (’classical’) way one has to test the GZK cut-off hypothesis statistically. The standard, Fisher or frequentalists, answer to the test question can be only that at given confidence level there are no observational constrains to the GZK hypothesis, or the hypothesis should be, according to the performed observations, rejected on this confidence level. The Bayesian answer can be that there is a given probability, estimated according to all the knowledge we have, that the GZK hypothesis is true (or false, if one wish).
We will discuss this difference.
III The prior
The question if the cosmic ray energy power-law spectrum extends continuously with more or less constant index stands before the famous Greisen, and Zatsepin and Kuzmin papers predicting a sharp end of this spectrum around few (6) times 1019 eV appeared. The GZK cut-off as a result of interaction of Ultra High-Energy Cosmic Ray protons with Cosmic Microwave Background (CMB) photons, couldn’t be proposed before the CMB radiation itself was discovered in 1965. But even then UHECR were intriguing due to the fact that they, according to the great magnetic rigidity, couldn’t be confined within the Galaxy or in other known Galactic object.
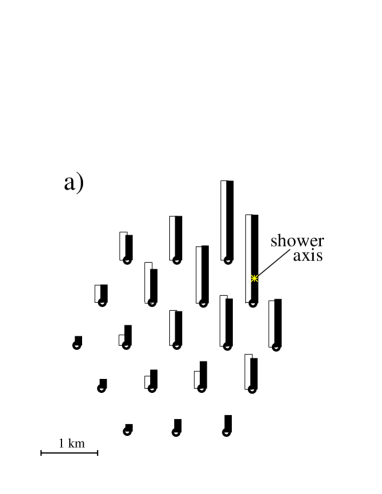

The sharpness of the CR energy spectrum require EAS arrays of bigger and bigger areas to register the highest energy particles. The first really great one dedicated for the UHECR domain was the Volcano Ranch array. It has been running since 1960. It consists of 19 3.3 m2 scintillator counters distributed aver about 10 km2 in Dugway. This experiment, relatively simple and small in comparison with contemporary projects, registered in February 1962 the event No. 2-4834 volcano1 . shown in Fig. 1a. 11 out of 19 detectors registered particles. The highest signal was estimated to be equivalent of about 1400 minimum ionisation particles per m2. The shower particle lateral distribution was found using the form known as NKG-function. Its integration gave the total number of charged particles in the shower equal to . There registered densities (their logarithms) in comparison with the values of the fit are shown in Fig. 1a as vertical bars along each detector positions. It is seen in Fig. 1b that the found particle distribution describes the points very well. The tests with another distributions used in different experiments doesn’t make it any better and the total number of particles doesn’t change more than 20%. As an ultimate test we can try to eliminate from the fitting procedure the stronger signal detector arguing that it can be made by some internal cascading, thus not representative to the shower particles. The usual NKG function fit however doesn’t change the result. If one release all parameters in NKG-like function (both indexes and radius scale parameter) the ’best fit’ can produce eventually the size of the shower significantly different, (N instead of ) with a slight displacement of the estimated shower core position. But the shape of this lateral distribution is so different from conventional wisdom and it couldn’t be taken as real better shower description. The usual NKG function is well established experimentally and it is close to the shower particle distribution measured in different experiments.

All this was reminded to cite here explicit the statement given by Linsley in Ref. volcano2 : ”The first observation of the spectrum above eV, at Volcano Ranch, showed that the spectrum extends to eV without a sign of any cut-off.”
Also before the CMB discovery the really very big array was constructed on the Southern hemisphere. The Sydney University Giant Airshower Recorder (SUGAR) consists of more than 50 stations, each containing two 6 m2 scintillator detectors buried underground spread over the surface of about 100 km2 area. Detectors of SUGAR were able to register only EAS muons of energies greater than about 1 GeV. The spectrum obtained this way published in 1973 in Refs. syd1 ; syd86 is shown in Fig. 2 .
The paper syd1 was concluded with the statement: ”It appears likely that the primary energy spectrum extends beyond eV with no significant features…”.
The interest of UHECR increased in the meantime while the CMB was discovered and famous papers announcing the GZK cut-off has been published.


The Northern sky was then monitored by the EAS array built in Haverah Park near Leeds, UK. It reach the size of the Volcano Ranch at about 1968. Different types of detectors (water Čerenkov tanks) but also special detectors for muon shower component were installed there. About 30 years ago the results on the UHECR energy spectra were announced. We would like to show here three spectra published by the Haverah Park team from the first published in the end of ’70 Refs. hp77 ; hp80 to final 1991 year spectrum hp91 . A kind of evolution is seen. It will be discussed later on.
In the beginning of ’70 also in USSR the Yakutsk array has started collecting data (and it is still in operation). The first data concerning the size spectra was published in Ref. yak73 . It is shown in the Fig. 4 together with the recent Yakutsk result published in Ref. yakrecent in 2003.


The most controversial (at present) spectrum from the big experiment AGASA agasas is shown in Fig. 5. There are about a dozen of events (the last recorded in 2002) exceeding the GZK limit.

Clear signal presented in the figure is the extreme in the sense that it evaluated with time (mostly due to adjustments of the energy estimation procedures) being less pronounced, but the AGASA result always contradicts the GZK cut-off, more or less strongly. It is worth to mention that in 1993, the AGASA array recorded a very well measured almost vertical air shower with an energy estimated of about eV agabig . Later, in 2001 the event of energy of about eV has been seen in Japan. However, the world record of the highest UHECR particle energy belongs to the event measured by precursor of the HiRes, the Fly’s Eye experiment in 1991. The value to beat is, since then, still eV fe3e20 .


The Fly’s Eye detector begin operation in 1981 first as single Eye monitoring the scintillation flashes produced by extremely big cascade of charged particles created by UHECR in the atmosphere. In 1985 the second Eye (twice smaller) joint the first completed the apparatus. It increased significantly the geometrical reconstruction procedures accuracy thus the particle energy determination. The statistics collected by the First Fly’s Eye detector, the monocular data set, is much larger than the stereo data set. Both spectra are shown in Fig. 6 fe . The mentioned single event of energy of eV is seen as a separated single point in the Fig. 6b.


There is well known that the spectra from different experiments are displaced, as well in absolute energy calibration, as in the normalization of the total measured UHECR flux. In Ref.szab the procedure was developed to shift (and adjust according to different individual energy resolution) results of each group using the assumption about the universality of the dip structure observed in all data sets below 1019 eV. In our opinion this feature is related to the change from the Galactic to the Extragalactic flux component. There are also other opinions, but no matter what is the source of the dip, it can be used as an energy and total flux re-calibration. When it is done, the spread of the points is Gaussian and the average value makes sense, thus the observed spread can be used to determine the error of the average.
The averaging procedure was applied to all data with two exceptions. The one is the Pierre Auger Observatory (PAO) recent spectrum Matthiae:2008en published after the result of HiRes comes out - if not the final ‘5 sigma’ statement in Ref.hires , than as in the form of an announcement of the GZK cut-off discovery in Ref.hires-mex . The PAO spectrum will be discussed in Sec.V . The second are HiRes spectra which are the subject of this paper, and which will be discussed in details in the next section. In the Fig. 7 the result of the summary is shown.
The ’world average’ presented in Fig. 7b forms exactly the prior needed in Bayesian reasoning treatment of probability. The world record event from Fly’s Eye mono and the Volcano Ranch first UHECR showers are not included in the shown prior.
IV The Likelihood
The factor next to the prior in a Bayes formula is the likelihood. It describe the increase of our knowledge related to the new measurement, in our case the recent HiRes experiment spectrum hires shown in Fig. 8. Left panel shows results of two ’mono’ spectra of events registered separately by the Eye I and II. In the right the more accurate, but statistically poorer the ’stereo’ spectrum obtained from events seen by both Eyes is shown.


Lets first discuss the ’5 sigma’ statement as it is published in Ref. Abbasi:2007sv . It is based on the Fig. 8a.
It was obtained comparing two numbers: 43.2 expected and 13 events observed. The comparison was done using the Poisson distribution with the average, expected value, 43.2, and indeed the probability of observing 13 or less events is on the level of .
The value of 43.2 expected events is obtained extrapolating the spectrum with the same index as adjusted to the data between the energies of about eV and the point of abrupt GZK break announced at eV. The accuracy of this index reported is equal to Abbasi:2007sv . The change of the index from 2.81 to 2.81+0.03 increases the likelihood about twice, which doesn’t seem to be much.
The change of the estimated position of the GZK break in the spectrum ( Abbasi:2007sv ) from 19.75 to 19.79 decrease expectations from 43.2 to about 36.5 decreasing likelihood significantly. To preserve its level of the number of observed events should change from 13 to 9 (1/3 of events observed above GZK cut-off has to have energies not more than 10% higher than the cut-off energy ). It is still possible. Such error in the energy determination is within the accuracy of the method of energy determination by the experiment, so it is hard to estimate with the actual measured sample of 13 events.
All this details can change some probabilities we are still close to the level of ’5 sigma’. The data collected by HiRes mono experiments produce likelihood of about .
V The improvement
According to the conventional wisdom and, formally, to the Bayes formula, any new measurement should improve our knowledge.


The procedure of averaging UHECR spectra used to obtain the prior (Fig. 7b) can be used of course also for all experiments including HiRes mono and stereo, as well as PAO.
The result is presented in Fig.9.
The Fig.9a shows the result of combining the HiRes mono spectra Abbasi:2007sv and the prior. The prior is moved to match the dip structure where it is seen well in the HiRes data.
It has been said, that the HiRes mono data itself gives the ‘5 sigma’ confidence. From the Bayesian point of view this statement represents the situation when nothing else about UHECR flux is known. As it has been shown in Sec.III we already know quite a lot and the real spectrum. Accordingly, the GZK significance estimation after the HiRes (mono) measurement, can be estimated from the posterior spectrum shown in Fig.9a. To get some numbers we follow the procedure used by HiRes group in Ref. Abbasi:2007sv . First we get the index of the UHECR particle spectrum above the ankle where is seems to be stable and where there is no signs of any cut-off. We used the same energy interval as it was used in Ref. Abbasi:2007sv . The value of the index found is 2.870.08.
Then we estimated the probability that, when there is no GZK cut-off, the measured flux at the very tail of the spectrum is at least as low as our improved UHECR flux. The ‘absence of the GZK cut-off’ means that the UHECR flux above continues the trend found at the ankle below this energy. This probability could be estimated with the help of the statistics. The obtained value is what gives the chance probabilities of about .
Introducing the HiRes stereo data gives the posterior flux shown in Fig.9b. Estimated index below the remains unchanged. The complete HiRes (mono+stereo) gives , and the chance probability even bigger: .
We can say than if the HiRes data are combined with the prior that the existence of the GZK cut-off is observed with the significance below 2 level.

There is, mentioned above, one more data set on UHECR spectrum available for some time. This is Pierre Auger Observatory result Matthiae:2008en shown in Fig. 10. The PAO spectrum exhibits also the cut-off in general accordance with HiRes result, in spite of its energy calibration and absolute flux normalization. The enhancement of the probability in favour of the GZK picture is expected.
It is not very substantial as it can be seen in Fig. 9c, where the combination of all measured spectra is shown. The index before the GZK threshold energy is slightly changed to 2.86, and the chance probability changes to and the significance level of the GZK cut-off discovery, expressed in sigmas, exceeded 2.
It should be mentioned here the existence of the very high energy events not included in the present analysis. The first ever super-GZK Volcano Ranch event discussed in Sec. III, the mentioned ‘world record’ Fly’s Eye event, and the one registered by PAO just on the edge (but slightly outside) of the working part of the array, additionally diminish the GZK cut-off existence probability.
V.1 Observation of the evolutionary effect
It is interesting to note the evolution of the UHECR flux results measured by different experiments. It is in general nothing extraordinary. It is well known, e.g., in the lasting case of gravitational constant. Another example is given in the first one of Particle Data Group history plots: the neutron life-time case. Error boxes of results measured before 1970 are far outside the nowadays accepted value groom .
The UHECR flux Haverah Park measurement history is given in Fig.3 while the Yakutsk in Fig.4. Both exhibit similar effect. The initially published spectra do not follow the GZK hypothesis, just opposite, they continue gradually.
The spectra of HiRes telescopes shown in Fig.8 are its recent version showing ‘5 sigma’ deficit of super-GZK events. At the end of previous century HiRes spectrum looked quite different. In Fig.11a the spectrum of HiRes I (BigH) detector is shown as it was published in Ref.abuza . There are 13 events observed between May 1997 to June 1999 with energy exceeding eV and 7 with energy greater eV! All details of these super-GZK events are published in Ref. abuza .


HiRes data few years ago (but in XXI century) looked also slightly different. Fig.11b presents the HiRes II spectrum obtained from data collected between December 1999 and September 2001 zech .
The probability of the GZK cut-off hypothesis is increasing in last years, not only according to the new measurements but also confirmed by the re-analysis of the old data.
The ‘evolution’ of the UHECR spectra is sustained by another interesting fact. The knowledge gathered by the experimental group not so long ago, even in ’80, vanishes recently very fast, in a sense. This possibility was mentioned in Sec. II The contemporary new and big experiments, much bigger than the old ones, and hundreds of people working there draw their conclusions like there was nothing before them. But the super-GZK events seen some time ago remain the super-GZK still, even if one doesn’t like them.
The similar conclusion can be found in the recent paper analysing the UHECR data by Glushkov and Pravdin glusz .
VI Summary and Conclusions
The rational concluding the facts presented in the previous Section we have to take into account non-physical factor, which for frequentalists sounds like insult, and it is neutral for Bayesians. The factor of believe.
The believe in GZK (thus believe in extragalactic protons) acts as additional prior and influence the reasoning driving to the conclusions which are (or, in general, could be) wrong. Wrong, from ’frequentalist’, physical point of view, which they (the frequentalists) believe, should be free of any believes.
If one would bet 10000000 to 1 for the GZK cut-off existence, thus the pure proton flux in the UHECR domain than his additional, ‘non-physical’ believe in GZK, is on the level of 10000 to 1. This is simply Bayesian conclusion of the calculations presented above. The ‘5 sigma’ effect combined with the prior (and additionally with the PAO result) turns out to be only little above ‘2 sigma’.
As a conclusion we have shown that the GZK cut-off if exist, has the overall significance of about ‘2 sigma’ far less than ‘5 sigma’. Thus the claim that the Greisen and Zatzepin and Kuzmin has been established experimentally is a little premature.
References
- (1) J. R. Hoerandel, Astropart.Phys. 21, 241 (2004), J. Phys. Conf. Ser. 39, 463 (2006).
- (2) T. Wibig and A. W. Wolfendale, J. Phys. G: Nucl. Part. Phys. 31 255 (2005), 34 1891 (2007).
- (3) V. S. Berezinsky et al., Astropart. Phys. 21, 617 (2004).
- (4) K. Greisen, Phys. Rev. Lett. 16, 748 (1966).
- (5) G. T. Zatsepin and V. A. Kuz’min, J. Exp. Theor. Phys. Lett.4, 78 (1966).
- (6) T. Abu-Zayyad et al., Proc. 26 ICRC, Salt Lake City, USA, 4, 349 (1999).
- (7) J. H. Boyer et al., Nucl. Inst. Meth. A 482, 457 (2002).
- (8) P. Sokolsky et al., Proc. 30th ICRC, Merida, Mexico 1262 (2007).
- (9) R.U. Abbasi et al., Phys. Rev. Lett. 100 (2008) 101101 [arXiv:astro-ph/0703099].
- (10) P. Sokolsky and G. B. Thomson, J. Phys. G 34, R401 (2007) [arXiv:0706.1248 [astro-ph]].
- (11) B. de Finetti, “Theory of Probability”, John Wiley & Sons, Chichester, (1974).
- (12) J. Linsley, Phys. Rev. Lett. 10, 146 (1963).
- (13) C.J. Bell et al. Proc. 13th ICRC, Denver, USA 4 2519 (1973).
- (14) J. Linsley, Proc. 19th ICRC, La Jolla, USA,9 475, (1985).
- (15) M.M. Winn, J Ulrichs, L.S. Peak, C.B.A. McCusker and L Horton, J. Phys. G 12 653, (1986).
- (16) Cunningham et al., Proc. 15th ICRC, Plovdiv, Bulgaria 2, 303 (1977).
- (17) Cunningham et al., Astrophys. J. 236 L71, (1980).
- (18) M.A.Lawrence, R.J.O Reid and A.A. Watson, J. Phys. G 17 733, (1991).
- (19) I. M. Kerschenholtz et al., Proc. 13th ICRC, Denver, USA 4, 2507 (1973).
- (20) A.V. Glushkov et al., Proc. 28th Tsukuba, Japan 1, 389 (2003).
- (21) M. Takeda et al., Astropart. Phys. 19, 447 (2003).
- (22) N. Hayashida et al., Phys. Rev. Lett. 73, 3491 (1994).
- (23) D. J. Bird et al., Astrophys. J. 441 144, (1995).
- (24) D. J. Bird et al., Phys. Rev. Lett. 71 3401, (1993).
- (25) J. Szabelski, T Wibig, and A.W. Wolfendale, Astropart. Phys. 17, 125 (2002).
- (26) T. Yamamoto et al., Proc. 30th ICRC, Merida, Mexico 318 (2007), arXiv:0707.2638 [astro-ph]; G. Matthiae, arXiv:0802.2214 [astro-ph].
- (27) R. Abbasi et al., Phys. Rev. Lett. 100:101101, (2008).
- (28) D. R. Bergman et al., Proc. 30th ICRC, 1128 (2007).
- (29) W.-M. Yao et al., J. Phys. G 33, 1 (2006).
- (30) Tareq Ziad AbuZayyad, The Energy Spectrum of Ultra High Energy Cosmic Rays, PhD thesis, Univ. of Utah, USA, (2000).
- (31) A. Zech, A measurement of the ultra-high energy cosmic ray flux with the HiRes FADC detector, PhD thesis, Rutgers Univ. of New Jersey, USA, (2004).
- (32) A. V. Glushkov and M. I. Pravdin J. Exp. Theor. Phys. Letters, 87, 345 (2008).