Photoproduction of and on the proton at = 1.5-2.4 GeV
Abstract
Differential cross sections for and reactions have been measured in the photon energy range from 1.5 to 2.4 GeV and the angular range of for the scattering angle in the center-of-mass system. This data is the first measurement of the photoproduction cross section. The lineshapes of measured in and decay modes were different with each other, indicating a strong interference of the isospin 0 and 1 terms of the scattering amplitudes. The ratios of production to production were measured in two photon energy ranges: near the production threshold ( GeV) and far from it ( GeV). The observed ratio decreased in the higher photon energy region, which may suggest different production mechanisms and internal structures for these hyperon resonances.
pacs:
14.20.Jn, 25.20.LjI Introduction
Recently, the photoproduction of and hyperons off protons has been studied with high statistics data Tran1998 ; McNabb2004 ; Glander2004 ; Sumihama2006 , mainly motivated by missing resonances which could couple to the channels Capstick1998 . The authors of Ref Capstick1998 also predicted nucleon resonances which couple to the channels, and . In addition to searching for missing resonances, it is of interest to study the internal structure of hyperon resonances. The hyperon is firmly established as a baryon. On the contrary, the internal structure of the hyperon is ambiguous. In the quark model, is assigned as a -wave baryon Isgur1978 . However, it is also widely discussed as a candidate for a meson-baryon molecular state Dalitz1967 ; Kaiser1995 ; Nacher1999 or a pentaquark baryon Inoue2007 . An overview of the study of the before the year 1998 can be found in Ref. Dalitz2000 . Recent lattice calculations also reported a non- structure for the Nemoto2003 ; Ishii2007 . Based on the meson-baryon molecular picture of the , a model calculation using the chiral Lagrangian and unitary coupled channel approach succeeded to dynamically generate the mass spectrum of Nacher1999 . The same model also predicted a second pole for the with a mass of 1.425 GeV/c2, which strongly couples to Jido2005 , and experimental evidence for this second pole has been reported Prakhov2004 ; Magas2005 . It is important for the study of the internal structure of the to measure the pole position and width of this hyperon resonance from the invariant mass distribution. In order to extract this information using the final state, one has to take into account the effect of the interference between the isospin 0 and 1 amplitudes of the interaction Nacher1999 and the interference between the s-wave and p-wave amplitudes JidoPrivate .
The cross section of hyperon photoproduction depends on its production mechanism and the form factor of the hyperon. Photoproduction of has been measured by the CLAS Collaboration at TJNAF with a photon energy range of 1.5-3.8 GeV Guo2006 and by old bubble chamber experiments Cambridge1967 ; Erbe1969 . A theoretical calculation by Oh et al. Oh2007 using an effective Lagrangian was then compared with the preliminary data of total cross section by the CLAS experiment, and the contributions from nucleon resonances were discussed. Experimentally, the has been studied in meson-induced and proton-induced reactions so far Prakhov2004 ; Thomas1973 ; Hemingway1985 ; Zychor2008 . However, understanding of the photoproduction of is very limited because of the lack of experimental data. Theoretically, Nacher et al. Nacher1999 predicted the cross section of photoproduction to be 5 b/GeV at the peak of the invariant mass spectrum of using the chiral unitary model. Lutz and Soyeur calculated the differential cross section for the sum of and photoproduction using a chiral coupled-channel effective model Lutz2005 . In both theoretical calculations, the effect of the interference with the p-wave amplitude was neglected. Experimentally, the contribution of the p-wave amplitude can be studied by increasing the photon energy from the production threshold. In this paper, the differential cross section of photoproduction and its comparison with that of are reported for the first time. The cross section was measured in two photon energy bins: near production threshold region and far from it.
II Experimental procedure and setup
The experiment was carried out at the Laser-Electron Photon facility at SPring-8 (LEPS) Sumihama2006 ; Nakano2001 . The data were collected using two different experimental setups, referred to hereafter as data set (I) and data set (II). Photoproduction of and has been studied at LEPS using high statistics data with a liquid-hydrogen target (data set (I)) Sumihama2006 . The statistics of this data set were sufficiently high to determine the differential cross sections accurately for the ground state and hyperons. Nevertheless, in principle, it is impossible to separate and from a missing mass of reactions, , because the intrinsic widths of these resonances, 36 MeV/c2 for and 50 MeV/c2 for , are much larger than their mass difference. In order to distinguish these two, a time projection chamber (TPC) was used for data set (II) together with the LEPS spectrometer to facilitate the detection of the decay products of these hyperon resonances. Using this data set, the production ratio between and was fixed from the yields of and measured from their and decay modes, respectively. The absolute values of the differential cross sections were then obtained from the distribution measured in data set (I) with the input of the production ratio between and in the common detector acceptance of the two data sets.
At LEPS, photons with a maximum energy of 2.4 GeV are produced by Compton back-scattering of laser photons with a wavelength of 351 nm from the 8-GeV electrons in the SPring-8 storage ring. To measure the energy of each photon, the recoiling electrons were momentum analyzed by a bending magnet of the storage ring and detected by a tagging counter (tagger) inside the ring.
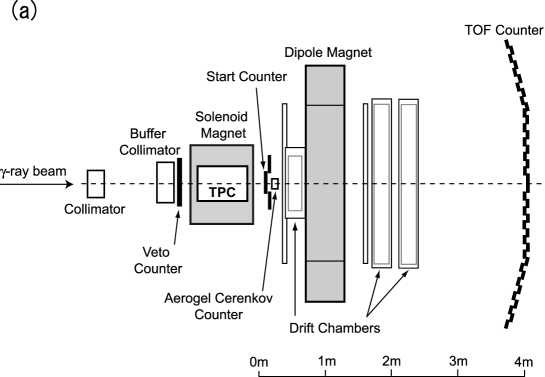
Forward going ’s from the reaction were detected in the LEPS spectrometer, which consisted of a dipole magnet, a silicon-strip vertex detector, three multiwire drift chambers, a start counter (SC) just downstream of the target, and a time-of-flight (TOF) hodoscope placed downstream of the tracking detectors. Electron-positron pairs were vetoed by an aerogel Čerenkov detector just after the SC. Figure 1 (a) shows a schematic drawing of the LEPS spectrometer. More details of the LEPS spectrometer can be found in Ref. Sumihama2006 .
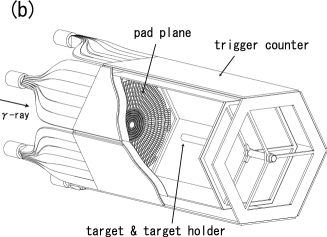
The TPC, shown in Fig. 1 (b), was used for data set (II) to detect the decay topology of low momentum hyperons, and , originating from the decay of hyperon resonances. Cylindrical targets of CH2 and carbon with a diameter of 24 mm and lengths of 47 mm (CH2) and 22 mm (carbon) were placed inside the TPC. The TPC had an active volume of cylindrical shape with a radius of 200 mm and a length of 770 mm, which was filled with P10 gas (Ar : CH4 90% : 10%). The TPC was immersed in a solenoidal magnetic field of 2 Tesla. The signals from the TPC were read through 1055 cathode pads which were arranged in 14 circular rows and were amplified by preamplifiers and shaping amplifiers. The wave form of each signal was digitized by flash ADC with 10 bit resolution and a 40 MHz sampling rate. The typical spatial resolutions were found using cosmic ray tracks to be m in pad plane and m in the z direction. Details on the TPC can be found in Ref. Niiyama2003 .
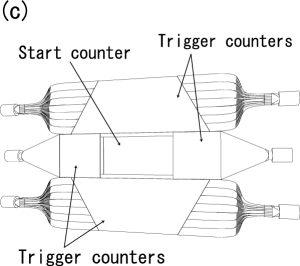
The TPC was surrounded by ten scintillation counters to detect charged particles passing through the active volume of the TPC. Six scintillation counters were equipped on the sides of the TPC, and the remaining four were placed between the TPC and the LEPS spectrometer (Fig. 1 (c)). The trigger used for this analysis was a coincidence between the tagger, the SC, the TOF wall, and any two of the ten scintillation counters surrounding the TPC. The aerogel Čerenkov veto counter was also include at the trigger level.
III Analysis
First, the analysis for the production ratio between and using data set (II) is described, followed by the determination of the absolute values of the differential cross sections using data set (I). The ratio of the production cross section between and was obtained from the following two reactions:
| (1) | |||||
| (2) |
The yield of production was measured from reaction (1) because is prohibited from decaying into by isospin conservation. Since the detectors were not sensitive to photons, ’s were measured through the missing mass technique. The contamination of in reaction (2) was estimated from the yield measured in reaction (1). The yield of production was extracted from reaction (2) after subtracting the contamination of production. The production ratio was obtained after taking into account detector acceptance and the decay branches of these hyperons. The differential cross sections of and production were then obtained in two photon energy bins: GeV and GeV.
For this analysis, events of the type were selected by identifying a in the LEPS spectrometer. After reconstructing the mass of the each track from the momentum and TOF information, a 4 cut was used to select the ’s taking into account the momentum-dependence of the mass resolution Sumihama2006 . To reject kaons which decayed within the spectrometer, events were required to have a probability for track fitting of greater than 0.02. Events produced at the nuclear target were selected by their closest points between the track and the beam axis. For the photon energy measurement, we required a single electron track be reconstructed by the tagging counter. The numbers of events surviving the selection cuts are summarized in Table 1.
| Cut by the LEPS spectrometer | events (CH2) | events (C) |
|---|---|---|
| selection | 1.39 | 7.38 |
| decay-in-flight rejection | 1.30 | 6.88 |
| Vertex selection at the target | 1.26 | 6.68 |
| One recoil electron in the tagging counter | 1.12 | 5.92 |
| Cut by the TPC for | events (CH2) | events (C) |
| Proton and identification by TPC | ||
| selection | ||
| Cut by the TPC for | events (CH2) | events (C) |
| selection in TPC | ||
| (GeV/c2)2 | ||
| neutron selection | ||
| probability cut of C2-fit |
To study the production, we required the following cut conditions: (i) selection of a in the LEPS spectrometer, (ii) identification of a proton and a in the TPC, (iii) selection of those events for which the mass of a pair corresponds to that of the . The numbers of events which survived these cuts are shown in Table 1. To match the acceptance of the LEPS spectrometer between data sets (I) and (II), the scattering angle of the in the center-of-mass frame, , was required to be .
The candidate tracks of a pair were identified from the truncated mean of the energy deposition () measured by the pads of the TPC. Fig. 2 (a) shows a correlation plot between and momenta of charged particles detected in the TPC for events where a was found in the LEPS spectrometer. Protons and ’s were selected by the dashed and solid curves, respectively. Fig. 2 (b) shows the invariant mass spectrum of pairs, . The mass and width () were obtained from a Gaussian fit to the data to be 1115.4 0.4 MeV/c2 and 3.9 0.5 MeV/c2, respectively, and are consistent with the value of the mass listed in the PDG and the expected width of 4.0 MeV/c2 determined by a Monte Carlo (MC) simulation. The events in the hatched area were retained for the analysis of production.
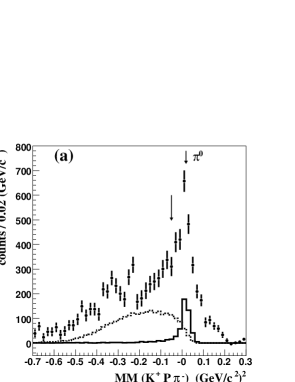
First, the yield of was extracted from the peak in the missing mass spectrum of the reaction for events which the mass of a pair corresponded to that of the . The spectrum for free protons was obtained from the spectrum for CH2 by subtracting the one for carbon after normalizing each spectrum by the number of photons and the number of carbon nuclei in each target. Before the subtraction, the spectrum for carbon was smoothed by smearing the photon energies with the experimental resolution in order to reduce the effect of statistical fluctuations. For each event, the photon energy was smeared by Gaussian random numbers with a width of 15 MeV, and the missing masses were calculated using the smeared photon energies. Fig. 3 (a) and (b) show the spectrum for free protons in CH2 for two photon energy bins: GeV and GeV, respectively. From these spectra, the masses of the and were obtained as MeV/c2 and MeV/c2, respectively, in agreement with the PDG values. The observed widths (RMS) of were MeV/c2 and MeV/c2 for GeV and GeV, respectively, which are consistent with the expected values of 19 MeV/c2 and 24 MeV/c2 for each photon energy bin. Those of were also consistent with expected values. For the resonance around 1.4 GeV/c2, we assumed a Breit-Wigner shape, neglecting any distortion due to the small contamination of . The effect of this contamination is considered below. The mass of the was found from a Breit-Wigner fit with a linear background assumption to be MeV/c2 and MeV/c2 for GeV and GeV, respectively. The observed widths (FWHM) were MeV/c2 and MeV/c2, which are consistent with the expected width of 50 MeV/c2.
In order to obtain the yield of , two background contributions were investigated:
| (3) | |||||
| (4) |
The background from reaction (3) was estimated from the missing mass of the reaction, , where for production and for production. Fig. 4 (a) shows the distribution of missing mass squared, , for free protons in the CH2 target for events which passed the selection cut and a / selection cut of GeV/c2. The peak at 0.018 (GeV/c2)2 corresponds to the square of the mass. The solid and hatched histograms show the expected spectra determined from MC simulation for production and for the background reaction (3), respectively. The normalization factors for these spectra were determined by fitting to the data. The contamination from reaction (3) was found to be 8% of the number of events in the mass region.
The remaining contamination from reaction (4) was estimated from the yield of in the missing mass of the reaction, , for events in the mass region which were rejected by the selection cuts. The resulting spectrum for is shown in Fig. 4 (b). The solid curve shows the spectrum of generated by a MC simulation of the background reaction (4) and events caused by a proton or a misidentified as a by the LEPS spectrometer. The acceptance of the rejection cut was calculated using the MC simulation, and the contribution from reaction (4) was found to be about 12% of the number of events in mass region. The yield of was obtained by subtracting the contamination from reactions (3) and (4) and was found to be events and events for GeV and GeV, respectively.
Next, the production of was measured using the reaction. The following cut conditions were imposed: (i) selection of a in the LEPS spectrometer, (ii) identification of a and a in the TPC, (iii) rejection of events where a proton was misidentified as a in the TPC, (iv) selection of a neutron in the missing mass of the reaction, and (v) selection of events with a good probability of kinematic fit assuming neutron and masses. The numbers of events remaining after these cuts are shown in Table 1.
The candidate tracks of a (, ) pair were again identified by the energy deposition in the TPC combined with the momentum information. The selection boundaries were the same as those for the ’s as indicated by the solid lines in Fig. 2 (a). The rate at which protons are misidentified as ’s increases for the high momentum region, because for these protons becomes small and the proton band cannot be separated from the pion band. These protons were produced by either the reaction or reaction. In both reactions, the missing mass of the reaction, , corresponds to the mass. Thus, these background events can be eliminated by rejecting ’s in . Fig. 5 (a) shows the distribution of the square of , where all candidates were assumed to be protons and assigned the proton mass. Closed circles show the experimental data. The arrows indicate the PDG value of the mass squared and the cut point for rejection. The enhancement of the spectrum at the mass due to the background reactions is clearly visible. The solid histogram shows the expected spectrum for the background reaction of as generated by the MC simulation. The contamination from this reaction was reduced by requiring (GeV/c2)2. The expected spectrum from the signal of production is displayed as the dashed histogram. The acceptance of the cut for was estimated to be 85% by the MC.
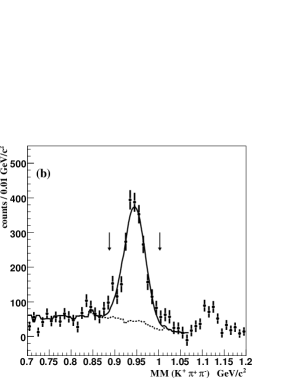
Neutrons in decay were identified from the missing mass of the reaction. Fig. 5 (b) shows for events which survived cut conditions (i) to (iii). A peak corresponding to the neutron mass is observed over a broad background. This background consists of events where a proton or a was misidentified as a by the LEPS spectrometer, and the distribution of these background events is shown as the dashed line in Fig. 5 (b). The contamination of this background into the neutron mass region was estimated to be 8%. The mass peak position and width obtained from a Gaussian fit were MeV/c2 and MeV/c2, respectively. The width was consistent with the expected value of 20 MeV/c2 but the mass peak was shifted slightly. Events within of the mass peak were kept for further analysis.
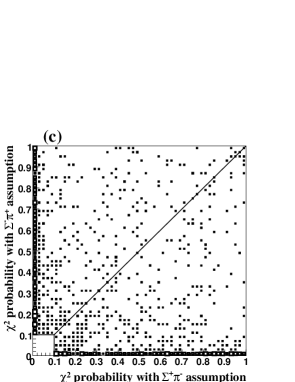
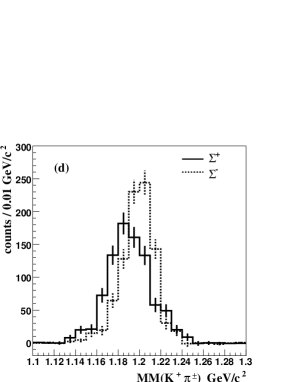
A kinematic fit with two constraints (C2-fit), and , was applied to purify the production events and to separate its and decay modes. The kinematic fit was applied twice for each event, once with the decay assumption and again with the decay assumption. Fig. 5 (c) shows the correlation of the probability of C2-fit between the assumption () and assumption () for events which survived the event selection criteria of (i) to (iv) and the cut ( or ). Events with a () pair should have larger values for the probability with the decay assumption than with the decay assumption. As shown in Fig. 5 (c), events with large and are exclusive. In this way, we could distinguish the two decay modes using the probability of the C2-fit. The decay events were selected by requiring and , whereas the decay events were selected by requiring and . The solid line in Fig. 5 (c) shows the boundary of the / selection cut. The misidentification rate of and using the above procedure was estimated to be 12% using MC simulation. The distributions of are shown in Fig. 5 (d). The solid histogram is and the dashed one is . The masses of and were determined via a Gaussian fit to the data to be MeV/c2 and MeV/c2, respectively. The measured widths of and were MeV/c2 and MeV/c2, and are consistent with the expected value of 17 MeV/c2 as estimated by MC.
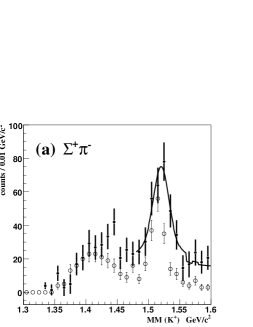
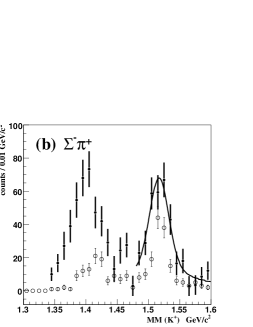
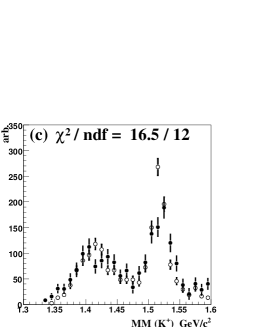
The measured spectra for the and modes were compared with each other and with spectra from a previous measurement Ahn2003 . In the previous measurement, both a and a charged pion were detected in the LEPS spectrometer. On the other hand, in this work, a was detected in the LEPS spectrometer, and two charged pions were measured by the TPC. Therefore, these two measurements differ in the angle between the and the pion. Fig. 6 (a) and (b) show the spectrum of after the and selection cuts, respectively. The spectra obtained by this work are shown as closed circles. Open circles show the unnormalized spectra from the previous measurement Ahn2003 . The peak visible in these spectra was fitted using a Breit-Wigner function atop the phase space distribution of nonresonant () production. The solid lines show the fit results. The mass peak positions are MeV/c2 in the decay mode and MeV/c2 in the decay mode. Thus, the mass of is consistent with the PDG value in each decay mode. The peak position of the in was consistent with the PDG value of 1405 MeV/c2. However, the peak structure in the mode was not clear. The decay mode dependence of the lineshapes of is likely due to strong interference between isospin 0 and 1 amplitudes of the interaction, as discussed in Ref. Nacher1999 . The apparent difference for the lineshape of the in the decay mode between the current work and the previous measurement will be discussed in the next section. The isospin interference term is canceled by summing the spectra of the and modes. The summed spectrum was obtained after correcting for the decay branch of (%), and the result is shown in Fig. 6 (c). Closed and open circles show the spectra measured by this work and by the previous one, respectively, where the normalization for the spectrum by the previous measurement was determined by fitting in the range of GeV/c2. The /ndf was 1.4. Thus, the lineshape of after the sum is consistent with the one from the previous measurement.
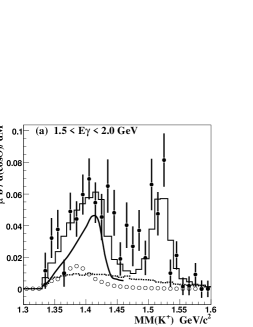
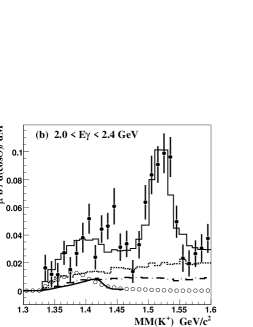
The yield of was extracted by fitting the theoretical spectrum of Nacher et al. Nacher1999 to the peak in the combined spectrum of the and modes. The combined spectrum is shown as closed circles in Fig. 7 for and two photon energy ranges: GeV (a) and GeV (b). The spectra were corrected for the detector acceptance and were normalized using the differential cross section of production measured from data set (I) Sumihama2006 in each photon energy bin. The spectra were fitted with the distribution for , and nonresonant () production as determined by MC simulation. The strength of each reaction was obtained by the fitting, with the assumption that the ratio of the yields of nonresonant () production in the two photon energy regions is proportional to the phase volume. The solid curves show the spectra of calculated by Nacher et al., and the dashed lines show the distribution for nonresonant () production. The contamination from () production was measured using the invariant mass distribution of () pairs in the GeV region, and the expected spectrum of () production generated by the MC simulation is shown as the dot-dashed line in Fig. 7 (b). The open circles show the spectrum of production with normalization determined from the yield found above. The fit results are shown as the solid histograms. The for the fits were 1.8 and 1.7 for photon energy of GeV and GeV, respectively. The theoretical spectrum of Nacher et al. is seen to be consistent with the experimental data in the low photon energy region. A second fit was performed using a different theoretical spectrum due to Kaiser et al. Kaiser1995 derived from an effective Lagrangian. The fit results didn’t change significantly, and this theoretical model is also seen to be consistent with the experimental data. In the high photon energy region, the lineshape of is unclear, and the yield of extracted by fitting depends on the estimation of the background reaction. A more conservative yield estimation will be discussed later.
After correcting for the detector acceptance and decay branches of the hyperon resonances, the production ratios of to were obtained as and for GeV and GeV, respectively. The systematic uncertainties due to the detection efficiency of the TPC, the target thickness and the number of photons were canceled out in the ratio.
Finally, the absolute values of the differential cross sections of and production off protons were measured from data set (I) using the production ratio of these two hyperons determined above. The event selection criteria were the same as for the analysis of the production reactions. Details can be found in Ref. Sumihama2006 . The angular coverage for forward going ’s was matched with that of data set (II) by selecting the overlapping region, .
Fig. 8 shows from the liquid hydrogen target for and the two photon energy ranges, GeV (a) and GeV (b) in data set (I). The experimental data (open circles) were fitted with distributions for (hatched), (dotted), (dot-dashed) and background reactions (dashed). The background reactions considered were nonresonant (), (), () and -meson production. The normalization factor of each background spectrum was determined by fitting, and the sum of these background spectra are shown. The spectral shape of was assumed to be the one of the theoretical calculation by Nacher et al. Nacher1999 . A linear background was introduced to explain the background events at the threshold of () production, 1.25 GeV/c2, where the contribution from production was negligible. These background events might be caused by the mismeasurement of the photon energy or the momentum or near threshold enhancement of () production which was not included in the MC simulation. The main systematic uncertainties due to this background were estimated to be % and % for GeV and GeV, respectively, by fitting with various slope parameters of the linear background and without the linear background. The other sources of systematic uncertainties are summarized in Table 2. The differential cross sections of production were found to be b and b for GeV and GeV, respectively. Those of production were b and b for GeV and GeV, respectively.
| The sources of uncertainties | GeV | GeV |
|---|---|---|
| Background around () threshold | % | % |
| The sources of uncertainties | GeV | |
| Thickness of the liquid H2 target | 1.0 % | |
| Number of photons | 1.2 % | |
| Photon transmission efficiency | 3.0 % | |
| Accidental veto by | ||
| the aerogel Čerenkov counter | 1.6 % | |
IV Discussion
The observed mass spectra of in mode and in mode shown in Fig. 6 are distinct, which is understood to be due to the interference between the isospin 0 and 1 amplitudes Nacher1999 . In addition, the lineshapes of in the decay mode measured by this work and by the previous work are different with each other as shown by the closed and open circles in Fig. 6 (b). The photon energy and the scattering angles of the were the same in these two measurements. However, the range of polar angles for the pion with respect to the momentum vector of the was quite different. In the previous measurement, both a and a charged pion were detected in the LEPS spectrometer. The direction of the is opposite to that of the in the center-of-mass frame, and thus, the direction of the pion relative to the , , is near 180 degrees. According to MC simulation, 90% of events fall in the range of . In this work, a was detected in the LEPS spectrometer and charged pions were measured in the TPC, which covers the side of the target and can access the entire range of . Thus, the angles of the momentum vector of the pion relative to the direction of the in the center-of-mass frame were distributed over a much wider range than in the previous measurement. Therefore, the difference of the lineshapes between the two measurements might be explained by an angular dependence of the interference term of the scattering amplitudes.
The production ratios of to and the differential cross sections for the photoproduction of these hyperon resonances were obtained for photon energies in the region near production threshold, GeV, and above, GeV, for scattering angles in the range . The production ratios of to were obtained as and for GeV and GeV, respectively. The production of decreased in the higher photon energy region with respect to that of . However, the spectrum of in the higher photon energy region was unclear (as shown in Fig. 7(b)), and the yield of found by fitting depends on the estimation of the strength of the background. To obtain a more conservative estimate, the integral of the invariant mass distribution was considered. First, the strength in the range of GeV/c2, including , and all background reactions, was compared in two photon energy bins. The ratios of this combined strength to production were and for GeV and GeV, respectively. The production cross section for slightly increases in the higher photon energy region, and the contributions of the () and () production also increase for higher photon energy as the phase volume increases. Therefore, even in the conservative estimation, the cross section of production should decrease remarkably. Next, in order to estimate the cross section of production, we subtracted the contamination of and production. Although the amplitude of production can interfere with these background amplitudes, we subtracted the square of and amplitudes because a theoretical model calculating such an interference term is not available. However, we note that the contribution of is not negligible even in the lower photon energy region, and a theoretical study of the interference with the p-wave amplitude is necessary. The ratios of the sum of and nonresonant production to production were and for GeV and GeV, respectively. Thus, the production of relative to is seen to decrease in in the higher photon energy region even without any specific knowledge of the contribution.
In order to gauge the effect of the form factor of , the momentum transfer was calculated in each photon energy region. The four momentum transfer, , was -0.22 (GeV)2 for photon energy of GeV and -0.20 (GeV)2 for GeV. The momentum transfer in the two photon energy bins is similar, so our measurement is not sensitive to the dependence of the cross section. Thus, the reduction of production is likely related to some other details of the production mechanism. The observed differential cross sections of photoproduction of b in the two photon energy bins are consistent with the effective Lagrangian calculation of Oh et al. Oh2007 (0.6-1.1 b). The differential cross section of production was obtained to be b in GeV and . Nacher et al. predicted the production cross section as b at GeV in . Although the angular dependence of the cross section is unknown, the order of magnitude of the production cross section is consistent with the theoretical prediction.
In summary, we have measured the photoproduction of the and hyperon resonances from the reaction in the photon energy of 1.5-2.4 GeV and in the polar angle range of . The production of was measured in the final state to which is prohibited to decay by isospin conservation. The hyperon was measured in the final state, where the contamination from was estimated from the () final state. The lineshapes of the in and mode were different, which indicates strong interference between isospin 0 and 1 amplitudes. The combined spectrum shape of the and modes, for which the interference term was canceled, was consistent with the theoretical calculation by Nacher et al. Nacher1999 and Kaiser et al. Kaiser1995 .
The production ratios of to were determined to be and for GeV and GeV, respectively. The ratio decreased in the higher photon energy region, which may suggest that the production mechanisms and form factors of photoproduction are largely different from those of .
The differential cross sections of and photoproduction were obtained in the two photon energy bins, GeV and GeV, and in the range of polar angle of . The observed differential cross sections were consistent with theoretical calculations in order of magnitude. However, in view of our limited statistics, further data are needed for more quantitative discussions, which will be available in future experiments at SPring-8/LEPS or TJNAF.
We thank the staff at SPring-8 for providing excellent experimental conditions during the experiment. We thank Dr. A. Hosaka, Dr. D. Jido and Dr. S.I. Nam for helpful discussion. This work was supported by the Grant-in-Aid for Scientific Research from the Ministry of Education, Culture, Science and Technology, Japan.

|

|

|

|

|

|
|
|
|
|
|
|
|
|
|

|

|
References
- (1) M.Q. Tran et al., Phys. Lett. B445, 20 (1998).
- (2) J.W.C. McNabb et al., Phys. Rev. C69, 042201 (2004).
- (3) K.-H. Glander et al., Eur. Phys. J. A19, 251 (2004).
- (4) M. Sumihama et al., Phys. Rev. C73, 035214 (2006).
- (5) S. Capstick and W.Roberts, Phys. Rev. D58, 074011 (1998).
- (6) N. Isgur and G. Karl, Phys. Rev. D18, 4187 (1978).
- (7) R.H. Dalitz, T.C. Wong and G. Rajasekaran, Phys. Rev. 153, 1617 (1967).
- (8) N. Kaiser, P.B. Siegel and W. Weise, Nucl. Phys. A594, 325 (1995).
- (9) J.C. Nacher, E. Oset, H. Toki and A. Ramos, Phys. Lett. B455, 55 (1999).
- (10) T. Inoue, Nucl. Phys. A790, 530 (2007).
- (11) R.H. Dalitz, Euro. Phys. J C15, 748 (2000) (PDG).
- (12) Y. Nemoto, N.Nakajima, H. Matsufuru and H. Suganuma, Phys. Rev. D68, 094505 (2003).
- (13) N. Ishii, T. Doi, M. Oka and H. Suganuma, Prog. Theor. Phys. Suppl. 168, 598 (2007).
- (14) D. Jido, J.A. Oller, E. Oset, A. Ramos and U.-G, Meissner, Nuc. Phys. A755, 669 (2005).
- (15) S. Prakhov et al., Phys. Rev. C70, 034605 (2004).
- (16) V.K. Magas, E. Oset and A. Ramos, Phys. Rev. Lett. 95, 052301 (2005).
- (17) D. Jido, A. Hosaka and S.I. Nam, private communication.
- (18) D.W. Thomas, A. Engler, H.E. Fisk and R.W. Kraemer Nucl. Phys. B56, 15 (1973).
- (19) R.J. Hemingway, Nucl. Phys. B253, 742 (1985).
- (20) I. Zychor et al., Phys. Lett. B 660, 167 (2008).
- (21) L. Guo and D.P. Weygand, hep-ex/0601010, in NSTAR05 Proceedings.
- (22) Cambridge bubble chamber group, Phys. Rev. 156, 1426 (1967).
- (23) R. Erbe et al., Phys. Rev. 188, 2060 (1969).
- (24) Y. Oh, C.M. Ko and K. Nakayama, Phys. Rev. C 77, 045204 (2008).
- (25) M.F.M. Lutz and M. Soyeur, Nucl. Phys. A748, 499 (2005).
- (26) T. Nakano et al., Nucl. Phys. A684, 71c (2001).
- (27) M. Niiyama et al., Nucl. Phys. A721, 1095c (2003).
- (28) J.K. Ahn et al., Nucl. Phys. A721, 715c (2003).