MEASUREMENTS OF -OSCILLATIONS AT THE TEVATRON
Measuring the oscillation frequency in the -meson system was one of the main goals in b-physics for the two experiments CDF and DØ at the Tevatron-Collider since the start of RunII in the year 2001. The DØ collaboration was the first experiment, which was able to give a two sided limit for the oscillation frequency of mesons. Shortly after the CDF collaboration confirmed this result and was able to give a measurement.
1 Introduction
The CKM matrix describes the relation between weak and flavor eigenstates of the quarks. One of the least known matrix elements is . It is accessible by studying the transition of neutral mesons to their anti-particles and vice versa. This behavior is also known as mixing. It is caused by the mass difference of the two mass eigenstates and . Since the first observation of flavor oscillations in the -system by the ARGUS collaboration this topic has been studied intensively and was well measured at the factories BaBar and Belle (PDG world-average: ). Theoretically the relation between and is given by:
| (1) |
Nonpertubative QCD effects are contained in , where is the meson decay constant and is the meson bag parameter. As there are large uncertainties in the order of 20% on these hadronic correction terms the determination of is not trivial. By measuring the mass differences and and calculating their ratio most of the uncertainties cancel out:
| (2) |
where has uncertainties in the order of 4%.
2 Detectors and Datasets
The Tevatron collider at the Fermi National Accelerator Laboratories is currently the only place worldwide to study mixing in the -system. Protons and Anti-Protons collide at =1.96 TeV with a bunch spacing of 396 ns.
2.1 The CDF II detector
The CDF II detector is described in detail elsewhere. Only parts relevant for the analysis presented will be described here. The tracking system resides in a 1.4 T axial magnetic field and consists of a silicon micro-strip detector surrounded by an open-cell wire drift chamber. The muon detectors are the central muon drift chambers, covering the pseudo-rapidity range and the extension muon drift chambers, covering , where the pseudo-rapidity is defined as and is the polar angle. The results presented correspond to an integrated luminosity of .
2.2 The DØ detector
The DØ detector is described in detail elsewhere. For the analysis presented here the excellent muon chamber coverage in pseudo-rapidity up to is advantageous and allows to collect large samples of semileptonic B decays. Besides that the central tracking system is one of the most important components. It consists of a silicon micro-strip tracker, a central fiber tracker and a 2 T solenoid magnet. The tracking system provides charged particle tracking up to . The DØ results are based on analyses using a dataset of an integrated luminosity of .
3 Physics Analysis
The -mesons are produced during the fragmentation process of pairs created in collisions. To measure the oscillation frequency the flavor at production time ( or ) has to be determined. After a short distance of flight the meson decays. Hadronic and semileptonic decays are reconstructed. It is mandatory to also know the flavor of the -meson at the decay vertex to determine, whether the meson has oscillated or not. The lifetime of the -meson can be obtained by measuring its decay length and momentum. With the help of these variables as input it is possible to do a likelihood fit and determine .
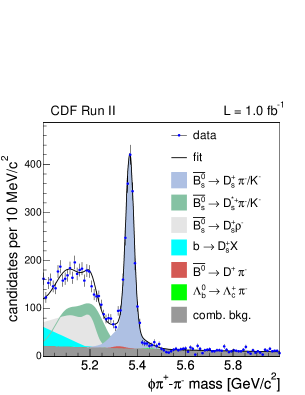
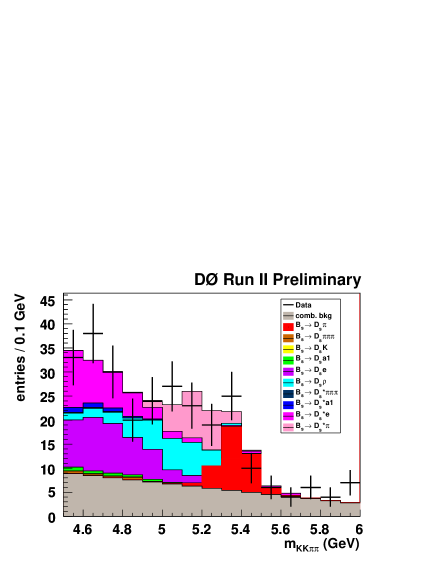
3.1 Event Selection
The analysis starts with the reconstruction of the final state of the meson (Figure 1). At DØ a cut based selection is used in combination with a likelihood selection to obtain the final candidates. The combination of all semileptonic channels analyzed results in 46.5k events and for the hadronic modes in events. The selection done by the CDF collaboration utilizes an artificial neural network. This results in 61.5k semileptonic, 5.6k fully reconstructed hadronic and 3.1k partially reconstructed hadronic events.
3.2 Flavor Tagging
Flavor Tagging is an important tool to determine the initial state of the meson, i.e. whether it is a or and thus to clarify whether it has oscillated or not. The tagging power is described by the combination of the two quantities efficiency and dilution. The efficiency is the fraction of reconstructed mesons, that are tagged, divided by the total number: . The dilution is given by , where the purity is given by the fraction of correctly tagged events divided by the total number of tagged events . The tagging is done by either observing the decay particles on the opposite side (OST: opposite side tagging) or by studying the decay side itself (SST: same side tagging). The DØ collaboration uses data to determine the tagging power and obtains a value of for OST and (semileptonic modes) for SST. No SST is used for the hadronic modes at DØ. The OST power of the CDF experiment is slightly smaller: . But for the SST an artificial neural network is used in CDF, which is trained with Monte Carlo samples and tested with samples. The tagging power for this technique exceeds the DØ method and results in for the hadronic modes and for the semileptonic modes.
3.3 Proper Decay Length Measurement
To determine the decay time the flight length in the transverse plane () and the momentum of the -meson has to be measured:
| (3) |
where is the measured transverse momentum determined through all detected particles in contrast to the true transverse momentum of the -meson . For fully reconstructed events the measured momentum is equal to the true momentum and so . The correction term for not fully reconstructed decays is determined through Monte Carlo studies.
4 Results and Conclusions
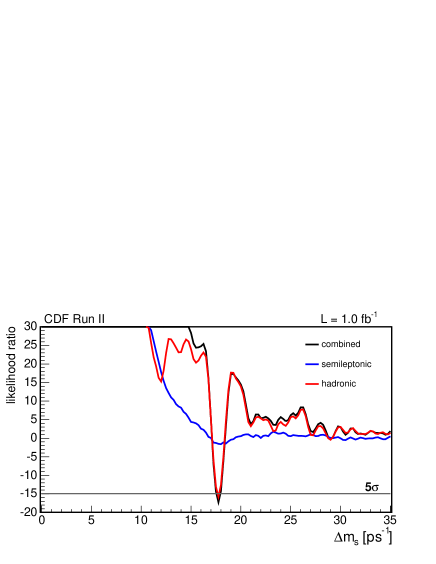
Using an integrated luminosity of the CDF collaboration measured the -oscillation frequency as
| (4) |
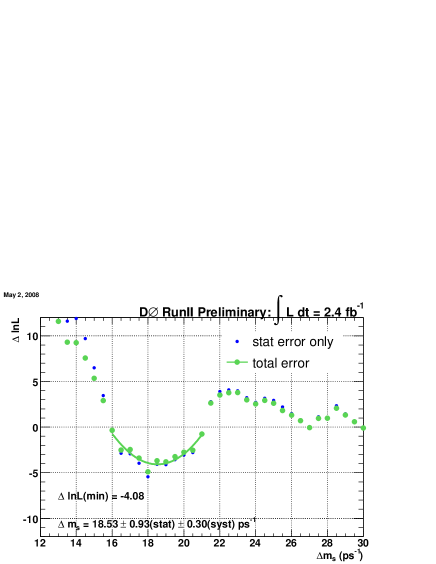
while the DØ experiment used a larger dataset of and obtained a value of
| (5) |
Figure 2 shows the distribution of as a function of for both experiments, where the lowest data point equals to the most probable value for .
Therefore the ratio can be calculated as
| (6) | |||||
| (7) |
The obtained values are now dominated by the theoretical uncertainties and in perfect agreement with the standard model predictions of . The present measurements exclude contributions of new physics amplitudes exceeding in size the standard model contributions.
Acknowledgments
I would like to thank the staff at Fermilab and collaborating institutions, and acknowledge support from the BMBF (under contract 05HA6UMA). Special thanks must be extended to the organizers of this pleasant conference.
References
References
- [1] V. M. Abazov et al. [D0 Collaboration], Phys. Rev. Lett. 97, 021802 (2006).
- [2] A. Abulencia et al. [CDF Collaboration], Phys. Rev. Lett. 97, 242003 (2006).
- [3] The DØ Collaboration, DØ note 5618 (2008).
- [4] W. M. Yao et al. [Particle Data Group], J. Phys. G 33, 1 (2006).
-
[5]
D. Acosta et al. [CDF Collaboration], Phys. Rev. D 71, 032001 (2005);
R. Blair et al. [CDF Collaboration], Fermilab Report No. FERMILABPUB96390E, 1996;
C. S. Hill et al., Nucl. Instrum. Methods Phys. Res., Sect. A 530, 1 (2004);
S. Cabrera et al., Nucl. Instrum. Methods Phys. Res., Sect. A 494, 416 (2002);
W. Ashmanskas et al., Nucl. Instrum. Methods Phys. Res., Sect. A 518, 532 (2004). - [6] V. M. Abazov et al. [D0 Collaboration], Nucl. Instrum. Methods A 565, 463 (2006).
- [7] M. Okamoto, PoS LAT2005, 013 (2006).