Tetrahedral clustering in molten lithium under pressure
Abstract
A series of electronic and structural transitions are predicted in molten lithium from first principles. A new phase with tetrahedral local order characteristic of bonded materials and poor electrical conductivity is found at pressures above 150 GPa and temperatures as high as 1000 K. Despite the lack of covalent bonding, weakly bound tetrahedral clusters with finite lifetimes are predicted to exist. The stabilization of this phase in lithium involves a unique mechanism of strong electron localization in interstitial regions and interactions among core electrons. The calculations provide evidence for anomalous melting above 20 GPa, with a melting temperature decreasing below 300 K, and point towards the existence of novel low-symmetry crystalline phases.
pacs:
62.50.-p,61.20.Ja,64.70.dj,71.22.+iThe properties of materials under high pressure can change in profound and unexpected ways. At ambient pressure () and temperature (), Li can be regarded as the prototype for an ideal metal. However, theoretical studies Neaton and Ashcroft (1999) have predicted that as a result of increased core-valence electron interactions, low- dense solid Li would undergo a series of symmetry-breaking transitions, culminating in a Li2-paired crystal with semi-metallic properties at pressures above 150 GPa. Besides the regular transition at 7.5 GPa from body-centered cubic () to face-centered cubic () structure Olinger and Shaner (1999), measurements to date Hanfland et al. (2000) have confirmed only an initial transition at 39 GPa from fcc to a less compact structure with a 16-atom cubic cell ( space group) via an intermediate disordered phase (). The existence and properties of even lower-coordinated structures at higher pressures remains an open question due to the lack of experimental data and difficulties associated with conclusive theoretical predictions of low-temperature thermodynamic crystalline stability.
It was shown recently Raty et al. (2007) that solid-solid transitions in Na are preceded by analogous changes in its liquid but at much lower pressure. Similar behavior was also suggested for other light alkalis. This raises the intriguing question, answered in what follows, of whether the existence of low-symmetry structures in Li Neaton and Ashcroft (1999); Hanfland et al. (2000); Ackland and McLeod (2004); Christensen and Novikov (2002); Rousseau et al. (2005) could be established by investigating its molten phase. Molecular dynamics simulations of liquids have the advantage of depending minimally on initial conditions and are not subject to the inherent bias of comparing a finite number of solid configurations. Finding low-coordinated structures in molecular dynamics simulations of a liquid, in addition to being remarkable in itself, would therefore constitute rather conclusive evidence for the existence of similar crystalline phases.
We have carried out first principles molecular dynamics (FPMD) simulation of liquid Li in the density range corresponding to (where , is the Bohr radius, the volume and the number of valence electrons) at temperatures up to 3000 K, and of the known crystalline phases: , , and , between 0 and 90 GPa. Density functional theory with a plane wave basis set and the Born-Oppenheimer approximation were used for all simulations dft . They were performed in the ensemble with cubic supercells and periodic boundary conditions. For the simulations of and solids, and all liquids we used 128 atom supercells with -point sampling of the Brillouin zone. Simulations of the solids were performed with 108 atoms and 8 -points (the -point only was found to be insufficient). Most simulations ran for at least 10 ps, with some up to 20 ps, while for obtaining the melting temperatures we have computations as long as 200 ps. Extensive convergence tests were carried out for size effects, various simulation parameters, and the validity of the pseudopotential approximation con . Good agreement was also obtained with existing liquid experimental data Lowenberg and Lodding (1967).
Results for the structural analysis of the liquid along a 1000 K isotherm are presented in Fig. 1. Initially, the first peak of the pair correlation function, , broadens (Fig. 1(a)) in a way previously observed in Na Raty et al. (2007). Upon further compression, it splits entirely, indicating significant further lowering in the coordination. For a more detailed analysis of the structure, we examine the evolution of neighbor distances with increasing density (Fig. 1(b)). While there is no indication for discontinuous liquid-liquid transitions, several distinct regions with different liquid structures can be identified, which correlate well with the electronic and melting properties discussed further below. These are: (i) ( GPa); (ii) (23 GPa GPa); and (iii) ( GPa). The initial changes are analogous to those observed in liquid Na Raty et al. (2007) - a transition from a -like to an -like local order in (i), followed in (ii) by lowering in the coordination (number of neighbors under the symmetrized first peak of ) to , and the liquid acquiring a -like local order.
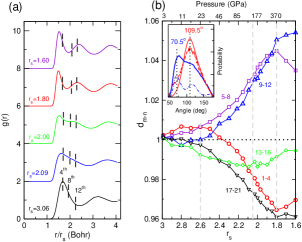
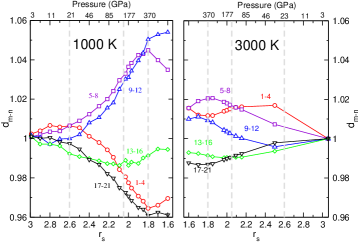
In (iii), the density-rescaled average distances to neighbors 1-4 continue to contract even faster, while the next eight, as well as 13-16, move away. As a result, by ( GPa), the first coordination shell completely splits in two, the coordination becomes only four and remains roughly so up to at least ( GPa). The distribution of angles among the nearest neighbors also becomes rather unexpected (inset in Fig. 1(b)) as it has a peak at 109.5o. The parallel with the liquids of materials with sp3 bonding is indeed striking when compared to the corresponding angle distribution in molten carbon, obtained by melting diamond at similar pressure (inset in Fig. 1(b)). Therefore, there is a large pressure range, 150 GPa 810 GPa, for which we predict that Li has tetrahedral local order, hitherto not seen in a liquid metal, but characteristic of semiconductor liquids with bonding.
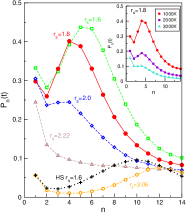
The apparent structural similarity with covalently bonded liquids has prompted us to investigate the persistence probability of Li clusters. For this purpose, we evaluate a function , which gives the statistical probability for the first nearest neighbours found around an atom at time to be the same as those found at time . For completely uncorrelated particles, would drop monotonically with increasing for any fixed . This is a result of the fact that the larger the cluster the more particles there are that can leave the cluster during any time interval. For the same reason, should be a decreasing function of for a sufficiently large even if there is some weak binding among the atoms. For example, if is the average probability for a given particle to leave a cluster during a time interval , then the survivor probability of that cluster is for large (and neglecting particles re-entering the cluster).
In order to study cases with weak metastability, the time chosen for the evaluation of should be sufficiently short such that results are non-trivial. The values of at which we have evaluated for each density are listed in the caption of Fig. 2. The ratios among them are roughly equal to the ratios of the periods of atomic vibrations at different densities, which have been estimated from a velocity autocorrelation analysis. This allows us to quantitatively compare the metastability of clusters for a range of densities, over which diffusion rates and vibrational properties differ significantly. As shown in Fig. 2, changes qualitatively when density is increased. The appearance of a peak at is evidence for a weak metastability of the tetrahedral clusters. To estimate the importance of caging effects Pilgrim and Morkel (2003), which could appear in a compressed liquid, we have also carried out simulations of hard-sphere liquids. The comparison with Li (Fig. 2) demonstrates that the peak in of Li is much higher, indicating significantly stronger interatomic correlations.
We now examine the changes in the electronic properties that are likely to drive the structural transitions. With increasing density, the DOS at the Fermi level gradually decreases ( Fig. 3(a)). A similar effect, interpreted as a Peierls symmetry breaking, was observed in liquid Na Raty et al. (2007), except that its strength in Li is stronger, which can be understood in terms of an increasing hardness of the effective repulsive potential; it is similar, for example, to the decreased amplitude of the distortion in crystalline Sb in comparison to crystalline As Gaspard et al. (1998). To interpret these changes and their likely consequences, we first look at the valence electron bandwidth (Fig. 3(b)). It increases with increasing density, es expeced upon densification. This tendency remains up to GPa (), which matches well the pressure range over which the liquid becomes more compact. Above this pressure, the bandwidth begins to decrease due to a development of partial (-character) bonding, which lowers the band-structure energy. The DOS develops a marked peak well below the Fermi level. This is also the range over which the coordination in the liquid begins to decrease. Finally, starting at GPa (), the valence band begins to broaden again, but the DOS at the Fermi level does not decrease much further. This density range coincides with the conditions under which the tetrahedral coordination develops.
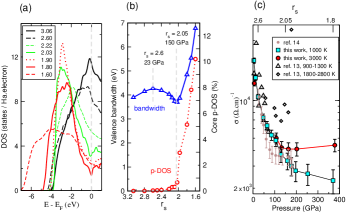
The consideration of valence electrons alone is clearly insufficient to understand the modifications occurring at GPa, which can be explained by examining the core electrons. Indeed, for ( GPa) the angular momentum character of the core electrons increases rapidly (Fig. 3(b)), indicating core-core overlap. At the same time, the volume available to the valence electrons, now squeezed into interstitial regions, decreases linearly with increasing density and hence the rapid increase of the valence bandwidth. The resulting ”anti-diamond” structure (inset in Fig. 5) is with ions forming a tetrahedral network, but the valence electrons occupying preferentially the voids of the diamond structure instead of being located between adjacent ions.
The electrical conductivity () of compressed liquid Li exhibits exactly the opposite and dependence usual for metals. Our computations el_ show that along the 1000 K isotherm it has nearly a 10-fold drop between 3 and 150 GPa. When heating the liquid to 3000 K near and above 250 GPa, there is about twofold increase in , but this increase vanishes at lower . These results are compared with measurements Fortov et al. (2001); Bastea and Bastea (2002) for which we now provide an explanation that is very different from what was originally proposed.
First, the electron localization and decrease of DOS at the Fermi level lead to a significant drop in with . Second, the above-mentioned electronic changes are closely related to structural transitions from a higher to a lower-coordinated liquid. This trend is reversed when heating the liquid at a constant ; it reverts to a more homogeneous local order (see Fig. 4) as favored by entropy. The result is an increase of with , as seen in our calculations above 150 GPa. This effect is of course countered by increased electron-ion scattering at high . At GPa, the two effects cancel, and at lower where the structural changes are less significant, the scattering effects dominate. This explanation for the observed changes in is different from what was previously suggested and we emphasize that the increase in conductivity observed at the highest- measurements by Fortov et al. Fortov et al. (2001)) is not a pressure but a temperature effect. Despite the fact that the latter data were obtained using a model equation of state to estimate the density, resistivity, and , the general trend of increased with at sufficiently high is consistent with our findings.
Finally, we compute the melting curve (Fig. 5) using a heat-until-melting approach, which provides an upper bound for the melting temperatures (). The method was shown Raty et al. (2007) to be valid for Na for reasons that are likely to hold for Li. The melting curve has a steep negative slope between roughly 20 and 80 GPa, with dropping from (680 25) K to (275 25) K. The shape of the melting curve above is relatively flat, which is consistent with a gradual transformation in the liquid from -like to -like local order. The solid is denser than and the melting slope above it initially increases, in accordance with the Clapeyron equation. The onset of symmetry breaking transitions lead to lowering of the liquid electronic band structure energy, its densification, and, hence, to the turnover of the melting curve above the phase. The maximum is near 20 GPa - exactly where we identified the onset of the changes towards lower coordination. The anomalous melting behavior persists until pressures where the solid also begins to undergo Peierls symmetry breaking transitions.
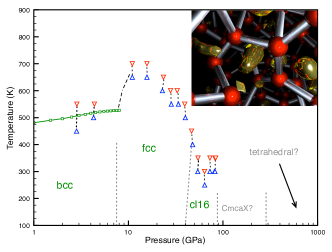
We have only computed the melting curve in the pressure range where the crystalline structures are well established. Above 100 GPa, (or even down to 70 GPa), they remain unsettled; previous suggestions include Neaton and Ashcroft (1999) and Rousseau et al. (2005). We propose that future investigations of low- crystalline phases of compressed Li focus on diamond-like tetrahedral structures. The appearance of such a phase, and especially its persistence at high , is completely unexpected. While the modifications in Li are initially driven by Peierls-like distortions, at higher they are determined by core-core electron interactions and valence electron localization (resulting from core-valence interactions). This behavior describes a distinct regime, likely present in other materials, where both valence and core electrons are responsible for chemical and physical properties. Such effects could have far reaching consequences in areas ranging from planetary modeling to the study of superconductivity under pressure Ashcrof (2002); Shimizu et al. (2002); Struzhkin et al. (2002); Deemyad and Schilling (2003); Christensen and D. L. Novikov (2001). Another interesting aspect is the possible implications of these results for the properties of dense hydrogen. It has been discussed Neaton and Ashcroft (1999); Martin (1999) that similarities between Li and H could be used to predict high-pressure phases, including superconductivity Ashcroft (1968), in metallic H.
Work supported by NSERC and CFI. Computational resources provided by ACEnet, IRM Dalhousie, Westgrid, and Sharcnet. I.T. acknowledges support by the Killam Trusts. We thank E. Schwegler, R. Redmer, A. Correa, M. Bastea, and V. E. Fortov for discussions.
References
- Neaton and Ashcroft (1999) J. B. Neaton and N. W. Ashcroft, Nature 400, 141 (1999).
- Olinger and Shaner (1999) B. Olinger and W. Shaner, Science 219, 1071 (1999).
- Hanfland et al. (2000) M. Hanfland, K. Syassen, N. E. Christensen, and D. L. Novikov, Nature 408, 174 (2000).
- Raty et al. (2007) J. Y. Raty, E. Schwegler, and S. A. Bonev, Nature 449, 448 (2007).
- Ackland and McLeod (2004) G. J. Ackland and I. R. McLeod, New J. of Phys. 6, 138 (2004).
- Christensen and Novikov (2002) N. E. Christensen and D. L. Novikov, J. Phys.: Condens. Matter 14, 10879 (2002).
- Rousseau et al. (2005) R. Rousseau, K. Uehara, D. D. Klug, and J. S. Tse, ChemPhysChem 6, 1703 (2005).
- (8) W. Kohn and L. J. Sham, Phys. Rev. 140, A1133 (1965). The FPMD simulations were performed with two codes. PWscf 21 (21) (with Troullier Martins pseudopotentials) was used used for some ( GPa) melting simulations while VASP vas (with all-electron PAW) for the rest. The valence only pseudopotential becomes inaccurate for . All reported results are valid within the Perdew, Burke, and Ernzerhof generalized gradient approximation (PBE-GGA).
- (9) For selected and , FPMD were carried out with 8 -points, with 256 atom cells and time steps up to 16 a.u. small (1 a.u. = 0.02419 fs). The validity of our PAW potential at extreme density was tested on isolated Li5 tetrahedral clusters by comparing with all-electron DFT-GGA (both PBE and B3LYP) calculations produced with the Gaussian quantum chemistry code 25 (25), using a ion potential. The quantity, which we compare is , where and are the energy and the shortest interatomic distance in the cluster, respectively. The error in pressure for Bohr, which corresponds to the first peak of for , is below 3%.
- Lowenberg and Lodding (1967) L. Lowenberg and A. Lodding, Z. Naturforsch. A 22, 2077 (1967).
- Correa et al. (2006) A. Correa, S. A. Bonev, and G. Galli, PNAS 103, 1204 (2006).
- Pilgrim and Morkel (2003) W. C. Pilgrim and C. Morkel, J. Phys. Chem. 217, 957 (2003).
- Gaspard et al. (1998) J. P. Gaspard, A. Pellegatti, F. Marinelli, and C. Bichara, Phil. Mag. B 77, 727 (1998).
- Fortov et al. (2001) V. E. Fortov et al., JETP Letters 74, 418 (2001).
- Bastea and Bastea (2002) M. Bastea and S. Bastea, Phys. Rev. B 64, 193104 (2002).
- (16) DOS and were computed with ABINIT Gonze et al. (2002), using an all-electron PAW pseudopotential within the PBE-GGA. The reported results are from calculations with 32 -points, but tests were made with up to 1000 -points, and independently checked with VASP. The Kubo-Greenwood formula was used to obtain .
- Luedemann and Kennedy (1968) H. Luedemann and C. Kennedy, J. of Geophysical Research 73, 2795 (1968).
- Boehler (1983) R. Boehler, Phys. Rev. B. 27, 6754 (1983).
- Ashcrof (2002) N. W. Ashcrof, Nature 419, 569 (2002).
- Shimizu et al. (2002) K. Shimizu et al., Nature 419, 597 (2002).
- Struzhkin et al. (2002) V. V. Struzhkin, M. I. Eremets, W. Gan, H. Mao, and R. J. Hemley, Science 298, 1213 (2002).
- Deemyad and Schilling (2003) S. Deemyad and J. S. Schilling, Phys. Rev. Lett. 91, 167001 (2003).
- Christensen and D. L. Novikov (2001) N. E. Christensen and D. D. L. Novikov, Phys. Rev. Lett. 86, 1861 (2001).
- Martin (1999) R. M. Martin, Nature 400, 117 (1999).
- Ashcroft (1968) N. W. Ashcroft, Phys. Rev. Lett. 21, 1748 (1968).
- (26) S. Baroni et al. (http://www.pwscf.org).
- (27) G. Kresse and J. Hafner, Phys. Rev. B 47, 558 (1993); Comp. Mat. Sci. 6, 15 (1996).
- (28) Gaussian 03, D.02, Gaussian, Inc., Wallingford CT, 2004.
- Gonze et al. (2002) X. Gonze et al., Comp. Mat. Sci. 25, 478 (2002).