Desiccation of a clay film: Cracking versus peeling
Supti Sadhukhan1, Janett Prehl2, Peter Blaudeck2, K. H. Hoffmann2, Tapati Dutta3
and Sujata Tarafdar4
1 Physics Department, Jogesh Chandra Chaudhuri College,
Kolkata 700033, India
2 Institut für Physik, Technische Universität, 09107 Chemnitz, Germany
3 Physics Department, St. Xavier’s College,
Kolkata 700016, India
4 Condensed Matter Physics Research Centre,
Physics Department, Jadavpur University,
Kolkata 700032, India
Abstract
Cracking and peeling of a layer of clay on desiccation has been
simulated using a spring model. A vertical section through the layer with finite thickness
is represented by a rectangular array of nodes connected by linear springs on a square lattice.
The effect of reduction of the natural length of the springs, which mimics the drying is studied.
Varying the strength of adhesion between sample and substrate and the rate of penetration of the
drying front produces an interesting phase diagram, showing cross-over from peeling to cracking
behavior. Changes in the number and width of cracks on varying the layer thickness is observed
to reproduce experimental reports.
PACS Nos: 61.43.Bn - molecular dynamics in structural modelling, 62.20.mt - structural
failure.
Formation of crack patterns in clay films is a familiar sight and is now a widely studied subject of research. Laboratory experiments [1, 2, 3, 4, 5, 6, 7], computer simulation and analytical studies [8, 9, 10, 11] and also observations in natural surroundings [12] have been reported in considerable detail. The present work is a spring model simulation, attempting to understand a different aspect of fracture of a film.
On drying, a thin layer of clay or a coating of paint may be observed to crack while remaining attached to the substrate, or alternatively it may ‘peel’ off the substrate first, instead of cracking. Which process dominates, depends on external factors such as the temperature and humidity, which determine the drying rate, as well as the strength of adhesion to the substrate and thickness of the layer. The present simulation investigates this angle of the desiccation problem. A molecular dynamics approach has been used to calculate the dynamics of the system under the forces due to Hookean springs arranged on a square lattice.
Our system is a rectangular array of points on a square lattice, of length and height representing a vertical section through the layer of clay. The nodes are connected by Hookean springs, initially having unit natural length. The lowest row of nodes represents the substrate. All vertical and horizontal springs have the same spring constant assumed to be unity in arbitrary units. All the springs except the lowest vertical row have a breaking threshold and break when the strain exceeds this value. The lowest row of vertical springs, connecting the sample to the substrate has a different threshold representing the adhesion between sample and substrate.
Desiccation is implemented through a reduction in the natural length of the springs, so that the system becomes strained. Desiccation starts at the top layer, since moisture evaporates from the surface. There are two time scales involved here - desiccation continues at the top layer at every timestep, with a magnitude decreasing successively and the desiccation is transmitted to the lower layer after timesteps. So, represents the fastest drying rate, when the interface between dry and saturated clay moves downward rapidly. can be increased to mimic a slower drying.
The shrinking due to drying decreases successively according to the following rule
| (1) |
represents the natural length of the drying spring at the th timestep. is normalized to at =0. has been assigned the value 0.05 and in this paper. When is large enough there is hardly any change in the subsequent natural lengths which saturates to a mimimum value . The parameters and , are chosen so that finally saturates to a value about 60-70% of . This is the amount of shrinking usually observed.
The molecular dynamics proceeds as follows. The th ‘layer’ of particles is defined as the th horizontal row of springs from the bottom, together with the adjacent th vertical row of springs. The topmost layer of course, consists only of horizontal springs. So the sample dries layer by layer, starting at the top. After the natural length of one layer is reduced, the system relaxes to its minimum energy configuration.
The force on each particle due to its neighboring springs is calculated and the maximum force on a particle noted.The force gives the acceleration for a paticle. A simplified form of Verlet’s algorithm is used, whence the particle at moves to given by
| (2) |
The time interval has to be chosen judiciously. This is the time after which the system is updated. If it is too small, a large number of intervals are required to make a finite timestep and the error for each interval accumulates to a considerable value. On the other hand, if the interval is too large, obviously the assumption of constant acceleration during this interval breaks down and results are not reliable. Here we find that assigning gives realistic results. After every , the maximum force on a particle is noted. If the maximum force for successive , the system is assumed to have relaxed completely. We then check whether the strain on any spring has exceeded the threshold, in which case it breaks. If a number of springs cross the threshold simultaneously, the one with the highest strain breaks. If again, there are more than one springs with the same highest strain, the central one is chosen to break. This situation arises sometimes at the first breaking, but it rarely arises later.
The molecular dynamics runs again, at the next timestep with the implementation of equation (1). This goes on until is reached.
For the row of lowest vertical springs, which attach the sample to the substrate there is in addition to breaking, a provision for horizontal slipping. A simple harmonic oscillator potential is assigned to this row of nodes. This tends to prevent motion of these nodes along the vertical axis. If the force along the horizontal direction exceeds the slipping threshold , then the relaxed position, within the allowed limit is determined by molecular dynamics.
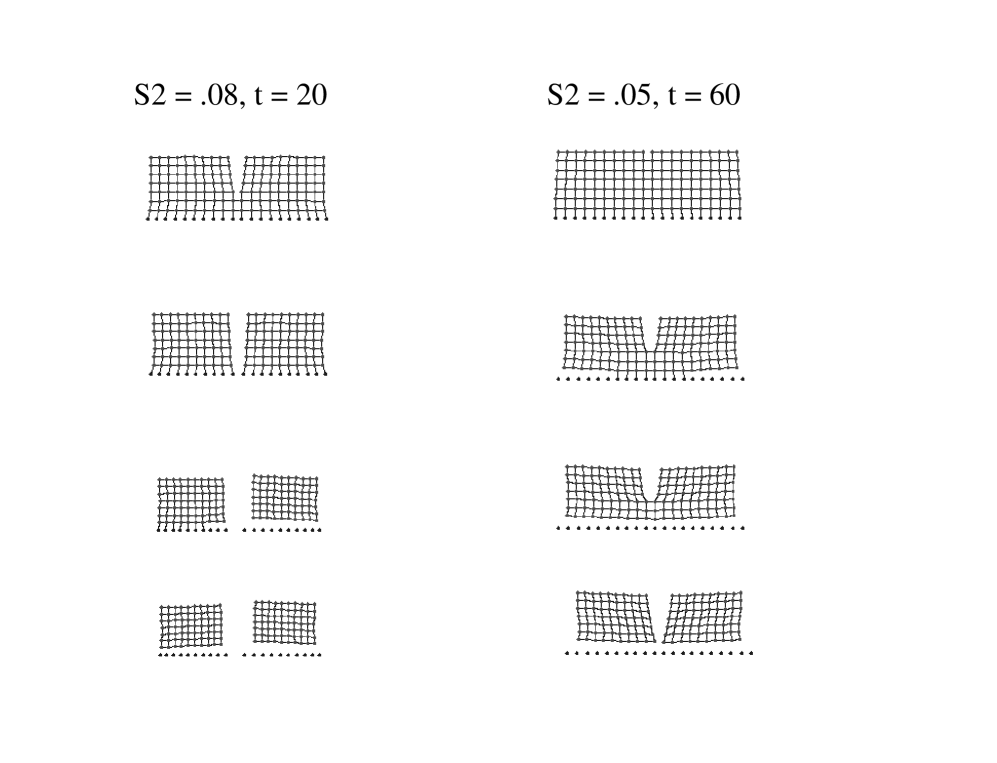
The subsequent desiccation is implemented, on the top layer (i.e. the th layer) for times before the desiccation is allowed to penetrate to the next lower layer, (i.e. the th layer). So when any given layer is undergoing the th drying step, the layer below it is in the th drying step. The whole process is continued until subsequent desiccations leave the natural length of the springs almost unchanged. We now consider the sample to be completely dry. The development of the sample is displayed graphically to note how its appearance changes and how cracking and peeling proceed. The timestep when the crack or peel completes is also noted. A crack completes when it breaks the system into two disjoint pieces and the peel completes when the sample is completely detached from the substrate. A crack may be vertical or horizontal. When the sample detaches from the lowest row of nodes, we term the process as peeling, whereas if it splits horizontally at any higher level we call it horizontal cracking.
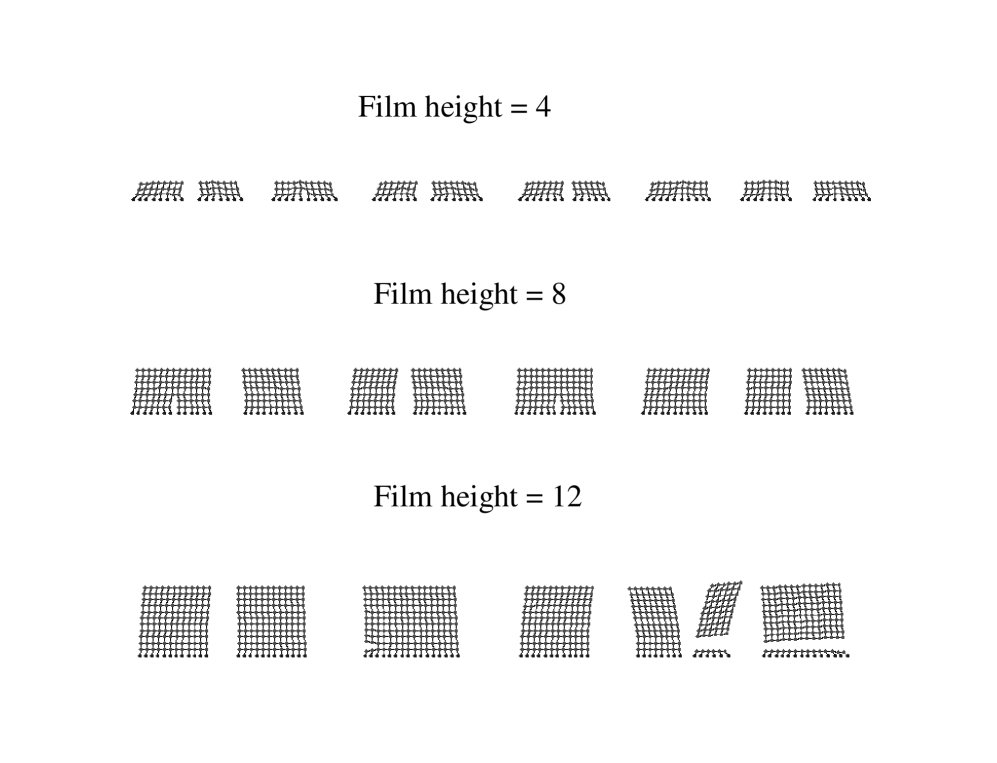
Molecular dynamics has been run with and for for a range of parameters varying from 0.02 to 0.5, with . However for , the crack pattern does not change. The time lag has been varied from 1 to 80. A small set of samples with has been run to produce several stages of hierarchical cracking with = 4,8,12 to observe the effect of changing sample thickness. The slipping threshold is either infinite (no slipping) or kept at 0.0001, to compare the results for a rough and a smooth substrate.
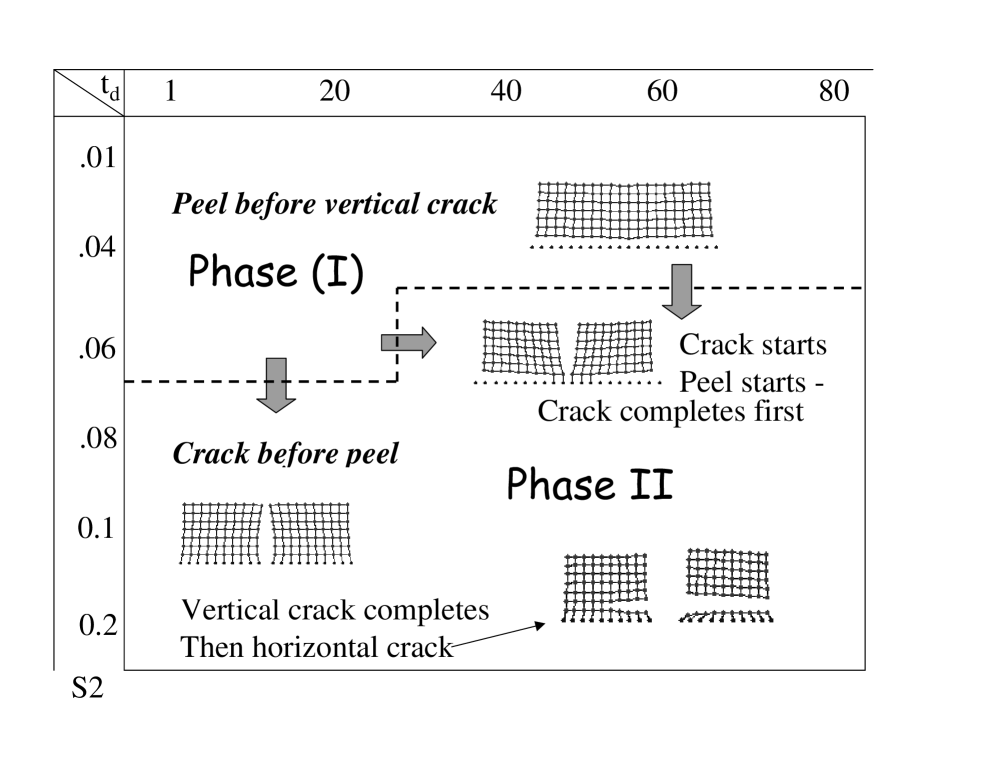
Figure 1 shows several stages of crack development in samples. The results for the full range of parameters are summarized in Figure 2. The effect of varying for the long samples is illustrated in Figure 3.
In Figure 1 we show two parameter sets, one of which cracks first and one which peels first. Here the slipping threshold is low, this is clearly evident in the left column, where we see the gap between the lowest nodes attached to the substrate has widened at the center. In the right hand column, where is smaller, peeling becomes easy because of low adhesion, so the sample peels without slipping or cracking.
The crack-peel variation over a wide range of parameters is summarized in the phase diagram in Figure 2. We find two transitions from peel to crack behavior, (i) as increases at low and (ii) as increases for certain constant values. The physics behind each is quite clear - in (i) as increases, adhesion to the substrate hinders peeling, making cracking more favourable. In (ii) large i.e. slow drying, allows the system to relax during desiccation, suppressing distortion of the upper layers which would tend to curl up. This prevents peeling and strain has to be relieved by cracking. Sometimes for , horizontal cracks also appear at large to accommodate vertical strain, since peeling from the substrate is virtually prohibited here. The crack profile is seen to taper from top to bottom or vice versa, depending on whether the crack starts at the top or bottom.
The cross-over regions indicated in Figure 2, change if the slip along the substrate is not allowed. We show the difference in cross-over regime for low and high slip threshold in table(1). There is also a change in the cross-over with for constant with sample size . For , the cross-over regime from peel-crack remained at for all . But no cross-over was observed on increasing at a constant . It would be iteresting to see if such a cross-over appears for .
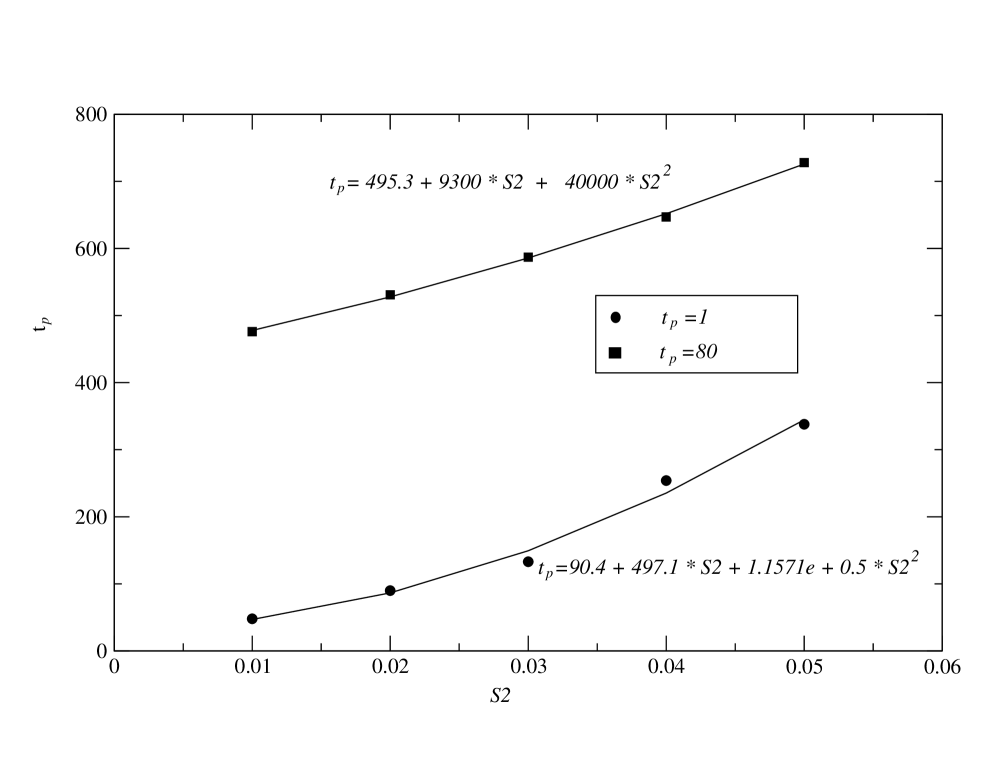
As increases for a given and the system approaches the transition from peel to crack, we observe that the number of time steps required for peeling to complete goes on increasing upto the cross-over. The variation in the time required for complete peeling , is plotted in Figure 4 for and . It is seen that the data points show a good fit to a quadratic curve with the form
| (3) |
Here A,B and C are constants. It is natural that the time to complete a process takes longer as a phase transition is approached, but we cannot explain the quadratic dependence at present. A further interesting observation is that the time for a vertical crack to complete , remains nearly constant as we move upwards from towards the cross-over point. We simulated desiccation of a series of samples of different thickness as well. The final desiccated samples are shown in Figure 3. A very well known feature of desiccation cracks is well reproduced here, thicker samples have less number of wider cracks compared to thin samples. For , the number of cracks is 9, for it is 7 and for it is only 6. The widths of cracks also decrease with , this has been reported in many experimental papers [2, 7].
Our results are realistic and this kind of behavior has been observed experimentally. In experiments on drying laponite peeling was found to occur, with peds getting completely detached from the substrate, when the desiccation was rapid due to low humidity (less than ) [7]. Quantitative studies of the effect of temperature and humidity under controlled conditions are yet to be done. Further, the parameters of the simulation must be related to physical properties of sample and substrate, such as the viscosity of the clay suspension, surface roughness of the substrate and other factors affecting adhesion, e.g. the dielectric constants of clay and substrate as well [13]. This will allow a precise comparison of the simulation results with experiments. But even with the present simplistic approach our results are highly interesting and realistic.
Earlier work [11] on Monte Carlo simulation of a quasi-1-dimensional system studied the variation of area covered by the cracks observed under different resolution of length scales for various substrates. This work covers a different aspect in a 2-dimensional system. We hope to extend this work further to simulate the top view of the crack pattern in future.
Acknowledgement SS sincerely thanks the DFG for funding a visit to Chemnitz. Authors are grateful to Shashwati Roy Majumder for helpful suggestions regarding the simulation. Some of the simulations have been run on IBM P690 at the Mobile Computing Centre, Jadavpur University.
| slip | no slip | |
| S2 | for cross-over | for cross-over |
| 0.04 | peel for all | peel for all |
| 0.05 | 75 ( simultaneous peel and crack) | peel for all |
| 0.06 | 30-31 (peelcrack) | 34-35 (peelcrack) |
| 0.07 | crack for all | crack for all |
| S2 for cross-over | S2 for cross-over | |
| 1 | 0.06-0.065 (peel-crack) | 0.065-0.07 (peel-crack) |
References
- [1] A. Groisman, E. Kaplan, Europhys. Lett. 25 (1994) 415
- [2] K.A. Shorlin,J.R. de Bruyn, Phys. Rev. E 61 (2000) 6950-6957
- [3] S. Bohn, J. Platkiewicz, B. Andreotti, M. Adda-Bedia, Y. Couder, 71 (2005), 046215
- [4] T.S. Komatsu, S. Sasa, J. Appl. Phys. 36 (1997) 391-395
- [5] D. Mal, S. Sinha, S. Mitra, S. Tarafdar, Physica A 346 (2005) 110-115
- [6] D. Mal, S. Sinha, S. Mitra, S. Tarafdar, Fractals 14 (2006) 283-288
- [7] D. Mal, S. Sinha, T. Dutta, S. Mitra, S. Tarafdar, J .Phys. Soc. Japan, 76 (2007) 014801(5 pages)
-
[8]
S. Kitsunezaki, Phys. Rev. E,60, (1999) 6449
-
[9]
H.Colina, L. Arcangelis, S. Roux, Phys. Rev. B, 48,
(1993), 3666
-
[10]
H. Colina, S. Roux, Eur.Phys. J. E ,
1, (2000), 189
-
[11]
S. Sadhukhan S; S.Roy Majumder , D. Mal, T. Dutta, S.Tarafdar, J. Phys. Condens.
Matter, 19, (2007) 356206
-
[12]
R. Weinberger, J. Struct. Geol., 21,(1999) 379
- [13] S. Sinha, T. Dutta and S. Tarafdar, Eur. Phys. J. E 25, (2008) 267 .