Detecting orbital angular momentum in radio signals
Abstract
Electromagnetic waves with an azimuthal phase shift are known to have a well defined orbital angular momentum. Different methods that allow for the detection of the angular momentum are proposed. For some, we discuss the required experimental setup and explore the range of applicability.
pacs:
42.50.Tx,07.57.-c,84.40.-x,95.85.BhI Introduction
It is known from Maxwell’s theory that electromagnetic (em) radiation carries angular momentum Abraham1914 which can typically be separated into spin and orbital angular momentum associated with polarization and spatial distribution, respectively. The photon spin angular momentum (PSAM) has routinely been used for several decades; and the progress in optical studies of photon orbital angular momentum (POAM) has been rapid since Heckenberg et al. Heckenberg1992b pointed out that laser modes with well-defined POAM can be readily produced and be detected via holograms. The POAM has been extensively used in atomic and molecular physics CohenTannoudji1998 . It has also been employed in quantum optical communication concepts Gibson2004 , for entangling photons Mair2001 , and for manipulating and orienting small particles trapped in optical tweezers Ladavac2004 . Meanwhile it has become impossible to list all applications; for reviews see Allen1999 ; Allen2002 ; Santamato2004 .
All reported experiments have in common that they superimpose phase singularities (vortices) in optical fields. In a plane perpendicular to the beam axis, the phases of the electric and magnetic vector fields have an dependence where is an integer and is the azimuthal angle. This means that for the phase fronts of beams are not planar but helical. As shown in Ref. Allen1992 , this implies that the beam carries an OAM of per photon; see also Ref. Harwit2003 . Because of destructive interference, the vortices appear as isolated dark spots and give rise to doughnut shaped beam profiles.
However, besides the enormous advantages that POAM offers, it has apparently never been used in the radio domain. Moreover, it was an open question until recently of how to emit, manipulate, and detect POAM of radio waves. All the methods that have successfully been applied in optics are practicably unfeasible in radio. For instance, scaling a hologram that fits within a few square millimeters for optical wavelengths, m, to one that is designed for radio waves, m, results in a hologram that covers several square kilometers in size.
The goal of the present paper is to highlight a number of possibilities that allow for the detection of POAM in radio. For some methods we discuss the required experimental setup and explore the range of applicability.
II Antenna arrays
Antenna arrays are capable of emitting radio beams with a well defined POAM as shown numerically in Thide2007 and analytically in Then2008 . An advantage of radio is that the phase of the em wave is directly accessible and that digital techniques are available for low frequencies (GHz) which allow to manipulate the POAM in software.
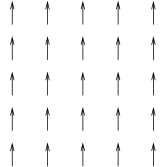
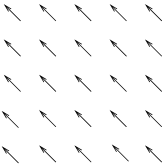
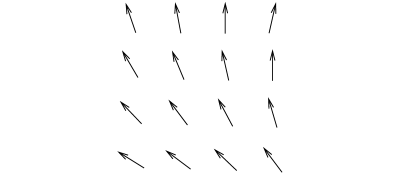
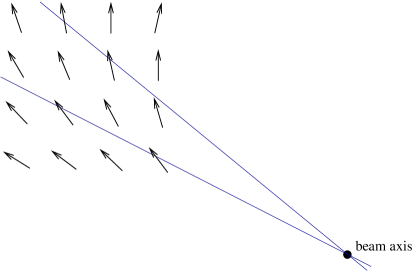
For a pure spin state, the handedness of the circular polarization is the same at any point in the upper half space, and hence, can be measured with a single tripole antenna. But the POAM is non-local and in order to detect it, one needs full knowledge of the azimuthal phase shift around the invariant beam axis. Figure 1 displays the instantaneous directions of the electric field vector of a radio wave with spin angular momentum across a antenna array, and Fig. 2 displays the instantaneous directions of a radio wave with spin and orbital angular momentum, and . Since the displayed beam is right circular polarized, , the direction of the instantaneous electric field vector can be identified with the local instantaneous phase of the em wave. In order to measure the POAM of the em wave that is displayed in Fig. 2 one needs at least three antennas that are phase correlated with each other Thide2005a ; Thide2005b .
III Direct torque measurement
The torque of the angular momentum flux can be measured with an absorber, e.g. a half sphere of graphite, that surrounds the antenna array, see Fig. 3. If the antenna array is directly over ground, the torque is where is the power that is radiated by the antenna array and is a constant depending on the reflectivities and the transmittances of the ground and the absorber Then2008 .

There are two ways to facilitate the experiment. Replacing the dipole antennas by resonant circuits with frequencies in the kHz range increases the torque, because the angular momentum is proportional to the inverse of the frequency. Instead of using a half-sphere for the absorber, a circular strip can be used that is smaller and that is located where the angular momentum density has its maximum, see Fig. 4.

IV Determining the angular momentum with an array of tripole antennas
Instead of measuring the torque directly, the electric and magnetic field distributions can be measured with an array of tripole antennas from which the angular momentum can be computed. Notice that if the linear momentum is non-zero, the angular momentum depends on the reference point . The related quantity , or momentum vorticity, does not have this problem. If vector and fields are measured in an array, can be computed using numerical discrete approximations of the differential.
Care has to be taken since the angular momentum is in the non-transversal field components. In the far field, the transversal components exceed the non-transversal components of the em field by far and the latter become hidden in the noise. However, even if the radial components become hidden, the angular momentum is transported unaltered all the way to infinity Abraham1914 . Hence, one needs other methods to measure the POAM, see e.g. the rotational Doppler shift or the Hanbury Brown and Twiss effect, further below.
Finally, we mention that the antenna array needs to cover a whole cross section of the beam requiring huge arrays, if the distance to the emitter becomes large. Consequently, better ways for detecting the POAM are explored, below.
V Holograms
In laboratory, holograms for radio waves are unfeasible; they are just too large. Nevertheless, they may become important for experiments in space. Just think of the spiral arms of a neighboring galaxy to form a diffractive optics, or the possibility to design dust jets by special flight patterns of rockets.
Holograms can replace antenna arrays. Instead of using an array for triangulating the phases of the field, see below, the beam vorticity can be converted by a hologram. With a single crossed dipole antenna that is located on the beam axis behind the hologram, it can be checked whether the topological charge of the incoming beam is compensated by the hologram’s vorticity.
We are nevertheless aware of the fact that holograms for em waves are experimentally challenging because of their large size and the fact that they need to be aligned with the beam axis.
VI Triangulation
The POAM can be detected by triangulating the electric field with an array of tripole antennas. If the azimuthal phase shift associated with the topological charge is known along a circle around the beam axis, the POAM can be read off, cf. Fig. 2. In the simplest setup this requires that the beam axis is on the antenna array and that the array extends out to the region where the doughnut shaped beam carries its intensity.
In a pure POAM state one can read off the POAM from the azimuthal phase shift directly. Any superposition of different POAM states is decomposed via a discrete Fourier transform of the azimuthal phase shifts Thide2007 .
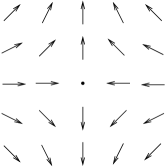
There is no guarantee that the axis of the incoming beam hits the antenna array. Typically, the beam axis misses the array and the antennas cover only a part of the doughnut shaped beam, see Fig. 5. Luckily, the phases of the em wave can be measured with high accuracy allowing for their extrapolation. This enables off axis measurements that are possible in radio only, but not in optics.
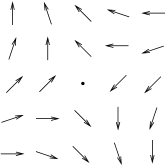
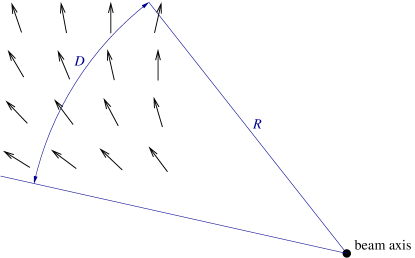
For simplifying the explanation, it is assumed that the incoming radio wave is in a pure POAM state. If the axis of the incoming radio beam is not centered on the antenna array, the extrapolation is carried out as follows: (i) One measures the relative phases of the field at each antenna of the finite size array, see Fig. 5. (ii) One finds lines of constant relative phases by interpolating the field over the finite size array, see Fig. 6. (iii) Extrapolating these lines far out until they cross in one point, one finds the beam axis. The distance from the antenna array to the beam axis is denoted by . (iv) A circle segment with radius and angle is covered by the antenna array, where is the diameter of the array, see Fig. 7. (v) Neglecting all errors in the geometrical construction, except of the uncertainty of the relative phase along the circle segment of angle , results in a multiple thereof, if extrapolated to the whole circle. This finally yields or as a lower limit for the uncertainty in the extrapolated value of the topological charge. The error one is confronted with in a real observation is indeed larger, because there is also the uncertainty in determining . Since the topological charge is integer valued, the uncertainty does not matter as long as it is less than . Off axis measurements allow to estimate large values of the topological charge up to with a moderate number of antennas along a circle segment of length .
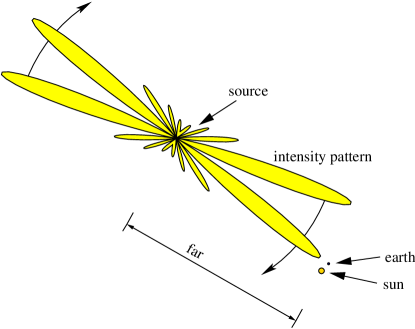
Note that in case the emitter is at an astronomical distance, i.e. extremely far away, the diameter of the antenna array that needs to cover a substantial part of the doughnut shaped beam profile is required to become giant, see Fig. 8. An earth bound antenna array, if compared to the size of the incoming radio signal, may be just like a local detector in one point that is capable of measuring the spin part of the angular momentum only.
The following example explains the situation more quantitatively. Consider a source at the distance of Sirius, , that emits a radio signal at the wavelength of the hydrogen line, , and that the emitting process shall take place on a circular ring with a diameter that is comparable with the size of our sun, , the diameter of the doughnut shaped beam mode takes roughly the size of which is comparable with the size of the earth. In this case the POAM can be detected if the relative phases of the incoming beam are triangulated across the whole surface of the earth. But if the distance to the source increases, if the wavelength becomes larger, or if the emitting process is in a smaller region, the limits of what is detectable with current techniques of triangulation are exceeded.
VII The lighthouse effect
If the incoming em waves are coherent and stationary, one can use a single tripole antenna to explore the electric field in space by moving the antenna around and recording the data. This allows for triangulation methods while using one single antenna only.
If the emitter rotates around an axis that differs from the beam axis, one does not need to move the antenna around, because the em fields themselves move across the detector. Let us call this effect the light house effect. Mapping the spatial azimuthal phase correlations to temporal phase correlations allows to detect the POAM of an arbitrary far distant source with a single dish telescope, see Fig. 8.
The key advantage of the light house effect is that it increases the “POAM baseline” of the telescope to an enormous size, depending on the coherence time but not on the physical size of the telescope.
VIII Radiation patterns
From the radiation pattern, i.e. the distribution of energy which can be measured in the far field, one can conclude via models of the emitting process whether the beam carries POAM. For instance, a doughnut shaped radiation pattern gives a strong hint that the topological charge should be non-zero. Since a model for the radiation process has to be assumed, the conclusion of POAM from radiation patterns is highly indirect and may also not be unique.
IX Rotational Doppler effect
Should the radio emitting object rotate fast and have sharp discrete lines in its emission spectrum, the angular momentum of the emitted em waves can be measured indirectly via shifts and splittings of the spectral lines. The shifts result from the rotational Doppler effect where is the projection of the rotation frequency onto the wave vector Courtial1998 . Decomposing into pure spin states, the discrete emission spectrum will be decomposed into one for and one for . These two spectra should almost coincide in their spectral lines, except for an overall shift. The relative overall shift between the two spectra is equal to twice the rotational frequency of the emitter. Once has been read off, one can search for spectral lines that are separated exactly by and integer multiples thereof. Each of these spectral lines corresponds to a specific POAM state Thide2007 .
X The Hanbury Brown and Twiss effect
Higher order quantum correlations in the temporal domain allow for intensity interferometry of light and em waves, as was found and demonstrated by Hanbury Brown and Twiss. The original derivation of Hanbury Brown and Twiss for their effect is valid, if the incoming radiation is in a pure quantum state. Different polarization states (spin) give an extra factor of one-half, see Hanbury Brown and Twiss Hanbury1957a , page 319, lines 7–17. That the em waves can also differ in state, because of POAM, has been overseen. The latter gives raise to another factor which depends on the geometry of the doughnut shaped beam, namely on how many doughnuts of individual POAM states overlap with each other at the detector.
XI Summary
Methods for the detection of POAM in the radio domain have now been proposed. Our list is not exhaustive and we understand it rather as a door opener to an unexplored area of fundamental physics. While some experiments are suitable to be conducted in a laboratory, e.g. the direct torque measurement, the triangulation of the phases of the em field requires large detectors. If the progress of the upcoming radio telescopes LOFAR lofar , LOIS lois , and SKA ska keeps on going, these telescopes will become in the future the natural candidates for systematically scanning the sky for POAM in radio via triangulating the electric field.
Acknowledgments
The authors thank Martin Harwit for useful discussions. In particular, it was him who first mentioned the Hanbury Brown and Twiss effect in connection with POAM. Part of the work was supported by the Centre for Dynamical Processes and Structure Formation, Uppsala University, Sweden.
References
- (1) M. Abraham, Physik. Zeitschr. XV, 914 (1914).
- (2) N. R. Heckenberg, R. McDuff, C. P. Smith, H. Rubinsztein-Dunlop, and M. J. Wegener, Opt. Quant. Electron. 24, S951 (1992).
- (3) C. N. Cohen-Tannoudji, Rev. Mod. Phys. 70, 707 (1998).
- (4) G. Gibson, J. Courtial, M. J. Padgett, M. Vasnetsov, V. Pas’ko, S. M. Barnett, S. Franke-Arnold, Opt. Express 12, 5448 (2004).
- (5) A. Mair, A. Vaziri, G. Weihs, and A. Zeilinger, Nature (London) 412, 313 (2001).
- (6) K. Ladavac and D. Grier, Opt. Express 12, 1144 (2004).
- (7) L. Allen, M. J. Padgett, and M. Babiker, Prog. Opt. 39, 291 (1999).
- (8) L. Allen, J. Opt. B 4, S1 (2002).
- (9) E. Santamato, Fortschr. Phys. 52, 1141 (2004).
- (10) L. Allen, M. W. Beijersbergen, R. J. C. Spreeuw, and J. P. Woerdman, Phys. Rev. A 45, 8185 (1992).
- (11) M. Harwit, Astrophys. J. 597, 1266 (2003).
- (12) B. Thidé, H. Then, J. Sjöholm, K. Palmer, J. Bergman, T. D. Carozzi, Ya. N. Istomin, N. H. Ibragimov, and R. Khamitova, Phys. Rev. Lett. 99, 087701 (2007).
- (13) H. Then, arXiv:0803.0200, (March 3, 2008).
- (14) B. Thidé, H. Then, J. Bergman, Y. Istomin, and N. Ibragimov, On the use of conserved EM field quantities in radio studies of space (in RVK05, Swedish National URSI Conference, Linköping, Sweden, 2005).
- (15) B. Thidé, H. Then, Y. Istomin, N. Ibragimov, J. Bergman, and R. Karlsson, The use of electromagnetic field symmetries in radio physics (in XXVIIIth URSI General Assembly, New Delhi, India, 2005).
- (16) J. Courtial, D. A. Robertson, K. Dholakia, L. Allen, and M. J. Padgett, Phys. Rev. Lett. 81, 4828 (1998).
- (17) R. Hanbury Brown and R. Q. Twiss, Proc. R. Soc. A 242, 300 (1957).
- (18) http://www.lofar.org/
- (19) http://www.lois-space.net/
- (20) http://www.skatelescope.org/