Properties of the Galactic population of cataclysmic variables in hard X-rays
We measure the spatial distribution and hard X-ray luminosity function of cataclysmic variables (CVs) using the INTEGRAL all-sky survey in the 17–60 keV energy band. The vast majority of the INTEGRAL detected CVs are intermediate polars with luminosities in the range – erg s-1. The scale height of the Galactic disk population of CVs is found to be pc. The CV luminosity function measured with INTEGRAL in hard X-rays is compatible with that previously determined at lower energies (3–20 keV) using a largely independent sample of sources detected by RXTE (located at as opposed to the INTEGRAL sample, strongly concentrated to the Galactic plane). The cumulative 17–60 keV luminosity density of CVs per unit stellar mass is found to be erg s-1 and is thus comparable to that of low-mass X-ray binaries in this energy band. Therefore, faint but numerous CVs are expected to provide an important contribution to the cumulative hard X-ray emission of galaxies.
Key Words.:
ISM: general – Galaxies: general – Galaxies: stellar conent – X-rays:diffuse background1 Introduction
The sky is much less studied in hard X-rays (20–50 keV) than at lower energies because of difficulties with detecting hard X-ray photons and, more importantly, due to the rapidly decreasing photon flux from cosmic sources with increasing energy. The largest existing catalogs comprise only about 400 hard X-ray sources (Krivonos et al. 2007b; Bird et al. 2007; Tueller et al. 2007). As a result, basic properties of different populations of hard X-ray sources, such as number density, luminosity function, spatial distribution, etc., are poorly known. Therefore, any sample of hard X-ray sources with well-defined statistical properties (such as that of Krivonos et al. 2007b) is of high value, since it allows one to study the parameters of source populations.
The scarceness of information about the Galactic populations of hard X-ray sources made it difficult to interprete the results of some hard X-ray observations. For example, a number of early experiments detected unresolved hard X-ray emission from the Galaxy and in particular from its central region, which was suggested to be truly diffuse emission arising from interaction of low-energy cosmic rays with the interstellar medium (e.g. Stecker 1977; Mandrou et al. 1980; Sacher & Schoenfelder 1984; Skibo & Ramaty 1993). However, the INTEGRAL observatory (Winkler et al. 2003) has recently resolved most of the Galactic hard X-ray emission at energies below keV into a number of luminous discrete sources (Lebrun et al. 2004). Furthemore, the remaning unresolved emission – the so-called Galactic ridge X-ray emission (GRXE) – has been shown to closely trace the stellar mass distribution in the Galaxy, suggesting that it might be composed of a large number of fainter stellar-type sources (Krivonos et al. 2007a).
For the stellar origin of the GXRE to be correct, the space density of faint Galactic hard X-ray sources must be sufficiently high to provide the required luminosity density. At energies above several keV, the main contribution to the GRXE is expected from cataclysmic variables (CVs), and more specifically from intermediate polars (IPs, Sazonov et al. 2006; Revnivtsev et al. 2006). Using the luminosity function of CVs measured in the 3–20 keV band (Sazonov et al. 2006) and assuming some fiducial shape of the spectrum of a generic intermediate polar, Revnivtsev et al. (2006) and Krivonos et al. (2007a) demonstrated that such sources can indeed produce all of the unresolved Galactic hard X-ray emission. Nonetheless, although the spectra of intermediate polars measured individually with INTEGRAL (see e.g. Revnivtsev et al. 2004a, b; Barlow et al. 2006) in general agree with the spectrum assumed by Krivonos et al. (2007a), it is still important to directly measure the cumulative luminosity density of CVs at energies higher than 20 keV.
In order to obtain direct estimates of the luminosity function and cumulative luminosity density of faint Galactic hard X-ray sources, we have analized results of the INTEGRAL all-sky survey (Krivonos et al. 2007b). Apart from low and high mass X-ray binaries, the INTEGRAL catalog contains Galactic sources of other types, mostly cataclysmic variables. The only non-CV faint Galactic sources in the INTEGRAL catalog are the symbiotic stars RT Cru and IGR J101095746/CD-57 3057 and the peculiar stars Gamma Cas and Eta Carinae. Because of the very small number of such sources, we do not consider them here and focus on studying the properies of CVs detected in hard X-rays.
2 The sample of sources
We selected all INTEGRAL sources from the catalog of Krivonos et al. (2007b) identified as cataclysmic variables. This sample ideally suits our puproses because it is based on an all-sky survey and serendipitous with respect to CVs (no deep INTEGRAL exposures were devoted to observations of CVs from the sample). We selected only those sources detected with more than significance on the all-time averaged map of the sky. The resulting sample, consisting of 15 intermediate polars and 1 dwarf nova, is presented in Table 1.


2.1 Source distances
Accurate distance estimates are not available for more than half of the sources in our sample, which presents a serious obstacle for constructing a CV luminosity function.
Usually, if the spectral type of the secondary star and the apparent brightness of a binary system are known, one can try to estimate its distance (e.g. Barnes & Evans 1976; Beuermann 2006; Knigge 2006). However, in the case of intermediate polars (which constitute the majority of our sample), the accuracy of this method is significantly affected by the fact that the optical light of an IP is produced not only by the secondary star (see e.g. Knigge 2006), but also by the accretion disk (see e.g. Beuermann et al. 2004) and white dwarf surface (e.g. Bonnet-Bidaud et al. 2001). Detailed spectroscopic information allows one in some cases to determine the contribution of the light of the companion star to the optical brightness of the binary (e.g. Watson et al. 1995; Bonnet-Bidaud et al. 2001; Gänsicke et al. 2005), but such information is not available for all CVs in our sample.
| Name | Type | Orb.per.(h) | D,pc | ||||||
|---|---|---|---|---|---|---|---|---|---|
| V709 Cas | 120.04 | -3.45 | IP | 5.34 | 3.91 | 2301 | 12.51 | 32.54 | |
| GK Per | 150.95 | -10.10 | IP | 47.9 | 1.82 | 4702 | 10.06 | 32.80 | |
| V1062 Tau | 178.08 | -10.31 | IP | 9.90 | 3.67 | 11003 | 13.24 | 33.87 | |
| IGR J14536-5522 | 319.74 | 3.46 | IP | 1.20 | (347)4 | 12.70 | 32.38 | ||
| IGR J15094-6649 | 315.92 | -7.49 | IP | 1.05 | (496)4 | 13.48 | 32.64 | ||
| NY Lup | 332.44 | 7.02 | IP | 9.86 | 4.10 | 6905 | 12.52 | 33.51 | |
| IGR J16167-4957 | 349.70 | 7.33 | IP | 1.45 | (546)4 | 13.76 | 32.86 | ||
| IGR J16500-3307 | 359.87 | 8.74 | IP | 1.12 | (552)4 | 13.71 | 32.76 | ||
| V2400 Oph | 359.86 | 8.74 | IP | 3.42 | 2.64 | (331)6 | 13.02 | 32.55 | |
| IGR J17195-4100 | 346.98 | -2.11 | IP | 1.92 | (217)4 | 11.69 | 32.18 | ||
| IGR J17303-0601 | 17.90 | 15.01 | IP | 15.4 | 3.54 | 33007 | 12.48 | 34.81 | |
| 4U 1849-31 | 4.96 | -14.35 | IP | 3.36 | 6.40 | 5108 | 12.64 | 33.44 | |
| RX J1940.2-1025 | 28.98 | -15.50 | IP | 3.36 | 2.32 | 2309 | 13.69 | 32.31 | |
| IGR J21237+4218 | 87.11 | -5.68 | IP | 7.48 | 1.03 | (1854)7 | 13.73 | 33.58 | |
| IGR J21335+5105 | 94.36 | -0.40 | IP | 7.19 | 3.15 | (995)7 | 13.45 | 33.88 | |
| SS Cyg | 90.56 | -7.11 | DN | 6.60 | 2.89 | 16610 | 8.29 | 32.12 |
-
(1)- Bonnet-Bidaud et al. (2001), (2)- Slavin, O’Brien, & Dunlop (1995), (3)-Patterson (1994), (4)- distance was calculated assuming -band absolute magnitude , (5) - de Martino et al. (2006), (6) based on period–hard X-ray luminosity correlation, (7) - Sazonov et al. (2006), based on Gänsicke et al. (2005), (8) - Beuermann et al. (2004), (9)-Watson et al. (1995), (10) - Bitner, Robinson, & Behr (2007)
| Name | D,pc | Orb. period, h | ||||
|---|---|---|---|---|---|---|
| mCrab | ||||||
| V709 Cas | 2301 | 5.34 | 3.91 | 32.54 | 12.51 | 5.70 |
| V1062 Tau | 11002 | 9.90 | 3.67 | 33.87 | 13.24 | 3.03 |
| NY Lup | 6903 | 9.86 | 4.10 | 33.51 | 12.53 | 3.33 |
| IGR J17303-0601 | 33004 | 15.4 | 3.54 | 34.81 | 12.49 | -0.11 |
| 4U 1849-31 | 5105 | 3.36 | 6.40 | 33.45 | 12.64 | 4.10 |
| RX J1940.2-1025 | 2306 | 3.36 | 2.32 | 32.31 | 13.70 | 6.89 |
In order to demonstrate the importance of the contribution of the accretion disk to the NIR emission of our IPs, we selected those sources with available distance estimates (Table 2). In all these 6 systems, the companion star belongs to the main sequence (we excluded here the IP with a giant companion GK Per and dwarf nova SS Cyg due to unclear correlation of its measured NIR brightness with the mass tranfer rate in the binary system, set by the orbital period) and therefore their absolute brightness can be related to their size.
The orbital period () of such systems can be used to estimate the radius of the secondary star () under the assumption that the star fills its Roche lobe:
Assuming the mass–radius relation for the late-type main sequence stars in CVs (e.g. Warner 1995; Smith & Dhillon 1998), we can write (Smith & Dhillon 1998), where the orbital period is measured in hours. In Fig. 1 we compare the expected dependence (using Baraffe et al. 1998) of the absolute -band brightness of the secondary star on binary system period with the measured values for our CVs with known distances. We see that while for some sources the observed and predicted -band absolute magnitudes agree within one magnitude, other sources are significantly brighter in the near-infrared than expected.
This deviation results from the unaccounted contribution of emission from the accretion disk in the binary system. Indeed, our sources demonstrate a good correlation of absolute -band brightness with hard X-ray luminosity (see Fig. 1, middle panel). The linear fit to the observed correlation gives:
where is the source hard X-ray (17–60 keV) luminosity111Due to the relatively narrow range of spectral shapes of IPs in the hard X-ray energy band (see e.g. Suleimanov, Revnivtsev, & Ritter 2005), the hard X-ray luminosity might be considered a proxy of the source bolometric luminosity or mass accretion rate. in units of erg s-1 .
This correlation is partly caused by the direct contribution of accretion disk emission to the optical and near-infrared light of the binary. Another contributor to this correlation is the anticipated dependence of the mass accretion rate in IPs on the orbital period due to enhanced magnetic stellar wind braking in binaries with larger optical stars (Skumanich 1972; Rappaport, Verbunt, & Joss 1983; Patterson 1984; Postnov & Kuranov 2005). Therefore, one can significantly underestimate the absolute near-infrared brightness and distance of an IP if no allownace is made for the X-ray luminosity.
On the other hand, we can use the – correlation calibrated on our 6 CVs with known distances to predict hard X-ray luminosities and distances for other CVs from the INTEGRAL sample. The power-law slope of the empirical fit to the observed luminosity (mass-accretion rate)–orbital period correlation (Fig. 1, lower panel),
agrees with previous empirical (see e.g. Patterson 1984) and theoretical estimates (e.g. Postnov & Kuranov 2005), indicating that this dependence is physically motivated.
We used the above empirical correlation to estimate the distances to those sources in our sample with measured orbital periods. For the remaning systems we made a rough estimate of their distance assuming . Although this assumption is certainly inaccurate (though reasonable), it should not dramatically affect our analysis. For example, if instead of we assumed or , the resulting value of the cumulative luminosity density of CVs would change by less than a factor of 1.5. Nevertheless, one should keep in mind that since the distances are not known with adequate accuracy for all sources in the sample, all the properties of the Galactic CV population estimated below contain systematic uncertainties in addition to pure statistical ones.
3 Spatial distribution
Cataclysmic variables are not uniformly distributed around the Sun. Being relatively old stellar systems, they are concentrated towards the Galactic plane: , where is the height above the Galactic plane. The typical scale height of the distribution of late-type stars in the Galaxy is 120–150 pc. Existing estimates for CVs fall into this range (e.g. Patterson 1984; Ak et al. 2008). We do not consider here the Galactocentric dependence of the CV distribution, since it only becomes important at distances larger than 1.5–2 kpc from the Sun and all of our sources except for one are located closer (we exclude this source, IGR J173030601, from the following determination of the scale height of the CV spatial density distribution).

Using our INTEGRAL sample of sources derived from an all-sky survey we can make our own estimate of the scale height of the Galactic disk population of CVs. To this end, we constructed a maximum likelihood estimator of the scale height . The probability for a source to lie at distance from the Galactic plane depends on : . For each CV from the sample, we calculated the maximum distance in a given direction to which the source is detectable by the survey. The shape of the resulting volume sampled by the survey over the whole sky was then taken into account in calculating the probability of source to lie at height : . The sum of the logarithms of such probabililities for all the sources in the sample (except for IGR J173030601) defines our maximum likelihood estimator: .
The dependence of the value on is shown in Fig. 2. The best-fit value of the scale height is 130 pc, with the 68% confidence interval of 84–223 pc. This agrees with previous estimates of the CV scale height (e.g. Patterson 1984; Ak et al. 2008), suggesting that most of our source distance estimates are reasonable.
Since the value estimated above has a relatively large uncertainty, we adopt pc for estimating the CV luminosity function below.
4 Luminosity function
We employed the method (Schmidt 1968) to construct the hard X-ray luminosity function of CVs detected by the INTEGRAL all-sky survey.
To take into account the inhomogeneous distribution of sources around the Sun, we weight the standard volume found for each small solid angle (at Galactic latitude ) of the survey by the space density of sources integrated over and over distance from 0 to , the maximum distance at which a given source can be detected. This, for an exponential distribution of sources, , leads to a generic volume (Tinney et al. 1993; Schwope et al. 2002; Sazonov et al. 2006)
where . Each sampled source thus contributes to the estimated space density and to the associated variance, where the sum is taken over the total solid angle of the survey. As noted above, we adopt the scale height pc in our analysis.

The luminosity function of CVs detected by INTEGRAL is presented in Fig. 3. It was normalized to the local stellar density /pc3 (Jahreiß & Wielen 1997). We present 95% () upper limits on the space density of CVs in the – and – erg s-1 luminosity intervals, where we have 0 and 1 sources, respectively.
The integrated space density of CVs with hard X-ray luminosity erg s-1 is .
It is important to note here that at present the INTEGRAL all-sky survey catalog (Krivonos et al. 2007b) has significant incompleteness due to the unknown nature of a number of sources: 25 persistent sources still do not have secure identifications. However, most of these sources reside very close to the Galactic plane and many of them are likely high-mass X-ray binaries, rather than CVs considered here.

If there were significant incompleteness in our CV sample, it would manifest itself in the observed distribution of CVs over the sky. We therefore calculated the expected numbers of CVs in 5-deg wide Galactic latitude bins assuming the exponential density distribution and luminosity function pc-3 (at erg s-1), and taking into account the sensitivity map of the survey. Comparison of the observed and expected distributions (Fig. 4) suggests that our CV sample is not strongly incomplete.
We can also make more quantitative assessment of possible sample incompleteness on our results. In Fig. 3 we show the luminosity function constructed from the CVs detected away from the Galactic plane (), where the INTEGRAL all-sky survey catalog is highly complete (2 unidentified sources vs. 12 CVs). The good agreement of this luminosity function with the all-sky one indicates that our determination is robust.
4.1 Comparison with the luminosity function of CVs detected by the RXTE all-sky survey
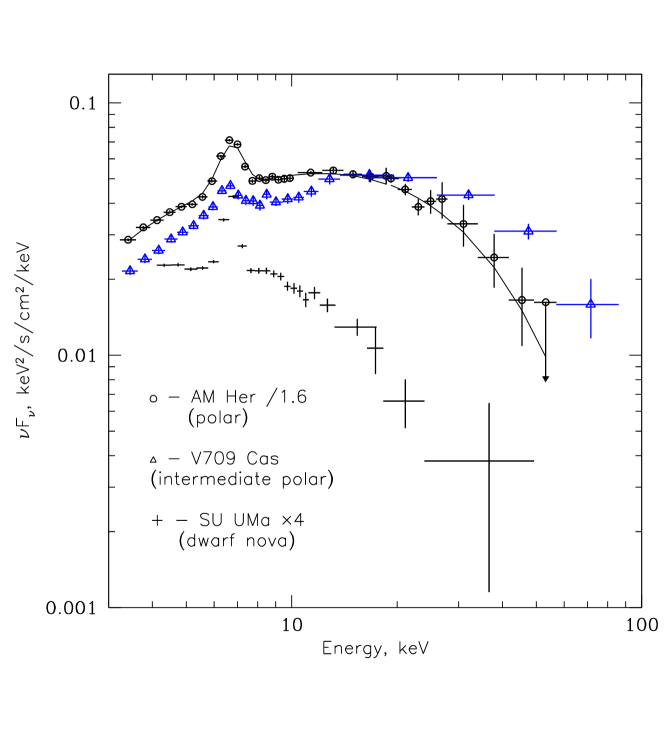
The previous measurement of the spatial distribution and X-ray luminosity function of accreting white dwarfs was done using the RXTE slew survey at in the energy band 3–20 keV (Sazonov et al. 2006). We might expect that the harder energy band of the INTEGRAL survey should lead to preferential selection of the hardest sources among all sub-classes of CVs. Indeed, in our current INTEGRAL sample of sources the vast majority are intermediate polars, which are known to be the hardest of all CVs (see e.g. Sazonov et al. 2006 and Fig. 5).
The broadband (1–100 keV) spectra of IPs are typically so hard (see e.g. Suleimanov, Revnivtsev, & Ritter 2005) that the luminosities emitted in the 3–20 and 17–60 keV energy bands are similar. The ratio of luminosities in these bands does have some scatter but is typically 0.6–0.9. Therefore, by dividing the luminosities of IPs measured by INTEGRAL in the 17–60 keV by this coefficient we can compare the CV luminosity function derived in this work with that determined with RXTE in the 3–20 keV energy band (Sazonov et al. 2006).
The result of this comparison is shown in Fig. 6. There is good agreement between the INTEGRAL and RXTE luminosity functions at luminosities erg s-1, where most of CVs are intermediate polars. At lower luminosities, other subclasses of CVs become numerous, but due to their relatively soft spectra such sources are practically absent in the INTEGRAL (hard X-ray selected) sample.

5 Hard X-ray luminosity density of CVs
Using the same method we can also estimate the cumulative hard X-ray emissivity of CVs:
We find that the cumulative 17–60 keV emissivity of CVs with erg s-1 per unit stellar mass is erg s-1 . Fig. 7 shows the cumulative emissivity as a function of the threshold luminosity.
The obtained value of the CV cumulative emissivity is in remarkably good agreement with the emissivity of the unresolved hard X-ray emission observed by INTEGRAL from the Galactic plane region: erg s-1 (Krivonos et al. 2007a), suggesting that this emission is mostly the superposition of numerous cataclysmic variables.

6 Broadband hard X-ray luminosity function of the old stellar population in the Milky Way

It has been known since early observations with focusing X-ray telescopes that the cumulative emission of bright ( erg s-1) discrete sources constitutes a significant fraction of the total X-ray emission of galaxies (Trinchieri & Fabbiano 1985). This is especially true for energies 2–3 keV, at which emission from hot interstellar gas cannot contribite significantly even in gas rich galaxies because typical gas temperatures are keV. Therefore, it is often assumed that most of the hard X-ray emission of galaxies is provided by low- and high-mass X-ray binaries, while the contribution of weaker sources is usually neglected.
However, as we have shown in the previous section, CVs are expected to produce a hard X-ray emissivity comparable to that generated by brighter sources – low-mass X-ray binaries. The same was previously suggested by Krivonos et al. (2007a) based on a study of the Galactic bulge with INTEGRAL in which the luminosity of the unresolved hard X-ray emission was found to be comparable to the cumulative luminosity of bright resolved sources. We therefore construct below the combined hard X-ray luminosity function of CVs and LMXBs.
In Fig. 8 we present the luminosity function of CVs and LMXBs in the 17–60 keV energy band based on INTEGRAL data analysed in the present paper and in Revnivtsev et al. (2008). This plot demonstrates that the cumulative hard X-ray luminosity density of LMXBs is only marginally larger than that of CVs.
This ratio of the cumulative emissivities of LMXBs and CVs in the hard X-ray band is significantly smaller than in the standard X-ray band (2–10 keV) see e.g. Sazonov et al. 2006). The major reason for this is that the brightest LMXBs ( erg s-1 in the 2–10 keV band) which provide the majority of cumulative emissivity of LMXBs have very soft spectra and thus emit only a small fraction of their total emission in hard X-rays. At the same time, luminous CVs emit almost the same fraction of their bolometric luminosity in standard and hard X-rays.
7 Conclusions
We have studied a sample CVs detected in the hard X-ray band (17–60 keV) by the INTEGRAL all-sky survey. This sample is one of the largest unbiased samples of luminous intermediate polars existing today.
Our findings are:
-
1.
The scale height of the Galactic disk distribution of CVs is pc.
-
2.
We have measured the luminosity function of CVs in the 17–60 keV energy band. The space density of CVs with luminosities erg s-1 is .
-
3.
The luminosity density of CVs with luminosities erg s-1 is erg s-1 . This value is in remarkably good agreement with the emissivity of the unresolved (with INTEGRAL) hard X-ray emission in the Galactic plane region.
We emphasize that all our estimates depend on the accuracy of the distance determination for our sources. Therefore, the current lack of accurate distances for a number of sources from the sample introduces additional (not included in the errors quoted above) uncertainties in the measured parameters of the Galactic population of cataclysmic variables.
Acknowledgements.
This research made use of data obtained from the High Energy Astrophysics Science Archive Research Center Online Service, provided by the NASA/Goddard Space Flight Center. This work was supported by DFG-Schwerpunktprogramme (SPP 1177)References
- Ak et al. (2008) Ak T., Bilir S., Ak S., Eker Z., 2008, NewA, 13, 133
- Baraffe et al. (1998) Baraffe I., Chabrier G., Allard F., Hauschildt P. H., 1998, A&A, 337, 403
- Barlow et al. (2006) Barlow E. J., Knigge C., Bird A. J., J Dean A., Clark D. J., Hill A. B., Molina M., Sguera V., 2006, MNRAS, 372, 224
- Barnes & Evans (1976) Barnes T. G., Evans D. S., 1976, MNRAS, 174, 489
- Beuermann et al. (2004) Beuermann K., Harrison T. E., McArthur B. E., Benedict G. F., Gänsicke B. T., 2004, A&A, 419, 291
- Beuermann (2006) Beuermann K., 2006, A&A, 460, 783
- Bird et al. (2007) Bird A. J., et al., 2007, ApJS, 170, 175
- Bitner, Robinson, & Behr (2007) Bitner M. A., Robinson E. L., Behr B. B., 2007, ApJ, 662, 564
- Bonnet-Bidaud et al. (2001) Bonnet-Bidaud J. M., Mouchet M., de Martino D., Matt G., Motch C., 2001, A&A, 374, 1003
- de Martino et al. (2006) de Martino D., Bonnet-Bidaud J.-M., Mouchet M., Gänsicke B. T., Haberl F., Motch C., 2006, A&A, 449, 1151
- Gänsicke et al. (2005) Gänsicke B. T., et al., 2005, MNRAS, 361, 141
- Jahreiß & Wielen (1997) Jahreiß, H., & Wielen, R. 1997, ESA SP-402: Hipparcos – Venice ’97, 402, 675
- Lebrun et al. (2004) Lebrun F., et al., 2004, Natur, 428
- Knigge (2006) Knigge C., 2006, MNRAS, 373, 484
- Krivonos et al. (2007a) Krivonos R., Revnivtsev M., Churazov E., Sazonov S., Grebenev S., Sunyaev R., 2007a, A&A, 463, 957
- Krivonos et al. (2007b) Krivonos R., Revnivtsev M., Lutovinov A., Sazonov S., Churazov E., Sunyaev R., 2007b, A&A, 475, 775
- Mandrou et al. (1980) Mandrou P., Bui-van A., Vedrenne G., Niel M., 1980, ApJ, 237, 424
- Masetti et al. (2006) Masetti N., et al., 2006, A&A, 459, 21
- Masetti et al. (2008) Masetti N., et al., 2008, arXiv, 802, arXiv:0802.0988
- Patterson (1984) Patterson J., 1984, ApJS, 54, 443
- Patterson (1994) Patterson J., 1994, PASP, 106, 209
- Postnov & Kuranov (2005) Postnov K. A., Kuranov A. G., 2005, AstL, 31, 7
- Rappaport, Verbunt, & Joss (1983) Rappaport S., Verbunt F., Joss P. C., 1983, ApJ, 275, 713
- Revnivtsev et al. (2004a) Revnivtsev M. G., Lutovinov A. A., Suleimanov B. F., Molkov S. V., Sunyaev R. A., 2004a, AstL, 30, 772
- Revnivtsev et al. (2004b) Revnivtsev M., Lutovinov A., Suleimanov V., Sunyaev R., Zheleznyakov V., 2004b, A&A, 426, 253
- Revnivtsev et al. (2006) Revnivtsev M., Sazonov S., Gilfanov M., Churazov E., Sunyaev R., 2006, A&A, 452, 169
- Revnivtsev et al. (2008) Revnivtsev M., A.Lutovinov, E.Churazov, S.Sazonov, M.Gilfanov, S.Grebenev, R.Sunyaev, 2008, arXiv:0805.0259
- Sacher & Schoenfelder (1984) Sacher W., Schoenfelder V., 1984, ApJ, 279, 817
- Sazonov et al. (2006) Sazonov S., Revnivtsev M., Gilfanov M., Churazov E., Sunyaev R., 2006, A&A, 450, 117
- Schmidt (1968) Schmidt, M. 1968, ApJ, 151, 393
- Schwope et al. (2002) Schwope, A.D., Brunner, H., Buckley, D., Greiner, J., Heyden, K.v.d., Neizvestny, S., Potter, S., & Schwarz, R. 2002, A&A, 396, 895
- Skibo & Ramaty (1993) Skibo J. G., Ramaty R., 1993, A&AS, 97, 145
- Skrutskie et al. (2006) Skrutskie M. F., et al., 2006, AJ, 131, 1163
- Skumanich (1972) Skumanich A., 1972, ApJ, 171, 565
- Slavin, O’Brien, & Dunlop (1995) Slavin A. J., O’Brien T. J., Dunlop J. S., 1995, MNRAS, 276, 353
- Smith & Dhillon (1998) Smith D. A., Dhillon V. S., 1998, MNRAS, 301, 767
- Stecker (1977) Stecker F. W., 1977, ApJ, 212, 60
- Suleimanov, Revnivtsev, & Ritter (2005) Suleimanov V., Revnivtsev M., Ritter H., 2005, A&A, 435, 191
- Tinney et al. (1993) Tinney, C.G., Reid, I.N., & Mould, J.R. 1993, ApJ, 414, 254
- Trinchieri & Fabbiano (1985) Trinchieri G., Fabbiano G., 1985, ApJ, 296, 447
- Tueller et al. (2007) Tueller J., Mushotzky R. F., Barthelmy S., Cannizzo J. K., Gehrels N., Markwardt C. B., Skinner G. K., Winter L. M., 2007, arXiv, 711, arXiv:0711.4130
- Warner (1995) Warner B., 1995, Ap&SS, 232, 89
- Watson et al. (1995) Watson M. G., et al., 1995, MNRAS, 273, 681
- Winkler et al. (2003) Winkler C., et al., 2003, A&A, 411, L1