The Stellar Populations of Starburst Galaxies Through near infrared spectroscopy
Abstract
We study the central (inner few hundred parsecs) stellar populations of four starburst galaxies (NGC34, NGC1614, NGC3310 and NGC7714) in the near-infrared (NIR), from 0.8 to 2.4m, by fitting combinations of stellar population models of various ages and metallicities. The NIR spectra of these galaxies feature many absorption lines. For the first time, we fit simultaneously as much as 15 absorption features in the NIR. The observed spectra are best explained by stellar populations containing a sizable amount ( 20 to 56 % by mass) of 1 Gyr old stellar population with Thermally Pulsing-Asymptotic Giant Branch stars. We found that the metallicity of the stars which dominates the light is solar. Metallicities substantially different from solar give a worse fit. Though the ages and metallicities we estimate using the NIR spectroscopy are in agreement with values from the literature based on the UV/optical, we find older ages and a larger age spread. This may be due to the fact that the optical is mostly sensitive to the last episode of star formation, while the NIR better maintains the record of previous stellar generations. Another interesting result is that the reddening estimated from the whole NIR spectrum is considerably lower than that based on emission lines. Finally, we find a good agreement of the free emission line spectrum with photoionization models, using as input spectral energy distribution the synthetic composite template we derived as best-fit.
keywords:
circumstellar matter – infrared: stars – Starburst Galaxies – AGB – Post-AGB.1 Introduction
Star-forming galaxies (starburst/H ii) are among the best laboratories to study the evolution of massive stars as well as the physical processes that are associated with the earliest stages of galaxy formation. The study of this kind of object starts with the work of Pastoriza (1967, 1975) and Sargent & Searle (1970), where it is suggested that some galaxies had their (nuclear) spectrum similar to those of H ii regions. Star-forming galaxies are easily recognized from their proeminent emission line spectra, dominated by hydrogen and helium recombination lines as well as strong forbidden lines of sulfur, oxygen and nitrogen, among others. These sources have also a prominent absorption line spectrum.
The Equivalent Widths (Ws) of the absorption features give insights on the stellar populations of the host galaxy, their study is a critical step in the analysis of the continuum and emission lines present in the spectra of galaxies. Through the analysis of the stellar content we get information about critical processes such as recent episodes of star formation and the evolutionary history of the galaxy. The stellar populations of starburst galaxies and the central regions of Seyfert galaxies have been mostly studied in the UV and optical bands (e.g. Bica, 1988; Schmitt et al., 1996; Gonzàlez-Delgado et al., 1998; Raimann et al., 2000a, b; Bonatto et al, 2000; Cid Fernandes, Leão & Lacerda, 2003; Gonzàlez-Delgado et al., 2004; Westera et al., 2004; Cid Fernandes et al., 2005, and references therein).
The first use of the near infrared (NIR) dates back to nearly thirty years ago. Rieke et al. (1980) employ NIR spectroscopy to study NGC 253 and M 82 and report the detection of strong CO band in these sources, which suggests the presence of a large population of red giants and supergiants in the nuclear region of both sources. Since the, other groups have used the near-IR to study star formation, in most cases the CO bands (e.g. Origlia, Moorwood & Oliva, 1993; Oliva et al., 1995; Engelbracht et al., 1998; Lançon et al., 2001, and references therein) or photometric methods (e.g. Moorwood & Glass, 1982; Hunt et al., 2003), but overall the whole NIR stellar spectrum (0.8 to 2.4m) with its many absorption features remains poorly explored.
The obvious reason to use the NIR for starburst galaxies is that this spectral range is the most suitable one to unveil the stellar populations in highly obscured sources. However, tracing star formation in the NIR is difficult (Origlia & Oliva, 2000). To our knowledge, in this spectral region, except for a few indicators such as the methods based on the CO(2-0) first overtone or the Br emission (e.g. Origlia, Moorwood & Oliva, 1993; Oliva et al., 1995), the detection of spectral features allowing the identification and dating of stellar populations, mostly those residing in the inner few tens of parsecs of galaxies, remains an open question. As stellar absorption features in the infrared are widely believed to provide means for recognizing red supergiants (Oliva et al., 1995), they arise as prime indicators for tracing starburst in galaxies.
Besides the short-lived red supergiants typical of very young stellar populations, the NIR hosts also the contribution from the thermally- pulsating asymptotic giant branch (TP-AGB) stellar phase, which is enhanced in young to intermediate age stellar populations ( Gyr, Maraston, 1998). The contribution of this stellar phase in stellar population models has been recently included in both the energetics and the spectral features by (Maraston, 2005, hereafter M05). In particular, these models employ empirical spectra of oxygen-rich and carbon stars (Lançon & Wood, 2000), which are able to foresee characteristic NIR absorption features such as the 1.1m CN band. TP-AGB stars leave a unique fingerprint on the integrated spectra (cfr. M05, Fig. 14), hence when detected they can help the age dating of stellar populations from integrated light (M05). In fact, very recently Riffel et al. (2007) detected the 1.1m CN band in the spectra of active galactic nuclei and starburst galaxies. In addition, Dottori et al. (2005) propose that carbon stars are natural candidates to explain the colour excess of the nucleus with respect to the circumnuclear star formation ring of NGC 1241. Furthermore, the typical NIR spectral shape due to the presence of TP-AGB stars has been detected in Spitzer data for high-redshifted galaxies (Maraston et al., 2006).
The knowledge of the stellar populations that dominate the light in the NIR becomes very important nowadays as the spectroscopic observation of galaxies is being directed to this spectral region. With the new generation of infrared arrays, it is now possible to obtain spectra at moderate resolution on faint and extended sources. Also, the availability of cross-dispersed spectrographs offering simultaneous wavelength coverage in the interval 0.82.4 m, allow the study of the NIR region avoiding the aperture and seeing effects that usually affect JHK spectroscopy done in long-slit mode and single-band observations.
With this in mind, we present for the first time a detailed fitting of the whole 0.8-2.4m spectral range, for the Starburst/H ii galaxies studied by Riffel, Rodríguez-Ardila & Pastoriza (2006, hereafter RRP06). This paper is structured as follows: The data are presented in Sec. 2. In Sec. 3 we describe the fitting method and how the measurements are done. Results are presented and discussed in Sec. 4. In Sec. 5 we focus on the free emission line spectrum. The final remarks are given in Sec. 6.
2 The Data
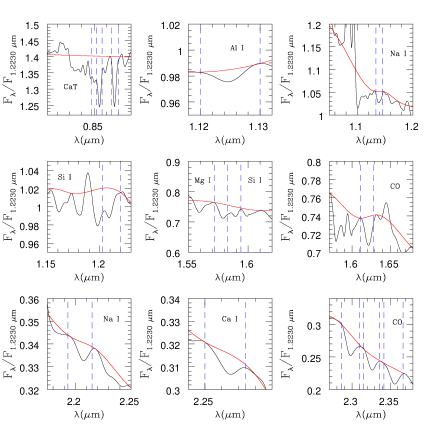
For this work we choose NGC 34, NGC 1614, NGC 3310 and NGC 7714, which are typical Starburst/H ii galaxies and are very well studied in other spectral ranges. The NIR spectra of these sources, presented in RRP06, were obtained at the NASA 3 m Infrared Telescope Facility (IRTF). The SpeX spectrograph (Rayner et al., 2003), was used in the short cross-dispersed mode (SXD, 0.8-2.4m). The detector used was a 10241024 ALADDIN 3 InSb array with a spacial scale of 0.15”/pixel. A 0.8”15” slit was employed giving a spectral resolution of 360 . For more details about instrumental configuration and sample selection see RRP06. A rapid inspection of Fig. 13 in RRP06 allows us to the see that all the spectra are dominated by strong absorption features due to stars. For reference, we plot in Fig. 1 the most proeminent ones observed in NGC 7714, including the molecular bands of CN, CO and those of atomic transitions of Ca ii, Ca i, Na i, Si i and Mg i. Emission lines present in the NIR spectrum of this object are also identified.

3 Analysis of the stellar populations: Method and Measures
In order to describe the age distributions of the stellar populations of the sources and their metallicities, we compare the observed spectra with various combinations of stellar population templates of various ages and metallicities. In the analysis we use a method similar to the one introduced by Bica (1988). The latter employs empirical star cluster spectra and combine them in order to estimate the combination of ages and metallicities that allows the best match to the galaxy spectra. Here instead, we use as input for the base of elements the synthetic Simple Stellar Population (SSP) models computed by M05.
The fitting technique used here exploits the equivalent widths () of spectral absorption features and the continuum fluxes () at selected wavelengths intervals, free from emission/absorption lines. These quantities are measured in the galaxy spectra and compared with combinations of the base of elements, which in turn have known ages and metallicities. An algorithm generate these combinations and compare the composite synthetic and with the observed values. In practice, the algorithm tries to find the minimum of the function,
| (1) |
were and are, respectively, the equivalent width of a given line i of the galaxy and of a Stellar Population model (hereafter SP). The and are the continuum fluxes at a selected point j of the galaxy and of a SP, respectively. The possible solutions are those that reproduce, within allowed limits, the and observed in the galaxy spectra. The results of this matching procedure are flux fractions at a selected of the different components of the base of elements.
In the present work we have upgraded the algorithm of Schmitt et al. (1996) in order to include a search for the internal reddening of the stellar population E(B-V)SP for points, free from emission/absorption lines, located in the NIR region. The Cardelli, Clayton & Mathis (1989) [CCM] reddening law was employed for this purpose.
We have defined the NIR continuum fluxes at 0.81m, 0.88m, 0.99m, 1.06m, 1.22m, 1.52m, 1.70m, 2.09m, and 2.19m, all normalized to 1.22m, to be used as input parameters for the algorithm. As can be observed in Fig 2 we have used an average value of the continuum points located between the vertical lines. The measured values in the galaxy spectra as well as the continuum intervals are presented in Tab 1. The PACCE (Vale et al., 2008) code was used to measure the fluxes.
| Interval (m) | NGC 34 | NGC 1614 | NGC 3310 | NGC 7714 |
|---|---|---|---|---|
| 0.813-0.816 | 0.86 | 0.76 | 1.29 | 1.41 |
| 0.879-0.881 | 0.94 | 0.88 | 1.27 | 1.41 |
| 0.993-0.995 | 1.02 | 1.00 | 1.19 | 1.25 |
| 1.057-1.060 | 1.03 | 1.03 | 1.13 | 1.18 |
| 1.220-1.226 | 1.00 | 1.00 | 1.00 | 1.00 |
| 1.515-1.525 | 0.91 | 0.85 | 0.79 | 0.77 |
| 1.699-1.703 | 0.92 | 0.84 | 0.72 | 0.69 |
| 2.085-2.100 | 0.63 | 0.54 | 0.41 | 0.39 |
| 2.185-2.195 | 0.56 | 0.49 | 0.37 | 0.34 |

Bandpasses and continuum points used to compute the of the strongest absorption lines were taken from the literature or newly defined here. For the CaT lines and for the CN band we employed the definitions of Bica & Alloin (1987) and Riffel et al. (2007), respectively. The were measured using the bandpass as listed in Tab. 2. For Al i 1.1285 m, Na i 1.1383 m and Si i 1.2112 m the continuum was adjusted as a cubic spline using points free from emission/absorption lines between 1.02 m and 1.23 m. The continuum was also adjusted as a cubic spline for the measurements of Mg i, Mg i 1.5771 m, Si i 1.5894 m and CO 1.6175 m using points between 1.43 m and 1.69 m. In the same way, we have adjusted the continuum as a cubic spline for the lines located in the -band, using continuum points free from contaminations of emission/absorption features in the 2.09-2.37 m spectral range. In Fig. 3 we illustrate the continuum and bandpasses used to compute the .
Note that the resolution of the observed spectra has been degraded (see Fig. 1) to that of the M05 models11120 Å at the bluest lambdas of our spectrum up to 1 m, 50 Å from 1 m to 1.6 m and 100 Å up to the end of the galaxy spectrum.. This procedure was done using the task gauss of the IRAF222IRAF is distributed by the National Optical Astronomy Observatories, which are operated by the Association of Universities for Research in Astronomy, Inc., under cooperative agreement with the National Science Foundation. software. The measured values, as well as their uncertainties are listed in Tab. 2. Errors were estimated using the standard deviation of three different choices of the continuum level around a given , which basically reflects the subjectiveness associated with continuum determinations.
| Featurea | (m) | Band Pass (m) | NGC 34 | NGC 1614 | NGC 3310 | NGC 7714 |
|---|---|---|---|---|---|---|
| CaT1 | 0.8498 | 0.8476-0.8520b | 3.750.06 | 4.570.07 | 2.440.21 | 2.360.02 |
| CaT2 | 0.8542 | 0.8520-0.8564b | 3.890.01 | 4.750.05 | 3.870.18 | 3.400.03 |
| CaT3 | 0.8670 | 0.8640-0.8700b | 3.700.16 | 4.050.09 | 3.120.16 | 3.310.13 |
| CNc | 1.0950 | 1.0780-1.1120 | 24.720.13 | 25.770.17 | 16.000.37 | 24.340.16 |
| Al i | 1.1250 | 1.1200-1.1300 | 0.450.04 | - | - | - |
| Na i | 1.1395 | 1.1335-1.1455 | 1.550.10 | 2.760.08 | 3.100.11 | 1.160.17 |
| Si i | 1.2112 | 1.2025-1.2200 | 3.570.50 | - | - | - |
| Mg i | 1.5771 | 1.5720-1.5830 | 5.640.30 | 6.340.40 | 5.050.09 | 4.420.04 |
| Si i | 1.5894 | 1.5870-1.5940 | 1.930.03 | - | 3.820.08 | 2.010.07 |
| CO | 1.6175 | 1.6110-1.6285 | 4.270.40 | 5.370.15 | 4.850.24 | 4.150.08 |
| Na i | 2.2063 | 2.1936-2.2150 | 4.780.05 | 3.950.14 | 2.870.12 | 2.440.06 |
| Ca i | 2.2655 | 2.2570-2.2740 | 4.480.04 | 4.070.02 | 2.360.13 | 3.570.01 |
| CO | 2.2980 | 2.2860-2.3100 | 16.720.29 | 17.660.45 | 13.870.44 | 14.220.32 |
| CO | 2.3255 | 2.3150-2.3360 | 8.910.14 | 9.750.16 | 9.060.35 | 9.240.13 |
| CO | 2.3545 | 2.3420-2.3670 | 14.680.50 | 16.020.15 | 15.740.12 | 13.200.04 |
| a) The identifications of the atomic lines are based on | ||||||
| Cushing, Rayner & Vacca (2005). | ||||||
| b) From Bica & Alloin (1987). | ||||||
| c) For details see Riffel et al. (2007). | ||||||
The spectral base was taken from the evolutionary population synthesis (EPS) models of M05. These models are particularly interesting for studying the stellar populations in the NIR because, as discussed in the Introduction, they include empirical spectra of carbon and oxygen rich stars evolving through the TP-AGB phase. Thus, the models can predict the strength of molecular features like CH, CN and C2. Riffel et al. (2007) report, for the first time, the detection of the 1.1m CN band in a sample of galaxies including the sources studied in the present work. CN is particularly strong in young/intermediate stellar populations with ages in the range 0.32 Gyr, though is also detected in red supergiants of massive stars (e.g. Lançon & Wood, 2000; Lançon et al., 2007).
As base set we consider solar metallicity SSPs with a Salpeter initial mass function and the following age distributions: 0.001, 0.01, 0.03, 0.05 0.2, 0.5, 0.7, 1 and 13 Gyr. The ages are chosen taking into account the following: (i) very young starbursts (1 Myr population) can be present; (ii) red supergiants (RSG) are important contributors to the NIR (e.g. Oliva et al., 1995; Lançon et al., 2001, and are included in the 10, 30 and 50 Myr populations following the input stellar tracks of the M05 models (from the Geneva database, see M05 for references) ); (iii) stars in the TP-AGB phase (M05, Riffel et al., 2007, populations with 200, 500, 700 Myr and 1 Gyr). We additionally include an old model 13 Gyr. The behavior of the with age is presented in Fig. 4. The base set is capable to discriminate between the stellar populations in the RSG and TP-AGB phases (see Fig. 4). Here it should be noted that while the M05 models include empirical spectra of C-O-rich TP-AGB stars, they do not include empirical spectra of red supergiants. The latter show a large scatter in observed properties (Lançon et al., 2007). In addition, also the energetics of the RSG phase is not well known as it depends on mass-loss in massive stars, which is in turn highly uncertain. On the other hand, RSG display near-IR absorption bands and a proper spectrum should be used. To explore how much we could be in error by neglecting the true spectrum of a RSG, we made a 30 Myr, M05 model in which we include a stellar spectrum of an O-rich star from the database of Lançon & Wood (2000), that displays very similar features to a RSG (see Lançon & Wood, 2000, Fig. 7). We have then repeated the fitting procedure for the galaxy NGC 7714 using this 30 Myr model instead of the standard one. We find that the results are essentially the same. The measured and for the SSPs used in the base are given in Tab. 3 and Tab 4.

It is important to note that we have tested other metallicities in the range . To find the best solution we compute the of the residuals of the and values, i.e. we solve the equations:
| (2) |
and
| (3) |
The and are the differences between the observed and synthetic values for the and , respectively. As can be seen in Tab. 5 we find that the solar metallicity provides the best solution for the four galaxies. This result is in agreement with the analysis of the optical region of spiral bulges (e.g. Schmitt et al., 1996; Saraiva et al., 2001). Hence, as a first result of this paper, we find that the nuclear regions of these starburst galaxies are characterized by a solar-like metallicity.
| Agea | CaT1 | CaT2 | CaT3 | CN | Al i | Na i | Si i | Mg i | Si i | CO | Na i | Ca i | CO | CO | CO |
|---|---|---|---|---|---|---|---|---|---|---|---|---|---|---|---|
| 0.001 | 1.45 | 1.49 | 1.88 | 0.00 | 0.00 | 0.00 | 0.00 | 0.00 | 0.30 | 0.00 | 1.29 | 0.00 | 0.00 | 0.00 | 0.00 |
| 0.01 | 8.70 | 7.82 | 4.53 | 0.00 | 0.00 | 1.15 | 0.00 | 9.24 | 5.12 | 0.74 | 2.81 | 0.00 | 20.66 | 13.81 | 18.02 |
| 0.03 | 2.70 | 2.81 | 3.35 | 12.52 | 0.00 | 0.41 | 0.00 | 0.25 | 1.81 | 1.06 | 1.60 | 0.00 | 7.53 | 6.13 | 6.33 |
| 0.05 | 2.56 | 2.75 | 3.20 | 11.26 | 0.00 | 0.57 | 0.00 | 0.62 | 1.81 | 0.84 | 1.59 | 0.00 | 7.79 | 6.20 | 6.07 |
| 0.2 | 2.33 | 2.59 | 3.00 | 10.84 | 0.00 | 0.71 | 0.00 | 1.10 | 2.01 | 0.68 | 1.62 | 0.00 | 8.30 | 6.59 | 5.25 |
| 0.5 | 3.08 | 3.38 | 2.16 | 31.50 | 0.00 | 2.25 | 3.59 | 4.91 | 0.77 | 2.98 | 2.88 | 4.91 | 18.51 | 11.97 | 12.69 |
| 0.7 | 2.67 | 3.00 | 1.64 | 34.63 | 0.00 | 2.89 | 4.31 | 5.77 | 1.49 | 3.76 | 3.47 | 6.70 | 21.10 | 12.33 | 12.22 |
| 1 | 3.16 | 3.48 | 1.91 | 34.65 | 1.64 | 3.07 | 4.74 | 6.86 | 2.26 | 4.40 | 4.58 | 7.55 | 22.13 | 10.54 | 10.87 |
| 13 | 4.07 | 3.76 | 2.78 | 0.00 | 0.00 | 1.24 | 0.22 | 3.80 | 1.92 | 0.63 | 2.12 | 0.00 | 13.71 | 9.51 | 7.10 |
| a) In Gyr. | |||||||||||||||
| Age | 0.81 | 0.88 | 0.99 | 1.06 | 1.22 | 1.52 | 1.70 | 2.09 | 2.19 |
|---|---|---|---|---|---|---|---|---|---|
| 0.001 | 4.57 | 3.48 | 2.21 | 1.74 | 1.00 | 0.43 | 0.28 | 0.28 | 0.10 |
| 0.01 | 1.40 | 1.50 | 1.49 | 1.32 | 1.00 | 0.81 | 0.76 | 0.76 | 0.35 |
| 0.03 | 2.57 | 2.36 | 1.75 | 1.47 | 1.00 | 0.57 | 0.44 | 0.21 | 0.18 |
| 0.05 | 2.42 | 2.18 | 1.67 | 1.43 | 1.00 | 0.60 | 0.46 | 0.23 | 0.19 |
| 0.2 | 2.21 | 1.98 | 1.58 | 1.38 | 1.00 | 0.62 | 0.47 | 0.47 | 0.20 |
| 0.5 | 1.50 | 1.51 | 1.28 | 1.24 | 1.00 | 0.69 | 0.68 | 0.68 | 0.33 |
| 0.7 | 1.47 | 1.49 | 1.28 | 1.24 | 1.00 | 0.70 | 0.71 | 0.71 | 0.35 |
| 1 | 1.45 | 1.49 | 1.29 | 1.24 | 1.00 | 0.71 | 0.72 | 0.72 | 0.36 |
| 13 | 1.58 | 1.50 | 1.37 | 1.26 | 1.00 | 0.74 | 0.62 | 0.62 | 0.28 |
| () | () | |||||||||
|---|---|---|---|---|---|---|---|---|---|---|
| Source | 2 ⊙ | ⊙ | ⊙ | ⊙ | 2 ⊙ | ⊙ | ⊙ | ⊙ | ||
| NGC 34 | 2.26 | 1.08 | 1.39 | 1.69 | 0.21 | 0.10 | 0.22 | 0.23 | ||
| NGC 1614 | 2.90 | 1.53 | 2.28 | 2.14 | 0.11 | 0.03 | 0.11 | 0.18 | ||
| NGC 3310 | 2.22 | 1.54 | 1.72 | 2.31 | 0.06 | 0.04 | 0.08 | 0.07 | ||
| NGC 7714 | 2.13 | 1.35 | 1.40 | 5.82 | 0.03 | 0.02 | 0.04 | 0.04 | ||
4 Results
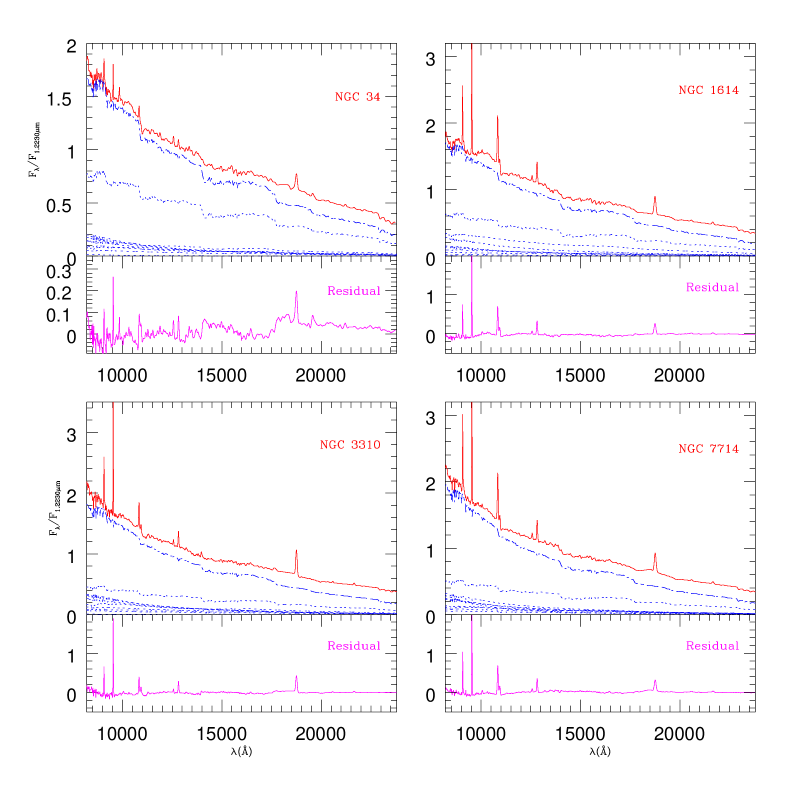
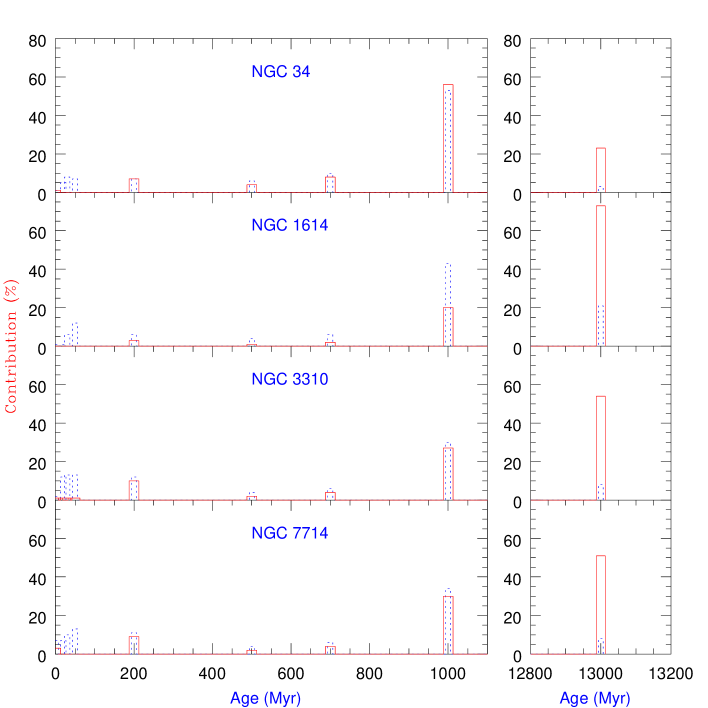
The results of our fitting procedure, in terms of flux fractions at 1.2230 m, are shown in Fig 5 and Tab. 6. As can be seen, there is a good agreement between the observed spectrum and the synthetic one for all galaxies. We also list the derived E(B-V) as well as the morphological type of the sources, as obtained from NED. The stellar population in terms of mass fraction was calculated using the mass-to-light ratio (M/L) in the -band 333see www.dsg.port.ac.uk/ marastonc/, assuming that the -band (centred at 1.2m) M/L is equal to M/L1.2230μm, where L1.2230μm is the continuum luminosity at 1.2230m. The mass fractions are listed in Tab. 6. We compare the flux and mass fractions of each population for the four sources in Fig. 6. In the remaining of this section we comment on the results for each individual source.
| Source | Morphology† | E(B-V) | % of age contributions‡. | ||||||||
|---|---|---|---|---|---|---|---|---|---|---|---|
| (mag) | 0.001 | 0.01 | 0.03 | 0.05 | 0.2 | 0.5 | 0.7 | 1 | 13 | ||
| NGC 34 | Sc | 0.950.05 | 12 | 55 | 87 | 77 | 77 | 67 | 109 | 537 | 32 |
| 14 | 01 | 01 | 01 | 714 | 410 | 815 | 5614 | 2331 | |||
| NGC 1614 | SB(s)c | 1.000.06 | 11 | 14 | 62 | 123 | 63 | 48 | 65 | 437 | 218 |
| 01 | 00 | 00 | 00 | 33 | 17 | 25 | 209 | 7372 | |||
| NGC 3310 | SAB(r)bc | 0.550.03 | 21 | 126 | 1310 | 1311 | 1211 | 45 | 67 | 306 | 84 |
| 11 | 10 | 10 | 10 | 1016 | 25 | 49 | 279 | 5445 | |||
| NGC 7714 | SB(s)b | 0.460.02 | 73 | 74 | 108 | 1310 | 119 | 44 | 65 | 344 | 83 |
| 36 | 00 | 00 | 00 | 916 | 25 | 48 | 308 | 5142 | |||
| From NASA/IPAC Extragalactic Database. | |||||||||||
| Ages in Gyr. | |||||||||||
4.1 NGC 34
The optical properties of NGC 34 (Mrk 938, MCG-02-01-032) are discussed in detail in the recent work of Schweizer & Seitzer (2007). Using photometry and Lick indices (when spectroscopy was possible) and comparing them with the models of Bruzual & Charlot (2003) they conclude, that NGC 34 has a young stellar disk and supports a rich system of young star clusters. In fact, as can be observed in Figs. 5 and 6 and in Tab. 6, the light at 1.2230 m in the 230 central pc of NGC 34 is also dominated by a stellar population with solar metallicity and a young-intermediate aged population (1 Gyr). These findings are in full agreement with the fact that NGC 34 has in its spectrum a strong 1.1m CN absorption band (Riffel et al., 2007) characteristic of stellar populations with that age (M05).
The colour excess E(B-V) of this source was calculated by Rodríguez-Ardila, Riffel & Pastoriza (2005, hereafter RRP05) using the emission line ratio Pa/Br. They obtain E(B-V)=1.32 mag. As can be observed, the E(B-V) estimated by means of the emission lines is larger than that obtained from the spectral fitting (Tab. 6). The difference can be due to the fact that Pa is strongly affected by absorption lines like Ti i 1.2827m and Ti i 1.2851m as well as Pa itself, as observed in Fig. 5. The discrepancy can be also explained considering that hot ionizing stars can be associated to a dustier region with respect to the cold stellar population (Calzetti, Kinney & Storchi-Bergmann, 1994).
.
4.2 NGC 1614
This source (Arp 186, Mrk 617,II Zw 015) is considered as a laboratory for studying the evolution of a starburst (Alonso-Herrero et al., 2001). The HST/NIR camera and multiobject spectrometer (NICMOS) observations reported by Alonso-Herrero et al. (2001) show deep CO stellar absorption, tracing a starburst nucleus with a diameter of 45 pc, surrounded by a 600 pc diameter ring of extremely luminous supergiant Hii regions. The stellar population that dominates the light in the inner 9 kpc of this source at 4020Å is studied by Cid Fernandes, Leão & Lacerda (2003, hereafter FLL03), using a base of elements composed by 12 star clusters of different ages and metallicities, defined by Schmidt et al. (1991). FLL03 find that the dominant stellar population is 100 Myr old ( 39 %). Here we find that the light at 1.2230m in the inner 154 pc is dominated by a stellar population of 1 Gyr age (see Tab. 6 and in Fig. 6). The dominant 1 Gyr stellar population found in this source as well as in NGC 34 agree with the fact that the two spectra are very similar.
The difference between our results and those of FLL03 is probably related to the fact that the aperture used by FLL03 include the light of the younger bulge/arm stars. Interestingly, we tried a combination of SSPs models in the proportions determined by FLL03 in the optical region, but the resulting synthetic template did not reproduce the observed NIR spectra of the inner 154 pc of NGC 1614.
Puxley & Brand (1994) study the dust extinction of this source by means of hydrogen line ratios. They argue that the NIR line ratios are inconsistent with a foreground screen of dust obscuring a compact radiation source, implying a non-uniform distribution of dust. They also show that if the dust distribution is homogeneous, then the total extinction is well fitted with an AV=152.5 mag. Using only Pa/Br, with a point source model, Puxley & Brand (1994) determine E(B-V)=1.56 (using RV=3.0). This E(B-V) value is 2 times larger than that estimated by RRP05. This galaxy is the only one of our sample where the reddening determined by the stellar population fitting is smaller than that determined by means of emission lines. This testifies the complex nature of the dust distribution in this object. This source should be observed with 2D spectroscopy in order to map the dust distribution along the galaxy.
4.3 NGC 3310
NGC 3310 (Arp 217) is a nearby disk galaxy undergoing intense starburst activity. It has been the subject of many studies across the electromagnetic spectrum (see Elmegreen et al., 2002, and references therein). This galaxy has a circumnuclear ring of star formation with angular diameter of 713 to 770 pc (assuming a diameter between 8′′ to 12′′ from Elmegreen et al., 2002, and a distance of 13.24 M pc from NED). NGC 3310 hosts a spectacular starburst, as seen in numerous H ii regions. However, it does not show evidence for even weak O-type stellar populations as seen from the HUT spectrum of this source (Leitherer et al., 2002). The nucleus and six surrounding H ii regions, four of which are located at less than 400 pc from the nucleus, were studied in the spectral range between 3600Å and 9600Å by Pastoriza et al. (1993). Here we present the contributions of the different stellar populations at 1.2230m in the inner 56 pc of this object. As can be observed in Fig. 6 and in Tab. 6, NGC 3310 displays an intense starburst activity, with four bursts of star formation. One dominant at 1 Gyr, which contributes with 306% and three remarkable bursts at 30 Myr (1311%), 50 Myr (1311%) and 200 Myr (1211).
Regarding the reddening, Rodríguez-Ardila, Riffel & Pastoriza (2005) has determined an E(B-V)=0.76 using emission line ratios. As in NGC 34, the color excess determined from the stellar population fitting is smaller than that derived from the emission lines of the gas. This discrepancy is probably due to the fact that the Pa is affected by absorption lines and/or by the dust distribution, as discussed in the case of NGC 34.
4.4 NGC 7714
NGC 7714 (Mrk 538, Arp 284) has been classified by Weedman et al. (1981) as a prototypical starburst galaxy. The optical stellar populations in the inner 5 kpc of this source have also been studied by FLL03. They find a 100 Myr old ( 33 %) dominant population. As for NGC 1614, we have combined the SSPs in the proportion calculated by FLL03 but the synthetic template did not match the observed NIR spectrum in the inner 115 pc.
Our synthesis results indicates that NGC 7714 is an active starburst galaxy. As for NGC 3310, three bursts of star formation were found, a dominant 1 Gyr (344%) old one and two minor bursts with ages 30 Myr (108%) and 50 Myr (1310%). The results agree with the facts that this galaxy displays a proeminent 1.1m CN band (Riffel et al., 2007) and that this source is in merging process due to a recent off-center collision (100-200 Myr) with NGC 7715 (Struck & Smith, 2003).
With very little silicate absorption and a temperature of the hottest dust component of 340 K, NGC 7714 is defined by Brandl et al. (2004) as the perfect template for a young, unobscured starburst. However, we measured an E(B-V)=0.47 from our spectrum, based on hydrogen line ratios (RRP05). These values agree very well with that determined by Puxley & Brand (1994). The E(B-V) determined using the stellar population fitting is similar to that determined with the emission lines.
In concluding this Section, we call the attention to the fact that our results are not driven by the CN band. In order to address this point we perform the synthesis for NGC 7714 excluding the CN band from our fitting. The age distribution found in this case is very similar to the one obtained using all absorption lines 444 Age (Gyr) 0.001 0.01 0.03 0.05 0.2 0.5 0.7 1 13 Cont. (%) 73 64 44 149 1310 34 66 345 118 .
5 Ionized gas
After subtracting the stellar population contribution we are left with a pure emission line spectrum allowing the study of the ionized gas. We consider that the emission line spectrum of the galaxies is produced solely by photoionization due to stars. This assumption is based on X-ray observations reported for the four sources, which were found to be too weak to be originated by a buried AGN. In NGC7714, for instance, the X-ray emission is explained by the presence of supernova remnants (Weedman et al., 1981). The ROSATASCA observations of NGC 3310 suggests that the soft emission is probably a super wind while the nature of the hard emission is more uncertain with the likely origins being X-ray binaries, inverse Compton scattering of infrared photons, an AGN or a very hot gas component (Zezas et al., 1998). However, Liu & Bregman (2005) using ROSAT High Resolution Imager report that the ultraluminous X-ray sources of this galaxy are located around knots on spiral arms. X-ray spectroscopy of NGC 1614 suggests that this galaxy may harbor an obscured AGN Risaliti et al. (2000), but VLBI studies with a sensitivity limit of 0.9 mJy do not detect a compact radio core in NGC 1614 Hill et al. (2001). In addition, the three galaxies listed above are located, in a diagnostic diagram envolving NIR emission line ratios, in the region correspondig to SB galaxies (Rodríguez-Ardila et al., 2004, RRP05). For the last galaxy, NGC 34, its nuclear spectrum is presently thought to be dominated by a highly obscured starburst, with a likely weak AGN contribution (Schweizer & Seitzer, 2007).
With the above in mind we compute a grid of models of Hii regions in order to reproduce the observed emission line intensities. Following the method of Dors & Copetti (2006), we use the photoionization code CLOUDY/C07.02 (see Ferland, 2003). The free input nebular parameters of the models are the abundances and ionization parameter . The nebula was considered as an expanding sphere, with filling factor =0.01 and a constant electron density of Ne = 500 cm-1. The spectral energy distribution (SED) used to compute the models are the synthetic templates derived from the stellar population fitting. We extrapolate the NIR results from the ultraviolet to the far-infrared. In this process, we weight the contribution of each SSPs with the flux contributions listed in Tab. 6, and sum them. The final SED is very similar for the four galaxies555The young stellar populations, which ionize the gas, are nearly the same for all galaxies.. For this reason, we assume as representative, the resulting template obtained for NGC 7714.
The predicted emission line ratios are in good agreement with the observed ones, as can be seen in Tab. 7. Note that we have used ([Siii] 9531+Pa8)/9069Å instead of the [Siii] line ratio because the spectral resolution, 20Å, in this spectral region does not allow deblending [Siii] 9531Å and Pa8 (9548 Å). In addition, we plot in Fig. 7 ([Siii] 9531+Pa8)/Pa versus [Fe ii]/Br. The results show that the gas has an ionization parameter in the range , and abundances of S and Fe (X/H) between 0.08 and 0.14 solar. The low sulfur abundances are in agreement with the findings of Kehrig et al. (2006), who studied the chemical abundances in a sample of 22 Hii galaxies by means of the [Siii] 9031,9531Å emission lines. They inferred that most of the objects in their sample have S/H abundances in the range between 1/20 and solar. Regarding the [Fe ii] the ratio [Fe ii] 1.257 m/Br found for our sample varies from 1.400.31 to 1.770.32 (see Tab. 7 and Fig. 7), similar to those reported by Simpson et al. (1996, 0.65 and 2.70) 666Simpson et al. (1996) indeed reported values of the ratio [Fe ii] 1.257 m/Pa in the interval 0.11-0.46 for starburst galaxies. Assuming case B, Pa/Br=5.88, we estimated that the ratio [Fe ii] 1.257 m/Pa translates to [Fe ii] 1.257 m/Br between 0.65 and 2.70.. Models of Colina (1993) predict ratios between 0.13 and 1.90 for starburst galaxies, well within the range of our observations.
It is interesting to note that while the best fitting solutions for the stellar populations require SSPs of solar metallicity, the S and Fe abundances of the emission gas are lower than solar. One mechanism that can be invoked to explain this difference is interaction among galaxies. Three of the four sources observed (NGC34, NGC 1614 and NGC 7714) are strongly interacting objects (Thean et al., 2003; Hattori et al., 2004; Dopita et al., 2002). The gas motions created by the interaction can significantly alter the chemical state of the galaxies (Koeppen & Arimoto, 1990; Dalcanton, 2007), and modify the usually smooth radial metallicity gradient often found in isolated disk galaxies (Henry & Worthey, 1999). Recently, Kewley et al. (2006) found that the O/H abundance in the central region of nearby galaxy pairs is systematically lower than that of isolated objects. These authors suggest that the lower metallicity is a consequence of gas infall caused by the interaction. In addition, streaming motions of neutral gas (Hi) towards the galaxy center along the spiral arms was observed in M 81 (Adler & Westpfahl, 1996) and more recently infall of molecular gas (H2) towards the center of NGC 4051 was reported by Riffel et al. (2008). Similar motions of molecular gas towards the nucleus along the bar have been observed in NGC 4151 (Mundell & Shone, 1999). In the same way, Mazzuca et al. (2006) have shown that the star-forming ring in NGC 7742 rotates in the opposite direction of the bulge stars, and therefore it is made of external material. Therefore, interactions and inflows of matter from the outer low metal abundance medium can dilute the nuclear high metallicity interstellar medium.
| Feature | Cal.a | NGC 34 | NGC 1614 | NGC 3310 | NGC 7714 |
|---|---|---|---|---|---|
| Pa/Pa | 0.56 | - | 0.530.08 | 0.610.05 | 0.520.03 |
| Br/Pa | 0.17 | - | 0.160.03 | 0.190.02 | 0.180.01 |
| ([Siii] 9531+Pa8)/9069Å | 2.70 | 2.710.68 | 2.700.13 | 2.670.12 | 2.480.05 |
| ([Siii] 9531+Pa8)/Pa | b | 1.410.11 | 2.660.14 | 3.050.14 | 3.570.15 |
| [Fe ii]/Br | b | - | 1.400.31 | 1.770.32 | 1.470.27 |
| a) Calculated using CLOUDY (see for example Ferland, 2003). | |||||
| b) see Fig. 7. | |||||

6 Final Remarks
We have analyzed in NIR spectroscopy, from 0.8 to 2.4 m, the stellar populations in the inner few hundred parsecs of the starburst galaxies NGC 34, NGC 1614, NGC 3310 and NGC 7714. We use a composition of simple stellar population models with various ages, from 1 Myr up to 13 Gyr, and we also test the effect of metallicity. For the first time, we fit simultaneously as much as 15 absorption features in the NIR. We find that all galaxies host a remarkable fraction of 1 Gyr stellar populations. This result gives support to the fact that the 1.1m CN band is a powerful tracer of intermediate age stellar populations (Riffel et al., 2007; Maraston, 2005), though we have tested that the ages we derive depend on the multiband fitting rather than on one specific absorption. Our results are in broad agreement with similar analysis in the optical region, though we tend to find older ages and a wider age spread. At least part of this result is due to the fact that the NIR is a region more suitable to pick up underlying older stellar populations, and to display the unique absorptions proper to 1 Gyr-old stellar populations featured by TP-AGB stars. Our finding that the central regions of the SB galaxies contain a substantial fraction of intermediate-age stellar populations and their prolongued star formation history is very similar to the picture drawn by Allard et al. (2006) and Sarzi et al. (2007) in the case of central star-forming rings, based on optical data. This similarity might support the view that central star formation often occurs in circumnuclear rings, as was shown by the STIS Survey of Nearby Nuclei (SUNNS Sarzi et al., 2005; Shields et al., 2007). Analyses based on optical and NIR may be consistent in case of low dust obscuration or low contamination from old populations from the bulge region, which affect the optical colours. Our NIR based analysis is more robust in both respects, because of the whole sampling of the region between 0.8 m and 2.4 m, which includes unique features of intermediate-age such as CN bands.
We found that the metallicity of the stars which dominate the light at 1.2230m, in the inner hundred parsecs of the four galaxies is most likely solar. The reddening value determined with the whole spectra is lower than the one determined with the emission lines only. We found an excellent agreement of the free emission line spectrum with photoionization models, using as input SED the one derived via the spectral fitting in the NIR. Due to features like the 1.1m CN band, the stellar population analysis in the NIR seems to allow for a better fine tuning in the age distribution of the galaxy stellar populations. The near-IR spectroscopic approach is being now pursued also in other type of galaxies (Silva, Kuntschner & Lyubenova, 2008).
Acknowledgments
We thank A. L. Chies-Santos, A. C. Krabbe, C. Bonatto, O. L. Dors and R. S. Nemmen for helpful discussions. R. R. thanks to the Brazilian funding agency CNPq. MGP thanks to PRONEX/FAPERGS (05/11476). CM is a Marie Curie Excellence Team Leader and acknowledges grant MEXT-CT-2006-042754 of the European Community. This research has been partly supported by the Brazilian Brazilian agency CNPq (311476/2006-6) to ARA. This research has made use of the NASA/IPAC Extragalactic Database (NED) which is operated by the Jet Propulsion Laboratory, California Institute of Technology, under contract with the National Aeronautics and Space Administration. The authors thank the anonymous referee for useful comments about this manuscript.
References
- Adler & Westpfahl (1996) Adler, D. S. & Westpfahl, D. J., 1996, AJ, 111, 735.
- Allard et al. (2006) Allard, E. L.; Knapen, J. H.; Peletier, R. F.& Sarzi, M., 2006, MNRAS, 371, 1087.
- Alonso-Herrero et al. (2001) Alonso-Herrero, A., Engelbracht, C. W., Rieke, M. J., Rieke, G. H.& Quillen, A. C., 2001, ApJ, 546, 952.
- Bica & Alloin (1987) Bica, E.& Alloin, D., 1987, A&A,186,49.
- Bica (1988) Bica, E. 1988, A & A, 195, 9.
- Bonatto et al (2000) Bonatto, C., Bica, E., Pastoriza, M. G. & Alloin, D., 2000, A&A, 355, 99
- Brandl et al. (2004) Brandl, B. R. et al., 2004, ApJS, 154, 188.
- Bruzual & Charlot (2003) Bruzual, G. & Charlot, S., 2003, MNRAS, 344, 1000.
- Calzetti, Kinney & Storchi-Bergmann (1994) Calzetti, D., Kinney, A. L. & Storchi-Bergmann, T., 1994, ApJ, 429, 582.
- Cardelli, Clayton & Mathis (1989) Cardelli, J. A., Clayton, G. C., Mathis, J. S., 1989, ApJ, 345, 245
- Cid Fernandes, Leão & Lacerda (2003) Cid Fernandes, R., Leão, J. R. S. & Lacerda, R. R., 2003, MNRAS, 340, 29 (FLL03).
- Cid Fernandes et al. (2005) Cid Fernandes, R., González Delgado, R. M., Storchi-Bergmann, T., Martins, L. Pires & Schmitt, H., 2005, MNRAS, 356,270.
- Colina (1993) Colina, L., 1993, ApJ, 411, 565.
- Cushing, Rayner & Vacca (2005) Cushing, M. C., Rayner, J. T., & Vacca, W. D. 2005, ApJ, 623, 1115
- Dalcanton (2007) Dalcanton, J. J., 2007, ApJ, 658, 941.
- Dottori et al. (2005) Dottori, H., Díaz, R. J., Carranza, G., Lípari, S. & Santos, J., Jr., 2005, ApJ, 628L, 85.
- Dopita et al. (2002) Dopita, M. A.; Pereira, M.; Kewley, L. J.; Capaccioli, M., 2002, ApJS, 143, 47.
- Dors & Copetti (2006) Dors, O. L., Jr.& Copetti, M. V. F., 2006, A&A, 452, 473
- Henry & Worthey (1999) Henry, R. B. C. & Worthey, G., 1999, PASP, 111, 919.
- Hill et al. (2001) Hill, T. L., Heisler, C. A., Norris, R. P., Reynolds, J. E., & Hunstead, R. W. 2001, AJ, 121, 128
- Elmegreen et al. (2002) Elmegreen, D. M., Chromey, F. R., McGrath, E. J. & Ostenson, J. M., 2002, AJ, 123, 1381.
- Engelbracht et al. (1998) Engelbracht, C. W.; Rieke, M. J.; Rieke, G. H.; Kelly, D. M. & Achtermann, J. M., 1998, ApJ, 505, 639.
- Ferraro et al. (2006) Ferraro, F. R., Valenti, E. & Origlia, L., 2006, ApJ, 649, 243.
- Ferland (2003) Ferland, G. J., 2003, ARA&A, 41, 517.
- Gonzàlez-Delgado et al. (1998) Gonzàlez Delgado, R. M., Leitherer, C., Heckman, T., Lowenthal, J. D., Ferguson, H. C. & Robert, C., 1998, ApJ, 495, 698
- Gonzàlez-Delgado et al. (2004) Gonzàlez Delgado, R. M., Cid Fernandes, R., Pèrez, E., Martins, L. P., Storchi-Bergmann, T., Schmitt, H., Heckman, T., Leitherer, C.,2004, ApJ, 605, 127.
- Hattori et al. (2004) Hattori, T.; Yoshida, M.; Ohtani, H.; Sugai, H.; Ishigaki, T.; Sasaki, M.; Hayashi, T.; Ozaki, S.; Ishii, M.; Kawai, A., 2004, AJ, 127, 736
- Hunt et al. (2003) Hunt, L. K.; Thuan, T. X.; Izotov, Y. I., 2003, ApJ, 588, 281.
- Kehrig et al. (2006) Kehrig, C., Vílchez, J. M., Telles, E., Cuisinier, F. & Pérez-Montero, E., 2006, A&A, 457, 477
- Kewley et al. (2006) Kewley, Lisa J.; Geller, Margaret J.; Barton, Elizabeth J., 2006, AJ, 131, 2004
- Koeppen & Arimoto (1990) Koeppen, J.& Arimoto, N., 1990, A&A, 240, 22
- Lançon & Wood (2000) Lançon, A. & Wood P. R.2000, A&AS, 146, 217.
- Lançon et al. (2001) Lançon, A., Goldader, J. D., Leitherer, C., & González Delgado, R. M., 2001, ApJ, 552, 150
- Lançon et al. (2007) Lançon A., Hauschildt, P. H., Ladjal, D. & Mouhcine, M., 2007, A&A, 468, 205.
- Liu & Bregman (2005) Liu, J. & Bregman, J. N., 2005, ApJS, 157, 59.
- Leitherer et al. (2002) Leitherer, C., Li, I. H., Calzetti, D., Heckman, T. M., 2002, ApJS, 140, 303.
- Maraston (1998) Maraston, C., 1998, MNRAS, 300, 872.
- Maraston (2005) Maraston, C., 2005, MNRAS, 362, 799 (M05).
- Maraston et al. (2006) Maraston, C., Daddi, E., Renzini, A., Cimatti, A., Dickinson, M., Papovich, C., Pasquali, A. & Pirzkal, N., 2006, ApJ, 652, 85.
- Mazzuca et al. (2006) Mazzuca, L. M.; Sarzi, M.; Knapen, J. H.; Veilleux, S.; Swaters, R., 2006, ApJ, 649L, 79.
- Moorwood & Glass (1982) Moorwood, A. F. M.; Glass, I. S., 1982, A&A, 115, 84
- Mundell & Shone (1999) Mundell, C. G. & Shone, D. L., 1999, MNRAS, 304, 475
- Oliva et al. (1995) Oliva, E., Origlia, L., Kotilainen, J. K., Moorwood, A. F. M., 1995, A&A, 301, 55.
- Origlia, Moorwood & Oliva (1993) Origlia, L., Moorwood, A. F. M., Oliva, E., 1993,A&A, 280, 536.
- Origlia & Oliva (2000) Origlia, L. & Oliva, E., 2000, NewAR, 44, 257
- Puxley & Brand (1994) Puxley, P. J. & Brand, P. W. J. L., 1994, MNRAS, 266, 431.
- Pastoriza (1967) Pastoriza, M. G., 1967, Obs, 87, 225.
- Pastoriza (1975) Pastoriza, M. G., 1975, Ap&SS, 33, 173.
- Pastoriza et al. (1993) Pastoriza, M. G., Dottori, H. A., Terlevich, E., Terlevich, R., Diaz, A. I., 1993, MNRAS, 260, 177.
- Raimann et al. (2000a) Raimann, D., Bica, E., Storchi-Bergmann, T., Melnick, J. & Schmitt, H., 2000, MNRAS, 314, 295
- Raimann et al. (2000b) Raimann, D., Storchi-Bergmann, T., Bica, E., Melnick, J. & Schmitt, H., 2000, MNRAS, 316, 559
- Rayner et al. (2003) Rayner, J. T., Toomey, D. W., Onaka, P. M., Denault, A. J., Stahlberger, W. E., Vacca, W. D., Cushing, M. C., & Wang, S. 2003, PASP, 155, 362
- Rieke et al. (1980) Rieke, G. H., Lebofsky, M. J., Thompson, R. I., Low, F. J., Tokunaga, A. T., 1980, ApJ, 238, 24
- Riffel et al. (2008) Riffel, Rogemar A.; Storchi-Bergmann, T.; Winge, C.; McGregor, P. J.; Beck, T.; Schmitt, H., 2008, MNRAS, 385, 1129.
- Riffel et al. (2007) Riffel, R., Pastoriza, M. G., Rodríguez-Ardila, A. & C. Maraston, 2007, ApJ, 659L, 103
- Riffel, Rodríguez-Ardila & Pastoriza (2006) Riffel, R., Rodríguez-Ardila, A., Pastoriza, M. G., 2006, A&A 457, 61 (RRP06).
- Risaliti et al. (2000) Risaliti, G., Gilli, R., Maiolino, R., & Salvati, M. 2000, A&A, 357, 13
- Rodríguez-Ardila, Riffel & Pastoriza (2005) Rodríguez-Ardila, A., Riffel, R. & Pastoriza, M. G, 2005, MNRAS, 364, 1041 (RRP05).
- Rodríguez-Ardila et al. (2004) Rodríguez-Ardila, A.; Pastoriza, M. G.; Viegas, S.; Sigut, T. A. A.; Pradhan, A. K. 2004, A&A,425,457.
- Sarzi et al. (2007) Sarzi, M.; Allard, E. L.; Knapen, J. H.& Mazzuca, L. M., 2007, MNRAS, 380, 949.
- Sarzi et al. (2005) Sarzi, Marc; Rix, Hans-Walter; Shields, Joseph C.; Ho, Luis C.; Barth, Aaron J.; Rudnick, Gregory; Filippenko, Alexei V.; Sargent, Wallace L. W., 2005, ApJ, 628, 169.
- Saraiva et al. (2001) Saraiva, M. F., Bica, E., Pastoriza, M. G. & Bonatto, C., 2001, A&A, 376, 43.
- Schmidt et al. (1991) Schmidt, A. A., Copetti, M. V. F., Alloin, D. & Jablonka, P., 1991, MNRAS, 249, 766.
- Schmitt et al. (1996) Schmitt, H. R., Bica, E., & Pastoriza, M. G. 1996, MNRAS, 278, 965
- Schweizer & Seitzer (2007) Schweizer, F. & Seitzer, P., 2007,AJ,133, 2132
- Sargent & Searle (1970) Sargent, W. L. W. & Searle, L., 1970, ApJ, 162, 155.
- Simpson et al. (1996) Simpson, C., Forbes, D. A., Baker, A. C. & Ward, M. J., 1996, MNRAS, 283, 777.
- Silva, Kuntschner & Lyubenova (2008) Silva, D. R.; Kuntschner, H. & Lyubenova, M., 2008, ApJ, 674, 194.
- Shields et al. (2007) Shields, Joseph C.; Rix, Hans-Walter; Sarzi, Marc; Barth, Aaron J.; Filippenko, Alexei V.; Ho, Luis C.; McIntosh, Daniel H.; Rudnick, Gregory; Sargent, Wallace L. W., 2007, ApJ, 654, 125.
- Struck & Smith (2003) Struck, C. & Smith, B. J., 2003, ApJ, 589, 157.
- Thean et al. (2003) Thean, A.; Pedlar, A.; Kukula, M. J.; Baum, S. A.; O’Dea, C. P., 2000, MNRAS, 314, 573.
- Vale et al. (2008) Vale, T. B., Riffel, R., Pastoriza, M. G., Santiago, B. X., Rickes, M. G., 2008 In preparation
- Weedman et al. (1981) Weedman, D. W., Feldman, F. R., Balzano, V. A., Ramsey, L. W., Sramek, R. A., Wuu, C.-C., 1981, ApJ, 248, 105.
- Westera et al. (2004) Westera, P., Cuisinier, F., Telles, E. & Kehrig, C., 2004, A&A, 423, 133.
- Zezas et al. (1998) Zezas, A. L., Georgantopoulos, I.& Ward, M. J. 1998, MNRAS, 301, 915.