Unveiling the Narrow-Line Seyfert 1 Nature of Mrk 573 using near-Infrared spectroscopy.
Abstract
In this letter we present clear evidence that Mrk 573 is an obscured Narrow-Line Seyfert 1 (NLSy1) and not an archetypal Seyfert 2, as it has been classified until now. Only three galaxies have been proposed as members of this class, prior to this work. Here we report near-infrared spectroscopic data taken with LIRIS on the 4.2 m William Herschel Telescope (WHT). Our high quality near-infrared nuclear spectrum in the 0.88-1.35 µm wavelength range shows the permitted O I 1.128,1.317 narrow lines, the Fe II 9200-Å lines and the Fe II 1-µm lines, together with a relatively broad component ( 1700 km s-1) of Pa. These features can originate only in an optically thick high density region, similar to those observed in the Broad Line Region (BLR).
1 Introduction
The NLSy1 galaxies (Osterbrock & Pogge, 1985; Pogge, 2000) share the optical properties of Seyfert 1 nuclei, except that they show narrower Balmer lines (FWHM 2000 km s-1) and strong optical Fe II emission. In the X-rays, these objects are also peculiar because of their soft X-ray excess and rapid X-ray variability (Boller et al., 1996; Véron-Cetty et al., 2001), together with a very steep photon spectral index (Leighly, 1999). The most accepted explanation for these extreme X-ray properties are high Eddington ratios (L/L 1-10) and lower black hole masses relative to other Seyfert nuclei (M) (Mathur et al., 2001; Boroson, 2002; Grupe, 2004). In addition, Nagar et al. (2002) and Dewangan & Griffiths (2005) suggested the existence of the Type 2 counterparts of the NLSy1, i.e., obscured NLSy1, which appear as Seyfert 2 galaxies but containing a Seyfert 1 engine characterized by a high accretion rate or a small BH mass. Dewangan & Griffiths (2005) proposed NGC 7582, NGC 5506, and NGC 7314 as obscured NLSy1, based on their extreme X-ray variability and Compton-thick nature. NGC 5506 was also confirmed as a NLSy1 in the near-infrared by Nagar et al. (2002). This type of objects would be missclassified using only the visible range. They can be distinguished through low extinction wavelength regimes, for example the near-infrared.
The galaxy Mrk 573 has been extensively studied by many authors. Its active nucleus is hosted in a (R)SAB(rs)0+ galaxy111The redshift of the galaxy has been measured to be z=0.017 (Ruiz et al., 2005), which implies a physical scale of 333 pc arcsec-1, using H0 = 75 km s-1 Mpc-1. and has been classified until now as a classical Type 2 nucleus from previous optical (Tsvetanov & Walsh, 1992; Erkens et al., 1997; Mullaney & Ward, 2008) and infrared spectroscopic data (Veilleux et al., 1997; Riffel et al., 2006). Spectropolarimetric observations (Nagao et al., 2004) reveal a broad component of the H profile ( 3000 km s-1), together with the optical Fe II multiplet. Prominent forbidden high-ionization emission lines have also been detected in the optical spectrum of this galaxy, as for example [Fe VII] and [Fe X] (Erkens et al., 1997; Mullaney & Ward, 2008). In the X-ray regime this galaxy presents a soft X-ray excess (L=1.6x1041 erg s-1) and a steep photon spectral index (=2.70.4) (Guainazzi et al., 2005). It also appears as a Compton-thick object () and shows a large EW of the Kα fluorescent iron line (Guainazzi et al., 2005).
In this letter we report on new LIRIS near-infrared spectroscopy of Mrk 573, that, together with the X-ray properties of this galaxy, unambiguously identifies it as an obscured NLSy1. This re-classification is based on the detection of the permitted Fe II 9200-Å lines and the Fe II 1-µm lines, together with O I 1.128,1.317, and a relatively broad component of the Pa line. We also report the first detection of a conspicuous line at 0.962 µm, that tentatively could be identified either as O I and/or He I transitions.
2 Observations and data reduction
High quality near-infrared long-slit spectra in the range 0.8-2.4 µm were obtained on the night of 2006 July 17, using the near-infrared camera/spectrometer LIRIS (Manchado et al., 2004), on the 4.2 m William Herschel Telescope (WHT). The spatial scale is 0.25″ pixel-1, and the slit width 0.75″ (allowing a spectral resolution in the range 600-400 km s-1). The slit was centered on the galaxy nucleus and it was oriented along P.A.=122o, coincident with the orientation of the ionization cone observed by Pogge & De Robertis (1995). Weather conditions were good, with the seeing varying between 0.8″and 0.9″. Observations were performed following an ABBA telescope-nodding pattern. A total exposure time of 4000 s was taken, divided into individual frames of 500 s each. The data were reduced following standard procedures for near-infrared spectroscopy, using the lirisdr dedicated software within the IRAF222IRAF is distributed by the National Optical Astronomy Observatory, which is operated by the Association of Universities for the Research in Astronomy, Inc., under cooperative agreement with the National Science Foundation (http://iraf.noao.edu/). enviroment. For a detailed description of the reduction process, see Ramos Almeida et al. (2006). The nearby A0 HD 2193 star was observed with the same configuration and similar airmass to the galaxy to perform the telluric correction and the flux calibration. A modified version of Xtellcor (Vacca et al., 2003) was used in this step. Note that the absolute flux calibration is intended to be an approximation since the spectrum of the comparison star is probably subject to centering and tracking errors, as well as slit losses.
3 Results
The final nuclear spectrum, extracted with a 1.5″ aperture centered on the maximum of the galaxy profile, is shown in Fig. 1. Most detected lines are marked in the figure, and their fluxes and FWHM (measured by fitting a Gaussian profile using the Starlink program DIPSO) are reported on Table 1. In general terms, the spectrum is typical of a Seyfert 2 galaxy, showing very high ionization lines such as [S VIII] and [S IX]. One can also note the presence of the 1.1 µm CN band, first reported for this galaxy by Riffel et al. (2006), that shows the existence of young/intermediate stars in the nuclear region. The main focus of this letter is on the detection of the permitted O I and Fe II lines well above the noise level and of the broad wings of the Pa profile.
The O I1.128,1.317 permitted transitions are produced by Ly pumping in a Bowen fluorescence mechanism (Grandi, 1980), and they are only produced in a high density optically-thick gas. Thus, these lines are seen only in Seyfert 1 or NLSy1 nuclei, but never in canonical Seyfert 2 galaxies.
In Fig. 2 all the detected Fe II transitions are labelled for both the Fe II 9200-Å lines (0.893, 0.908, 0.913, 0.917, 0.922, 0.930 µm), and the Fe II 1-µm lines (0.997, 0.999, 1.002, 1.019, 1.051, 1.052, 1.053, 1.055, 1.064, 1.086, 1.111, 1.122 µm). Very few Seyferts with near-infrared detection of permitted Fe II lines have been reported until now in the literature (Rudy et al., 2000, 2001; Nagar et al., 2002; Rodríguez-Ardila et al., 2002a, 2005). The detection of Fe II lines provides crucial information on the ionization mechanism of the gas, since they are thought to be pumped by Ly fluorescence (Johansson & Jordan, 1984; Sigut & Pradhan, 2003) and they can be formed only in high density clouds or in the optically-thick BLR.
For Mrk 573, we estimate the line width of O I1.317 to be FWHM 320 km s-1, which is practically the same as the narrow component of the recombination lines (see Table 1). For NLSy1 the widths of the O I and Fe II lines do not necessarily have to be comparable to the broad component of the recombination lines. For example, in the case of Mrk 335, the Pa FWHM = 2050 km s-1, while the O I1.128 FWHM = 1100 km s-1 (Rodríguez-Ardila et al., 2002b). More dramatic is the case of Ark 564, another typical NLSy1, for which the Pa FWHM = 1800 km s-1, while the O I1.128 FWHM = 600 km s-1 (Rodríguez-Ardila et al., 2002b).
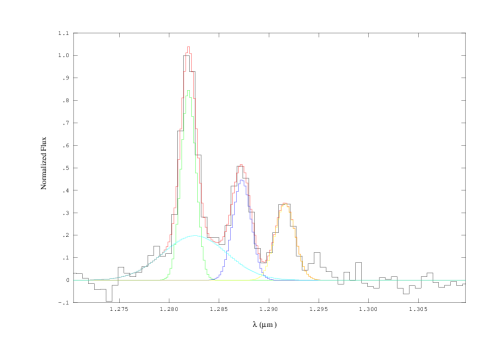
A relatively broad component of the Pa profile with FWHM 1700 km s-1 is detected, in addition to the narrow component (see Fig. 3 and Table 1). This line width is smaller than the reported by Nagao et al. (2004) for the optical hydrogen recombination lines in polarized light. The Pa broad component contains about 50% of the total line flux, which is very similar to the fraction found by Nagar et al. (2002) for the same line in NGC 5506.
Another interesting feature detected in our spectrum is seen at 0.962 µm, very close to the prominent [S III]0.953 line. The former is not detected in previous near-infrared spectra of Mrk 573 (Veilleux et al., 1997; Riffel et al., 2006) and remains unidentified in the literature. The most likely possible identifications of this line are O I (3D0-3D) or He I (1P0-1D)333Computed with the line identification software package EMILI (Sharpee et al., 2003), that employs an updated version of the v2.04 Atomic Line List.. We can not discard either of the two posibilities, since we detect other O I lines in our near-infrared spectrum, and also, in the optical, He I0.668 (1Po-1D) has been detected (Erkens et al., 1997). It is noticeable the FWHM of this line ( 700 km s-1), that is the broadest of our spectrum (see Table 1), which could be due to line blending. There are another two lines very close to Pa (see Figs. 1 and 3), at 1.287 and 1.292 µm. Tentatively, they are Ne II (2D-2P0) and Ne I444Ne I (), respectively, according with the NIST Atomic Spectra Database555http://physics.nist.gov/PhysRefData/ASD/lines-form.html. The non-detection in previous near-infrared spectra of all the features mentioned in this section could be due to the higher signal-to-noise of our data, or to a more complex scenario that would allow time variations in the spectrum of Mrk 573.
4 Discussion
The detection in our near-infrared spectra of the permitted Fe II and O I lines, together with the relatively broad component ( 1700 km s-1) of Pa argues against the Seyfert 2 nature of Mrk 573 and fits perfectly in the classical definition of NLSy1 galaxies. This is also confirmed by the presence of the optical Fe II multiplet in polarized light (Nagao et al., 2004). The X-ray properties of Mrk 573 are also typical of NLSy1 galaxies: a soft X-ray excess and a steep photon spectral index (=2.70.4) (Guainazzi et al., 2005). We have searched for X-ray variability in the publicly available XMM-Newton data of this galaxy666 The data (taken on Jan 2004) have been retrieved from the XMM-Newton archive and processed using the task ”evselect” from the package SAS v7.0.0.. The light curve shows variations of the count rates by a factor of within 300 s (see Fig. 4), which is similar to the variability of NLSy1s (Leighly, 1999; Véron-Cetty et al., 2001; Dewangan & Griffiths, 2005).
The optical spectra also reveals broad components of the H and H profiles of 3000 km s-1 in polarized light (Nagao et al., 2004). These line widths are, in principle, more typical of Sy1 than of NLSy1 galaxies. Nevertheless, very recently, Mullaney & Ward (2008) found that in order to reproduce the H and H profiles of a sample of well-known NLSy1 galaxies they needed three components of different widths (the broadest ones of FWHM 3000 km s-1). These findings indicate that the limit of FWHM 2000 km/s imposed in the definition of NLSy1 (Pogge, 2000) is not realistic. Indeed, Mrk 573 shows examples of the three kinematical components in its optical and near-infrared spectra. Thus, there must exist an intermediate high-density region, with intermediate properties between the Narrow-Line Region (NLR) and the BLR, that is producing the observed O I and Fe II lines, together with the relatively broad component of Pa. This intermediate region must be dense enough to produce lines which are broader than the narrow lines, but not as broad as those detected in polarized light.
In ”classical” NLSy1 galaxies, both the O I and Fe II permitted lines are normally more prominent (Riffel et al., 2006), although not necessarily broader (Grandi, 1980) than in Mrk 573. Moreover, their optical counterparts are also detected (Collin & Joly, 2000), which is not the case for this galaxy. These lines must then be produced in the previously mentioned intermediate high-density region, and must be affected by a moderate amount of extinction. More internally, in the BLR, the 3000 km s-1 components observed in polarized light (Nagao et al., 2004) should be produced, but it is difficult to see them directly, due to the presence of an obscuring structure. A similar scenario occurs in the NLSy1 Mrk 618, in which the H profile shows three components: a narrow one of FWHM 200 km s-1, an intermediate of 1700 km s-1, and a broad component of 3200 km s-1 (Mullaney & Ward, 2008). For Mrk 573, we would be seeing the narrow and intermediate components, while the broadest one would be obscured. The existence of an obscuring structure is also in agreement with the X-ray spectra being Compton thick based on the large EW of the Kα fluorescent iron line (Guainazzi et al., 2005). Indeed, from high-spatial resolution color maps, Quillen et al. (1999) reported the presence of a bar of length 2″, together with leading dust lanes and possibly a dusty disk perpendicular to the jet. Guainazzi et al. (2005) claimed that the presence of dust lanes is correlated with X-ray obscuration.
From all the above considerations, we can re-classify the nucleus of Mrk 573 as a hidden NLSy1, a new member of the class proposed by Nagar et al. (2002) and Dewangan & Griffiths (2005). It shares the properties of the class: X-ray variability within similar timescales, steep photon spectral index, high intrinsic absorption column density, and prominent iron Kα line. It is also worth to mention that in the infrared spectrum the Pa profile is very similar to that of NGC 5506, presenting in both cases a broad pedestal (FWHM km s-1).
A possible scenario that would explain the observed properties of Mrk 573 would be the existence of a clumpy dusty torus (Nenkova et al., 2002; Hönig et al., 2006; Hönig & Beckert, 2007) that at the epoch of the observations was optically thinner, revealing high-density regions capable of producing the O I and Fe II lines, together with the intermediate component of Pa. The clumply torus model would allow mutations between Type 1 and Type 2 objects, as for NGC 7582 (Aretxaga et al., 1999), which is one of the three objects classified by Dewangan & Griffiths (2005) as an obscured NLSy1. This scenario would also explain the detection of the permitted O I and Fe II lines, the relatively broad component of Pa, and the unidentified 0.962, 1.287, and 1.292 µm features, that were not reported in the Riffel et al. (2006) near-infrared spectrum, obtained in October 2003.
A more complex revision of this scenario was discussed by Elitzur & Shlosman (2006), in which the clumpy torus would be formed as an outflow or hydromagnetic disk wind. They proposed that the torus dissapears when the bolometric luminosity goes below erg s-1, since the accretion onto the central black hole cannot then sustain the necessary cloud outflow rate. They also predict that for even lower luminosities the BLR would also dissapear, due to the suppression of the cloud outflow. Mrk 573 could be near the lower luminosity limit required for the maintenance of the cloud outflow, leading to the eventual demise of the obscuring structure.
References
- Aretxaga et al. (1999) Aretxaga, I., Joguet, B., Kunth, D., Melnick, J., & Terlevich, R. J. 1999, ApJ, 519, 123
- Boller et al. (1996) Boller, T., Brandt, W. N., & Fink, H. 1996, A&A, 305, 53
- Boroson (2002) Boroson, T. A. 2002, ApJ, 565, 78
- Collin & Joly (2000) Collin, S., & Joly, M. 2000, New Astron. Rev., 44, 531
- Dewangan & Griffiths (2005) Dewangan, G. C., & Griffiths, R. E. 2005, ApJ, 625, 31
- Elitzur & Shlosman (2006) Elitzur, M. & Shlosman, I. 2006, ApJ, 648, 101
- Erkens et al. (1997) Erkens, U., Appenzeller, I., & Wagner, S. 1997, A&A, 323, 707
- Grandi (1980) Grandi, S.A. 1980, ApJ, 238, 10
- Grupe (2004) Grupe, D. 2004, AJ, 127, 1799
- Guainazzi et al. (2005) Guainazzi, M., Matt, G., & Perola, G. C. 2005, A&A, 444, 119
- Hönig et al. (2006) Hönig, S. F., Beckert, T., Ohnaka, K., & Weigelt, G. 2006, A&A, 452, 459
- Hönig & Beckert (2007) Hönig, S. F., & Beckert, T. 2007, MNRAS, 380, 1172
- Johansson & Jordan (1984) Johansson, S. & Jordan, C. 1984, MNRAS, 210, 239
- Leighly (1999) Leighly, K. M. 1999, ApJS, 125, 317
- Manchado et al. (2004) Manchado, A., et al. 2004, Proc. SPIE, 5492, 1094
- Mathur et al. (2001) Mathur, S., Kuraszkiewicz, J., & Czerny, B. 2001, New Astron., 6, 321
- Mullaney & Ward (2008) Mullaney, J. R., & Ward, M. J. 2008, MNRAS, tmp, 184
- Nagao et al. (2004) Nagao, T., et al. 2004, AJ, 128, 109
- Nagar et al. (2002) Nagar, N. M., Oliva, E., Marconi, A., & Maiolino, R. 2002, A&A, 391, L21
- Nenkova et al. (2002) Nenkova, M., Ivezić, ., & Elitzur, M. 2002, ApJ, 570, 9
- Osterbrock & Pogge (1985) Osterbrock, D. E. & Pogge, R. W. 1987, ApJ, 297, 166
- Pogge & De Robertis (1995) Pogge, R. W. & De Robertis, M. M. 1995, ApJ, 451, 585
- Pogge (2000) Pogge, R. W. 2000, New Astron. Rev., 44, 381
- Quillen et al. (1999) Quillen, A. C., Alonso-Herrero, A., Rieke, M. J., McDonald, C., Falcke, H., & Rieke, H. 1999, ApJ, 525, 685
- Ramos Almeida et al. (2006) Ramos Almeida, C., Pérez García, A. M., Acosta-Pulido, J. A., Rodríguez Espinosa, J. M., Barrena, R., & Manchado, A. 2006, ApJ, 645, 148
- Riffel et al. (2006) Riffel, R., Rodríguez-Ardila, A., & Pastoriza, M. G. 2006, A&A, 457, 61
- Riffel et al. (2006) Riffel, R., Pastoriza, M. G., Rodríguez-Ardila, A., & Maraston, C. 2007, ApJ, 659, 103
- Rodríguez-Ardila et al. (2002a) Rodríguez-Ardila, A., Viegas, S. M., Pastoriza, M. G., & Prato, L. 2002a, ApJ, 579, 214
- Rodríguez-Ardila et al. (2002b) Rodríguez-Ardila, A., Viegas, S. M., Pastoriza, M. G., & Prato, L. 2002b, ApJ, 565, 140
- Rodríguez-Ardila et al. (2005) Rodríguez-Ardila, A., Contini, M., & Viegas, S. M. 2005, MNRAS, 357, 220
- Rudy et al. (2000) Rudy, R. J., Mazuk, S., Puetter, R. C., & Hamann, F. 2000, ApJ, 539, 166
- Rudy et al. (2001) Rudy, R. J., Lynch, D. K., Mazuk, S., Venturini, C. C., Puetter, R. C., & Hamann, F. 2001, PASP, 113, 916
- Ruiz et al. (2005) Ruiz, J. R., et al. 2005, AJ, 129, 73
- Schlegel et al. (1998) Schlegel, D. J., Finkbeiner, D. P., & Davis, M. 1998, ApJ, 500, 525
- Sharpee et al. (2003) Sharpee, B., Williams, R., Baldwin, J. A., & van Hoof, P. A. M. 2003, ApJS, 149, 157
- Sigut & Pradhan (2003) Sigut, T. A. A. & Pradhan, A. K. 2003, ApJS, 145, 15
- Tsvetanov & Walsh (1992) Tsvetanov, Z., & Walsh, J. R. 1992, ApJ, 386, 485
- Vacca et al. (2003) Vacca, W. D., Cushing, M. C., & Rayner, J. T. 2003, PASP, 115, 389
- Veilleux et al. (1997) Veilleux, S., Goodrich, R. W., & Hill, G. J. 1997, ApJ, 477, 631
- Véron-Cetty et al. (2001) Véron-Cetty, M.-P., Véron, P., & Con alves, A. C. 2001, A&A, 372, 730
| Line Nucleus | Flux | FWHM | |
|---|---|---|---|
| (µm) | 10-15 ergs cm-2 s-1 | km s-1 | |
| 0.907 | 116 3 | 470 20 | |
| 0.953 | 279 3 | 378 8 | |
| O I + He I ? | 0.962 | 26.5 1.7 | 680 50 |
| 0.982 | 2.9 0.6 | 260 90 | |
| 0.985 | 5.4 0.8 | 250 90 | |
| 0.991 | 13.6 0.8 | 200 40 | |
| Pa | 1.005 | 4.4 0.5 | … |
| He II | 1.012 | 21.3 0.8 | 510 30 |
| 1.029 | 5.6 0.7 | 210 80 | |
| 1.032 | 9.4 0.9 | 670 90 | |
| He I | 1.083 | 119 2 | 370 14 |
| Pa | 1.094 | 16.6 1.6 | 430 60 |
| O I | 1.128 | 2.6 0.9 | … |
| 1.147 | 3.3 0.7 | 340 140 | |
| 1.188 | 3.4 0.7 | … | |
| 1.252 | 8.5 0.7 | 200 40 | |
| 1.257 | 17 1 | 620 50 | |
| Pa narrow | 1.282 | 15.7 1.3 | … |
| Pa broad | 1.282 | 16 3 | 1700 400 |
| Ne II ? | 1.287 | 10.3 1.7 | 270 50 |
| Ne I ? | 1.292 | 8.6 0.9 | 350 60 |
| O I | 1.317 | 8 2 | 320 100 |
| 1.321 | 13 3 | 480 160 |