Furuya et al.Dense Cores in GF 9 Filament \Received2007/11/20\Accepted
and
ISM: clouds — ISM: evolution — individual (GF 9, L 1082) — molecules — stars: formation — pre-main sequence
Low-Mass Star Forming Cores in the GF 9 Filament ††thanks: Accepted by PASJ (vol. 60); preprint with the original quality figures are available at http://subarutelescope.org/staff/rsf/publication.html
Abstract
We carried out an unbiased mapping survey of dense molecular cloud cores traced by the NH3 (1,1) and (2,2) inversion lines in the GF 9 filament which contains an extremely young low-mass protostar GF 9-2 (Furuya et al. 2006, ApJ, 653, 1369). The survey was conducted using the Nobeyama 45 m telescope over a region of with an angular resolution of \timeform73”. The large-scale map revealed that the filament contains at least 7 dense cores, as well as 3 possible ones, located at regular intervals of pc. Our analysis shows that these cores have kinetic temperatures of 10 K and LTE-masses of 1.8 – 8.2 \MO, making them typical sites of low-mass star formation. All the identified cores are likely to be gravitationally unstable because their LTE-masses are larger than their virial masses. Since the LTE-masses and separations of the cores are consistent with the Jeans masses and lengths, respectively, for the low-density ambient gas, we argue that the identified cores have formed via the gravitational fragmentation of the natal filamentary cloud.
1 Introduction
A filamentary dark cloud often provides us with a unique opportunity to investigate the formation and evolution of a dense cloud core, the birthplace of low-mass stars, through fragmentation processes. The dense cores appear to maintain themselves as substructures in the parental cloud that is known to be mostly governed by supersonic turbulence. The dense cores usually exhibit supersonic line widths; the turbulence prevents the gravitational collapse of the cores. It is now widely accepted that the turbulence plays a fundamental role in controlling core formation processes (e.g., Mac Low & Klessen 2004; Ballesteros-Paredes et al. 2007 for reviews and references therein). Possible mechanisms for the core formation and collapse have a widespread range from the gradual release of magnetic support (e.g., Shu, Adams & Lizano 1987) to the dynamical dissipation of turbulent waves (e.g., Larson 1981; Ostriker et al. 2001; Padoan & Nordlund 2002). Although we now have a good overall picture of the theory of low-mass star formation (e.g., McKee & Ostriker 2007), observational verification of how dense cores form and collapse has produced limited success.
There have been quite a few observational studies which have assessed the initial conditions for the gravitational collapse of a dense core. The low-mass protostar GF 9-2 with bolometric luminosity and temperature of \LO and K, respectively (Wiesemeyer 1997), remains the best-characterized extremely young protostar that would be a missing link between starless cores and class 0 protostars. The natal core of GF 9-2 is believed to retain the initial conditions of the gravitational collapse because the central protostar has not launched an extensive outflow. Namely the core has not yet been destroyed by an extensive outflow (Furuya et al. 2006; hereafter paper I). Our detailed analysis suggested that the core has undergone its gravitational collapse for years (the free-fall time) from initially unstable state (Larson 1969; Penston 1969; Hunter 1977), and that the protostar has formed years ago. Notice that the GF 9-2 core is cross-identified as L 1082C in Benson & Myers (1989), LM 351 in Lee & Myers (1999, hereafter LM99), and GF 9-Core in Ciardi et al. (2000); the central Young Stellar Object (YSO) is also recognized as PSC 205036006.
Besides the presence of GF 9-2, the filamentary dark cloud GF 9 (Schneider & Elmegreen 1979) would be an ideal laboratory to establish a core formation scenario through the fragmentation of a filamentary cloud, because an ISO imaging survey in the far-infrared has demonstrated the presence of several class 0 and I sources (Wiesemeyer 1997; Wiesemeyer et al 1999). Towards our ultimate goal of defining an observational framework for the cloud core formation, the first step is to investigate the physical properties of dense cores formed in the filament. We therefore performed an unbiased survey of dense cores in the GF 9 filament. The filament has an extent of in the optical image (Schneider & Elmegreen 1979); the eastern part of the cloud was firstly identified by Lynds (1962) as L 1082. The distance () to the GF 9 cloud is still controversial, as discussed in Grenier et al.(1989) and Poidevin & Bastien (2006, and references therein). In order to keep consistency with paper I, we adopt 200 pc, as reported by Wiesemeyer (1997), who derived the distance towards GF 9-2 based on star counts, instead of 440 pc (Viotti 1969).
2 Observations and Data Reduction
We carried out simultaneous observations of the NH3 (1,1) and (2,2) lines using the Nobeyama Radio Observatory (NRO)111Nobeyama Radio Observatory is a branch of the National Astronomical Observatory of Japan, National Institutes of Natural Sciences. 45 m telescope over 16 days in 2006 April. We used the 22 GHz cooled HEMT receiver (H22) which receives right- and left-hand circular polarization components simultaneously. The beam width () and main-beam efficiency () of the telescope were \timeform73”\timeform0.”2 and %, respectively, at 23.0 GHz. To obtain the dual polarization data of the (1,1) line, we configured two Auto Correlator (AC) spectrometers having 8 MHz bandwidth with 1024 channels; the newly enhanced capability provided us with a factor of 3 times higher velocity resolution than the previous one. After on-line smoothing with the Hamming window function, the effective velocity resolution () for the NH3 (1,1) lines is 0.180 km s-1. For the (2,2) transition, we used two acousto-optical spectrometers (AOSs) which provide of 0.494 km s-1. Here, we adopt the rest frequencies of 23694.4955 MHz for the (1,1) transition (Ungerechts, Walmsley & Winnewisser 1980; hereafter UWW80) and 23722.6336 MHz for (2,2) (Lovas 1992) transition.
We performed mapping observations under full-beam sampling to cover the whole of the GF 9 filament previously imaged with the H2CO absorption line (Güsten 1994). Using position-switching mode, we observed a total of 766 points by dividing the filament into 8 rectangular regions; each region was mapped with a grid spacing of \timeform80”. The telescope pointing was checked every 4 hours and was found to be accurate within \timeform5”. The daily variation of the H22 receiver gain was checked by the peak antenna temperature () of the NH3 (1,1) emission towards the GF 9-2 core center. We estimate that the final uncertainty in flux calibration is 22%. All the spectra were calibrated by the standard chopper wheel method and converted into the main-beam brightness temperature ( ) scale. At the final stage of the spectral data reduction, the dual polarization data were concatenated to increase the signal-to-noise ratio (S/N). Subsequently we made a total integrated intensity map with an effective resolution of \timeform100” from smoothed velocity channel maps by a Gaussian function with \timeform68”.
In addition, we performed deep single-point integrations towards the approximate center positions of 9 cores on the basis of preliminary NH3 maps made during the mapping observations. These deep integrations were intended to obtain a better estimate of the intensity ratio of the (1,1) to (2,2) transition, and gave a 4–5 times lower noise level than that in the mapping observations.
3 Results and Analysis
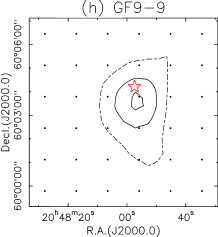
In this section, we present the total integrated intensity map of the NH3 (1,1) emission, as well as the (1,1) and (2,2) spectra obtained through the deep integrations. Since the (2,2) emission was detected only towards the GF 9-2 and -9 core centers, we do not present the map of the transition.
3.1 Identification of Dense Cloud Cores in the Filament
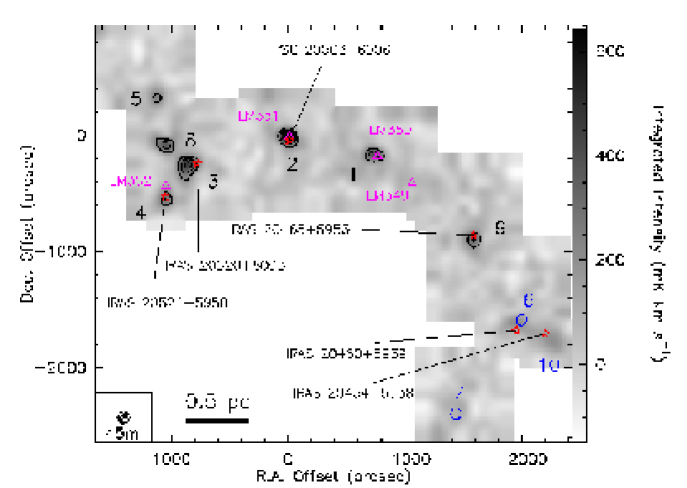
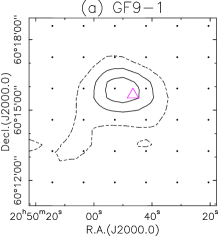
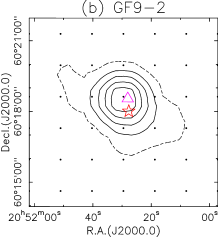
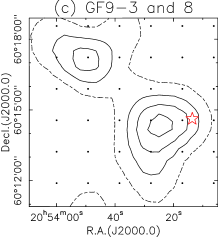
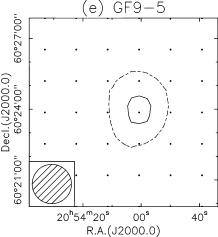
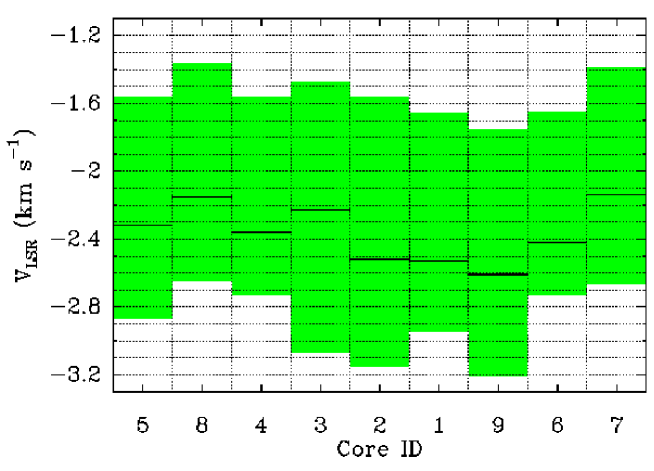
Figures 1 and 2 show total integrated intensity maps of the NH3 (1,1) emission for the whole filament and individual cores, respectively. Here, we integrated the main group of the hyperfine (HF) emission (Wilson, Bieging & Downes 1978; UWW80) between km s-1 and km s-1. To find the velocity range, we made figure 3 where we present the LSR-velocity ranges of the main HF groups for the 9 spectra (figure 4) taken with the deep integrations (section 2). The velocity range for each core is defined by the two LSR-velocities where the intensity of the main HF group drops to the 1.5 level. All 9 spectra showed similar velocity ranges; the most blue- and redshifted velocities are found to be km s-1 in core 9 and km s-1 in core 8, respectively.
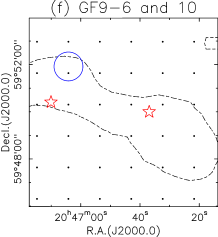
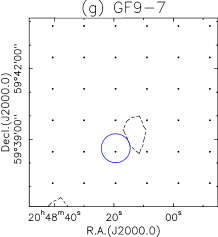
Figure 1 clearly shows the presence of 7 dense cloud cores, labeled GF 9-5, 8, 4, 3, 2, 1, and 9 from the east to the west; table 1 summarizes the peak positions of the cores, together with the other names found in the literature. The peak of these cores exceeds our detection threshold of S/N 6, which means S/N 3 for the 50% level contour with respect to the peak intensity. Notice that each core is detected at only a few observing points as shown in figure 2. Figure 2f shows that the two core candidates GF 9-6 and 10 have peak intensities of 3 S/N 6. They are probably real objects because they seem to contain IRAS sources within the 3 level contours. The GF 9-10 core may be a new detection, although we have to verify its presence by obtaining a better S/N. Although the GF 9-7 core candidate can be marginally recognized above the 3 level in figure 2g, we clearly detected the (1,1) emission through the deep integration (figure 4g). The GF 9-2, 3, and 4 cores were detected in NH3 (1,1) with the Haystack 37 m telescope ( \timeform87”; BM89) and were designated as L 1082C, A, and B, respectively. The GF 9-8 core is also seen in figure 33 of BM89, but these authors have not given the core an identification number. The GF 9-8 core has not been observed in NH3 mapping with the Effelsberg 100 m telescope ( \timeform40” ; Wiesemeyer 1997). It is interesting that the GF 9-5 and 8 cores as well as the GF 9-7 core candidate do not exhibit YSO activity, suggestive of starless cores.
No dense core was detected towards the “embedded YSO” of LM 349 (LM99), while the two “embedded YSOs” of LM 350 and 351 are associated with the NH3 cores. Here, an “embedded YSO” is far-infrared bright YSO selected from the IRAS point source catalog (see LM99 for defintion). The relationship between the remaining “embedded YSO” of LM 352 and the GF 9-4 core is not clear (see figure 2d). The absence of an NH3 core around LM 349 implies that the “embedded YSO” may be a very low-mass object whose core mass is too small to be detected by our mapping survey. We also point out that LM 349 is close to one of the local peaks in the 13CO (1–0) column density map of Ciardi et al. (2000; see also figure 1 of Poidevin & Bastien 2006).
It is worth noting that the IRAS sources located in the GF 9-3 and -4 cores are driving weak molecular outflows with momentum rates of , \MO km s-1 yr-1 (Bontemps et al. 1996), approximately along the north-south direction.
Last, it is likely that the number density of the cores tends to become high towards the east, while low to the west. In fact, the four cores in the eastern part of the filament, GF 9-3, 4, 5, and 8 seem to be confined to a rather small region of 0.8 pc. Since the mean separation between the two neighboring cores is 0.36 pc, they can be treated as a group of cores. Similarly, we consider the GF 9-6 and -10 core candidates as another group. Here, the separations are calculated using the peak positions in table 1. Consequently, the two core groups, the isolated GF 9-2, 1, and 9 cores, and the candidate core GF 9-7 are located at regular intervals of 0.9 pc.
3.2 NH3 Spectra towards the Cores
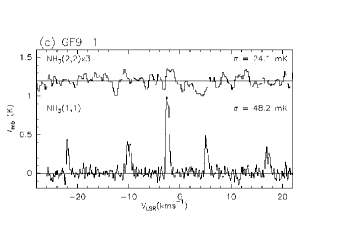
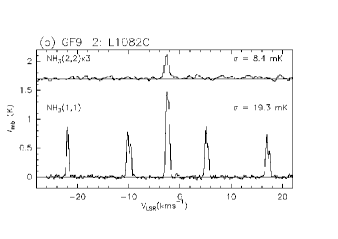
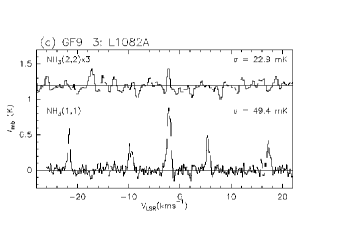
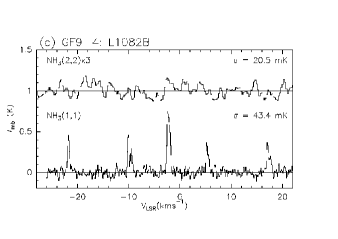
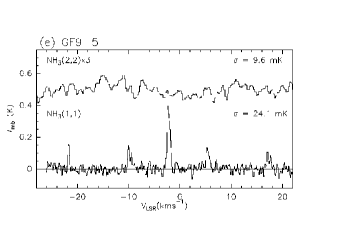
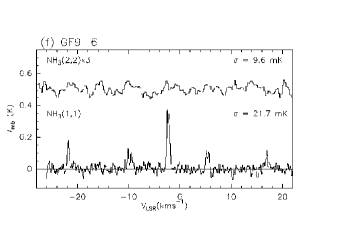
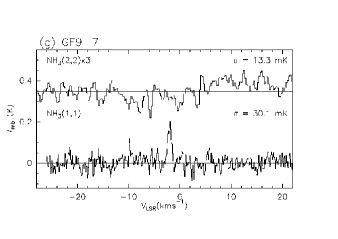
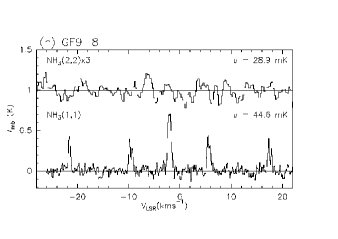
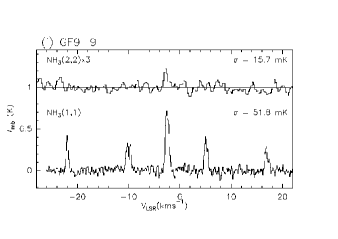
Figure 4 presents the 9 spectra of the NH3 and (2,2) rotation inversion lines obtained by the deep integrations (section 2). All the observed positions showed the intense (1,1) emission with the distinct five groups of the HF components, except for GF 9-7, where the inner satellite HF groups at +6 km s-1 and km s-1 are barely recognized. Notice that the NH3 spectra for the core candidates GF 9-6 and 7 were not taken towards the exact peak positions of the cores (see figure 2f and g).
In contrast to the (1,1) lines, sole the main HF group of the (2,2) transition was detected towards only GF 9-2 and -9 with S/N 3. Given the attained S/N in our observations, non-detection of the satellite (2,2) HF groups does not give a stringent limit in the optical depth, namely, since the intrinsic ratio of the main to satellite groups is about 15.9 for the (2,2) transition (Wilson et al. 1978). Nevertheless, we believe that the (2,2) lines are optically thin because the observed is considerably lower than the excitation temperature of the (1,1) transition, (1,1) (7.4 – 9.5 K; described in section 3.3).
3.3 Hyperfine Structure Analysis and Column Density Calculations
It is difficult to accurately know how each core is extended because our survey observations have been conducted with full-beam sampling. We therefore limit our analysis to the peak spectra which have sufficient S/N, instead of making source-averaged spectra. To calculate beam-averaged NH3 column densities (), we employed hyperfine structure (HFS) analysis, which gives the total optical depth (), the velocity width (), and the LSR-velocity of one of the HF components (). Here, is the FWHM of a single HF component and is assumed to be identical for all the HF components, and is defined by the sum of the optical depths of all the HF components. The is subsequently deconvolved with the instrumental velocity resolution (section 2) to estimate an intrinsic velocity width (). It should be noted that is free from velocity width increase caused by high optical depth because our HFS analysis solves and at the same time. We followed the procedure used in paper I; our analysis is essentially equivalent to that summarized in Stutzki & Winnewisser (1985) and other papers of, e.g., Winnewisser, Churchwell & Walmsley (1979), UWW80, Pauls et al. (1983), and Ungerechts, Winnewisser & Walmsley (1986).
First, we fitted one Gaussian profile to the main HF group of the (1,1) and (2,2) spectra. Table 2 summarizes the obtained peak temperatures in , which are used to calculate the rotational temperature between the (1,1) and (2,2) levels () in the third step. Second, we performed the HFS analysis of the (1,1) spectra. The resultant parameters of , , and are summarized in table 2; these values are plotted in figure 3 as well. Third, using eq.(4) of Ho & Towns (1983), we calculated with the above peak values for both the transitions and . To use the equation, we gave the mean optical depth of the (1,1) line by /18, where the denominator of 18 is the number of (1,1) HF components (e.g., UWW80). For the 7 cores where the (2,2) transition was not detected, we adopted the 3 upper limit as a peak . Table 2 shows that was calculated to be 7.40.3 K for GF 9-2 and 7.90.4 K for GF 9-9, while the other cores have upper limits ranging between 7.1 K and 12.8 K. Fourth, given , , and excitation temperature (), we calculated the beam-averaged column density of NH3 molecules in the (1,1) level, , leading to with the value. For this purpose, we used eq.(2) in UWW80. We assumed that all the energy levels are in LTE at temperature , and that is equal to as well as the gas kinetic temperature () of the core, i.e., . The cores are dense ( cm-3) enough to make our assumption valid (Stutzki & Winnewisser 1985; Taffala et al. 2004). We believe that this assumption is reasonable because the derived agrees well with of C18O (1–0) (7–8 K for GF 9-2, 3, and 4; Myers, Linke & Benson 1983), 13CO (1–0) (7.2 K for GF 9-2; Ciardi et al. 2000), and N2H+ (1–0) (9.5 K; paper I). We consequently obtained the NH3 column densities as summarized in table 3. Here, we exclude the candidate cores No. 6, 7, and 10 with insufficient S/N. We found that the error in and the possible uncertainty in of 7.4 – 9.5 K caused uncertainties in ranging from (GF 9-2) to 33% (GF 9-5).
Last, we verified whether or not the above results towards the GF 9-2 core are consistent with those obtained from the spectra with coarse velocity resolution in paper I (see the core center portions of tables 5 and 6). It should be noted that the optical depth given in table 5 of paper I is that for the most intense HF component, which can be converted into of 6.80.4 and the value does not significantly differ from the new value of 8.00.2 in this work. The high velocity resolution in this study gives times narrower than that in the previous work. The most significant difference between the two studies is that the new observations have succeeded in detecting the (2,2) transition, leading to the low values. In other words, the cold temperature is the main cause of the higher (NH3), by a factor of 3 compared with paper I.
3.4 LTE Masses of the Cores
Once the beam-averaged has been obtained, one can calculate the LTE-mass, , within the beam by supplying the fractional abundance of NH3 molecules, (NH3). We assumed that (NH3) , estimated in GF 9-2 (paper I), is valid for the other cores. Notice that, as addressed in paper I, the adopted abundance has reasonable agreement with those in similar objects (Jijina, Myers & Adams 1999). The resultant ranges from 1.8 \MO (GF 9-5) to 8.2 \MO (GF 9-2) (table 3). Although the LTE-mass for GF 9-2 seems to be twice the previous estimate of 4.52.4 \MO, the two measurements can be reconciled considering the 50% uncertainty in (NH3 ) and the difference between the adopted core sizes (5.5 pc2 in paper I, versus 3.9 pc2 in this work). Notice that the 50% uncertainty in (NH3) causes a significantly larger error in than those from the uncertainties in and described in the previous subsection.
3.5 Velocity Widths and Virial Masses of the Cores
In table 2, we summarize the values obtained through the HFS analysis. Clearly, the observed intrinsic velocity widths in all the cores are 2–3 times larger than of 0.16 – 0.18 km s-1 for the range of 7.4 – 9.5 K [ ]. This fact indicates that the internal motions of all the cores are dominated by non-thermal pressure (), such as supersonic turbulence. Assuming that the non-thermal motions as well as the thermal ones support the cores against their self-gravity, we calculated virial masses ( ; see table 3) using in table 2. In section 4.1, we compare with in the context of the dynamical instability of the cores.
4 Discussion
4.1 Gravitational Instability of the Cores
It is probable that all the cores in the GF 9 filament are gravitationally unstable because (table 3) if we interpret that the non-thermal velocity widths are due to the supersonic turbulence within the cores. Here, another distance estimate of 440 pc (section 1) does not alter the relationship of because is proportional to while varies with . To verify the interpretation, we should assess origin of the non-thermal widths, as done in Ciardi et al. (2000) and paper I. In addition to the turbulent motions, it is well known that spectral line profiles can be broadened beyond their thermal widths owing to systematic motions of gas such as stellar winds or/and infall. However, it is unlikely that arises primarily from supersonic stellar winds or outflows because, to our knowledge, the NH3 inversion lines do not trace molecular outflows, but static dense gas.
We suggest that the non-thermal velocity widths of the cores are produced by the large-scale infall motions rather than the turbulent ones. In fact, we discussed the presence of the supersonic infalling motions all over the GF 9-2 core in paper I. Our recent follow-up observations have clearly detected blue-skewed profiles in the optically thick HCO+ (3–2) and (1–0) lines over the GF 9-2 core (R. S. Furuya et al., in prep.). Moreover, we have detected such blue-skewed profiles towards the peak positions of the GF 9-4, 8, and 9 cores with the (3–2) transition. These facts reinforce the idea that the internal motions of the cores in the GF 9 filament are dominated by the large-scale supersonic infalling motions, although we have to assess the presence of the infall in all the cores through mapping observations. If this interpretation is valid for all the cores, should be calculated solely with the thermal width, i.e., , yielding 0.19 – 0.25 \MO for the range of 7.4 – 9.5 K. This estimate suggests that most of the cores should be gravitationally unstable because in spite of the uncertainty in .
4.2 Formation of the Cores in the Filament
A gravitational fragmentation process can explain why the dense cores in the GF 9 filament are located at regular intervals of 0.9 pc (see figure 1). Recall that we consider the GF 9-5, 8, 4, and 3 cores, as well as the GF 9-6 and 10 core candidates, as groups (. For simplicity, we compare the core separation with an expected Jeans length () for the filament. Ciardi et al. (2000) estimated a density of 200 cm-3 for the GF 9 filament from their 13CO (1–0) observations. Assuming that the ambient gas has a typical density of cm-3, is computed to be 0.6 pc at 10 K. This estimate is not significantly different from the core separation of 0.9 pc. Here, the temperature of 10 K is taken from the typical peak (6–7 K) of the optically thick 12CO (3–2) and (1–0) emission derived in the ambient gas around the GF 9-2 core (paper I). In addition, the Jeans mass for 10 K and cm-3 is calculated to be \MO which is comparable to the core LTE-masses (table 3). Such an estimate based on the ”classical” Jeans analysis implies that the fragmentation of the filament has been caused by the gravitational instability.
Alternatively, the spatial distribution of the identified cores might be understood in terms of the magnetohydrodynamical instability of the GF 9 filamentary cloud, as Hanawa et al. (1993) proposed for interpreting the ongoing fragmentation process in the Orion A filamentary cloud. They discussed that the effective sound velocity increases when the effect of magnetic field and/or rotation is considered [see their eq.(11)], and that the Jeans length of the filament becomes as short as the core separation unless the filament is almost perpendicular to the plane-of-sky. The apparent configuration of the GF 9 filament would be somewhat similar to that of the Orion cloud. However, to make such a comparison, we need to know not only basic parameters characterizing the filament such as length, width, inclination angle, and total mass, but also magnetic field strength and/or velocity field.
5 Summary
Using the Nobeyama 45 m telescope, we carried out an unbiased survey of dense molecular cores in the GF 9 filament. The obtained large-scale map of the NH3 (1,1) emission revealed that the filament contains 7 dense ( cm-3) and cold ( 10 K) cores having the LTE-masses of 1.8 – 8.2 \MO and the three candidates located at the regular intervals of pc. We argued that these cores appear to be gravitationally unstable and have formed through the gravitational fragmentation of the natal filamentary cloud. Further high-resolution imaging of the identified cores, as well as a search for blue-skewed infall profiles over the cores will allow us to discuss the physical properties of the cores on a more solid ground. We lastly point out that good knowledge of the velocity field of the low-density inter-core gas traced by, e.g., the 13CO (1–0) line will provide us with an essential clue towards understanding the formation mechanism of star forming cores in a filamentary cloud.
The authors sincerely thank Thomas A. Bell for critical reading of the paper. R. S. F. thanks Isabel de Maurissens for providing a copy of the Viotti (1969) paper which is published in Memorie della Societa Astronomia Italiana. It is a great pleasure to thank the staff of NRO for their generous help during the observations. This work is partially supported by a Grant-in-Aid for Scientific Research (A) from the Ministry of Education, Culture, Sports, Science and Technology of Japan (No. 19204020).
References
- [Ballesteros-Paredes et al.(2007)] Ballesteros-Paredes, J., Klessen, R. S., Mac Low, M.-M., & Vazquez-Semadeni, E. 2007, Protostars and Planets V, 63
- [Benson & Myers(1989)] Benson, P. J., & Myers, P. C. 1989, ApJS, 71, 89
- [Bontemps et al. (1996)] Bontemps, S., André, P., Terebey, S., & Cabrit, S. 1996, A&A, 311, 858
- [Ciardi et al.(2000)] Ciardi, D. R., Woodward, C. E., Clemens, D. P., Harker, D. E., & Rudy, R. J. 2000, AJ, 120, 393
- [Furuya et al.(2006)] Furuya, R. S., Kitamura, Y., & Shinnaga, H. 2006, ApJ, 653, 1369 (paper I)
- [Grenier et al.(1989)] Grenier, I. A., Lebrun, F., Arnaud, M., Dame, T. M., & Thaddeus, P. 1989, ApJ, 347, 231
- [Güsten (1994)] Güsten, R. 1994, The Cold Universe, 169
- [Hanawa et al.(1993)] Hanawa, T., et al. 1993, ApJ, 404, L83
- [Ho & Townes (1983)] Ho, P. T. P. & Townes, C. H. 1983, ARA&A, 21, 239
- [Hunter (1977)] Hunter, C. 1977, ApJ, 218, 834
- [Jijina et al. (1999)] Jijina, J., Myers, P. C., & Adams, F. C. 1999, ApJS, 125, 161
- [Larson (1969)] Larson, R. B. 1969, MNRAS, 145, 271
- [Larson (1981)] Larson, R. B. 1981, MNRAS, 194, 809
- [Lee & Myers(1999)] Lee, C. W., & Myers, P. C. 1999, ApJS, 123, 233 (LM99)
- [Lovas(1992)] Lovas, F. J. 1992, Journal of Physical and Chemical Reference Data, 21, 181
- [Lynds (1962)] Lynds, B. T. 1962, ApJS, 7, 1
- [Mac Low & Klessen(2004)] Mac Low, M.-M., & Klessen, R. S. 2004, Reviews of Modern Physics, 76, 125
- [McKee & Ostriker(2007)] McKee, C. F., & Ostriker, E. C. 2007, ARA&A, 45, 565
- [Myers et al.(1983)] Myers, P. C., Linke, R. A., & Benson, P. J. 1983, ApJ, 264, 517
- [Ostriker et al.(2001)] Ostriker, E. C., Stone, J. M., & Gammie, C. F. 2001, ApJ, 546, 980
- [Padoan & Nordlund (2002)] Padoan, P., & Nordlund, Å. 2002, ApJ, 576, 870
- [Pauls et al. (1983)] Pauls, A., Wilson, T. L., Bieging, J. H., & Martin, R. N. 1983, A&A, 124, 23
- [Penston (1969)] Penston, M. V. 1969, MNRAS, 144, 425
- [Poidevin & Bastien(2006)] Poidevin, F., & Bastien, P. 2006, ApJ, 650, 945
- [Schneider & Elmegreen (1979)] Schneider, S., & Elmegreen, B. G. 1979, ApJS, 41, 87
- [Shu, Adams & Lizano (1987)] Shu, F. H., Adams, F. C., & Lizano, S. 1987, ARA&A, 25, 23
- [Stutzki & Winnewisser(1985)] Stutzki, J., & Winnewisser, G. 1985, A&A, 144, 13
- [Tafalla et al. (2004)] Tafalla, M., Myers, P. C., Caselli, P., & Walmsley, C. M. 2004, A&A, 416, 191
- [Ungerechts, Walmsley, & Winnewisser (1980)] Ungerechts, H., Walmsley, C. M., & Winnewisser, G. 1980, A&A, 88, 259 (UWW80)
- [Ungerechts, Winnewisser, & Walmsley (1986)] Ungerechts, H., Winnewisser, G., & Walmsley, C. M. 1986, A&A, 157, 207
- [Viotti (1969)] Viotti, N. R., 1969, Mem. Soc. Astron. Italiana, 40, 75
- [Wiesemeyer (1997)] Wiesemeyer, H. 1997, The spectral signature of accretion in low-mass protostars, Ph.D. Dissertation, University of Bonn
- [Wiesemeyer et al. (1999)] Wiesemeyer, H., Cox, P., Güsten, R., & Zylka, R. 1999, ESA SP-427: The Universe as Seen by ISO, 533
- [Wilson et al.(1978)] Wilson, T. L., Bieging, J., & Downes, D. 1978, A&A, 63, 1
- [Winnewisser, Churchwell, & Walmsley (1979)] Winnewisser, G., Churchwell, E., & Walmsley, C. M. 1979, A&A, 72, 215

| GF 9-∗ | Other Identifications† | Peak Position‡ | Associated | |||
| W97 | BM89 | R.A.(J2000.0) | Dec.(J2000.0) | YSO | ||
| 5 core | GF 9-5 | \timeform20h54m01s | \timeform60D24’09” | |||
| 3 core | GF 9-3A/3B | L 1082A | \timeform20h53m25s | \timeform60D14’11” | IRAS 20520+6003 | |
| 4 core | GF 9-4 | L 1082B | \timeform20h53m49s | \timeform60D09’30” | IRAS 20526+5958, LM 352 | |
| 8 core | \timeform20h53m52s | \timeform60D17’10” | ||||
| 2 core§ | GF 9-2 | L 1082C | \timeform20h51m29s | \timeform60D18’34” | PSC 20503+6006, LM 351 | |
| 1 core | GF 9-1 | \timeform20h49m50s | \timeform60D15’52” | LM 350 | ||
| 9 core | GF 9-i6 | \timeform20h47m57s | \timeform60D03’24” | IRAS 20468+5953 | ||
| 6 | GF 9-6 | \timeform20h47m05s | \timeform59D51’18” | IRAS 20460+5939 | ||
| 10 | \timeform20h46m28s | \timeform59D48’53” | IRAS 20454+5938 | |||
| 7 | GF 9-7 | \timeform20h48m11s | \timeform59D39’25” | |||
GF 9 core designation numbers with the label of “core” are for the firm detection, while the others for the possible detections. See sections 3.1 and 3.3 for details. We used the same designation number for the cores used in Wiesemeyer et al. (1997) to keep consistency as much as possible. Notice that the above core numbers are different from the GF 9 star designation numbers with upper case S given in Poidevin & Bastien (2006).
References — W97: Wiesemeyer et al. (1997), BM89: Benson & Myers (1989)
The errors in the absolute positions, due to the telescope pointing error (see section 2), are typically \timeform5”.
GF 9-2 core is also identified as GF 9-Core in Ciardi et al. (2000).
| NH3 (1,1) | NH3 (2,2) | ||||||||
| Core† | |||||||||
| (mK) | (km s-1) | (km s-1) | (mK) | (K) | |||||
| 1 | 86050 | 0.370.02 | 4.40.5 | 7.1 | |||||
| 2 | 127090 | 0.390.01 | 8.00.2 | 1109 | 7.40.3 | ||||
| 3 | 74055 | 0.420.02 | 6.00.7 | 7.6 | |||||
| 4 | 63040 | 0.310.02 | 6.90.9 | 7.8 | |||||
| 5 | 32025 | 0.390.03 | 1.80.6 | 9.7 | |||||
| 6 | 31020 | 0.280.02 | 2.10.6 | 10.1 | |||||
| 7 | 16012 | 0.500.08 | 2.01.3 | 12.8 | |||||
| 8 | 63050 | 0.340.02 | 8.41.0 | 7.9 | |||||
| 9 | 60045 | 0.430.02 | 6.30.6 | 576 | 7.90.4 | ||||
All the spectra, except for the core candidates of #6 and #7, have been taken towards the center positions of the identified cores (see figure 2).
Peak for the main group of the hyperfine emission obtained by single Gaussian fitting. The upper limits for the (2,2) transition are the 3 upper limits (see figure 4 as well).
, , and denote, respectively, the centroid velocity, the intrinsic velocity width after correcting for the instrumental velocity resolution, and the total optical depth obtained from the hyperfine structure analysis (see section 3.3 for the details). The errors for are typically less than 0.01 km s-1.
Rotational temperature of NH3 molecules between the (1,1) and (2,2) states (see section 3.3.).
| Core | |||
|---|---|---|---|
| (\MO) | ( cm-2) | (\MO) | |
| 1 | 1.00.09 | 1.00.2 | 4.32.1 |
| 2 | 1.10.03 | 2.00.3 | 8.24.1 |
| 3 | 1.30.16 | 1.60.3 | 6.73.3 |
| 4 | 0.70.08 | 1.40.3 | 5.72.9 |
| 5 | 1.10.18 | 0.440.1 | 1.80.9 |
| 8 | 0.90.09 | 1.80.3 | 7.53.8 |
| 9 | 1.30.12 | 1.70.4 | 7.13.6 |
Virial mass of the cores calculated from (see section 3.5) where is \timeform73”.
Beam-averaged NH3 column density; the errors are calculated from the possible range of 7.4 – 9.5 K and the uncertainties in and .
LTE-mass of the cores calculated from (see section 3.4). Here, denotes the mean molecular weight of 2.33 and the atomic mass of hydrogen. The errors are due to the 50 % uncertainty in the .