do Sul, Av. Bento Gonçalves, 9500, CP 15051, Porto Alegre
11email: santiago@if.ufrgs.br
Deep surface photometry of edge-on spirals in Abell galaxy clusters:
Abstract
Context. There is a clear scarcity of structural parameters for stellar thick discs, especially for spiral galaxies located in high-density regions, such as galaxy clusters and compact groups.
Aims. We have modelled the thin and thick discs of 4 edge-on spirals located in Abell clusters: NGC 705, ESO243G49, ESO187G19, LCSBS0496P. Deep I band images of NGC 705 were taken from the HST archive, whereas the remaining images were obtained with the Southern Telescope for Astrophysical Research (SOAR) in Gunn r filter. They reached surface brightness levels of mag arcsec-2 and mag arcsec-2, respectively.
Methods. Profiles were extracted from the deep images, in directions both parallel and perpendicular to the major axis. Profile fits were carried out at several positions, yielding horizontal and vertical scale parameters for both thin and thick disc components.
Results. The extracted profiles and fitted disc parameters vary from galaxy to galaxy. Two galaxies have a horizontal profile with a strong down-turn at outer radii, preventing a simple exponential from fitting the entire range. For the 2 early-type spirals, the thick discs have larger scalelengths than the thin discs, whereas no trend is seen for the later types . Both the thin and thick discs sampled tend to have similar scalelengths and scaleheights when compared to typical field disc galaxies. However, the thin disc parameters of the 2 farthest galaxies, both late-type spirals, may be significantly affected by seeing effects. Taken at face value, our results suggest that environment plays a minor role in determining the thin and thick disc sizes.
Key Words.:
galaxy formation – galactic discs – stellar populations1 Introduction
At high surface brightness, the light of disc galaxies is dominated by the central spheroidal bulge and the planar disc. The structure and the relative contributions of these two components make up the basis of the morphological classification system and drive our knowledge of galactic structure. In our own Galaxy, however, most of the information on the early processes of mass assembly and star formation is hidden in the unconspicuous and low surface-brightness components, such as the Galactic halo and the thick disc.
The Milky Way’s thick disc has been studied in much more detail than in any other galaxy. Its scaleheight is about 3 times that of the old thin disc, and it is formed by old () and has moderately metal-poor () stars with intermediate kinematical properties between the thin disc and the stellar halo (Wyse 1999, Norris 1999, Kerber, Javiel & Santiago 2001, Du et al. 2003). Data on external thick discs and haloes are hard to obtain, because of the extremely low intensity levels. As a consequence, relatively few and largely nearby galaxies have been studied in depth enough to sample these earlier structural components.
In a few nearby galaxies, the extended thick disc has been studied using resolved stellar population techniques (Mould 2005, Tikhonov , Galazutdinova & Drozdovsky 2005, Seth, Dalcanton & de Jong 2005). Seth et al. (2005) used the Hubble Space Telescope Advanced Camera for Surveys in order to analyse the vertical distribution of stars in low-mass galaxies. They find stellar components well above the thin disc scaleheight and properties similar to the Milky Way thick disc. They also find an increasing age as a function of height consistent with disc heating.
However, most galaxies are still too far to be resolved in stars. This means that their extraplanar light can only be analysed with surface photometry work applied on deep CCD images (Morrison, Boroson & Harding 1994, van Dokkum et al. 1994, Morrison et al. 1997, Abe et al. 1999, Fry et al. 1999, Neeser et al. 2002, Wu et al. 2002). Edge-on orientation is certainly favourable in order to distinguish the vertically extended components from the thin disc and central bulge. Several photometric surveys of edge-on spirals have been undertaken, yielding thin disc structural parameters and, at best, allowing detection of thick disc light (de Grijs 1998, Dalcanton & Bernstein 2000,2002). However, these surveys were not deep enough to allow determination of thick disc structural parameters. Taken together, these studies have revealed that most galaxies exhibit extraplanar light that may often be identified with a thick-disc component. Most of them have demonstrated that a single exponential, or a single surface brightness profile, is not an adequate fit to the vertical distribution of light. Instead, a second component is required, usually with a uniform scaleheight and a larger scalelength as compared to the thin disc. Another interesting development has been the realization that the disc structure parallel to the major axis may often require a 2-piecewise exponential fit, where the change in exponential scale occurs at some (anti-)truncation radius (Pohlen et al. 2004, 2007).
One important feature of most studies aiming at either detecting or measuring the thick disc component in unresolved galaxies is that these tend to be nearby objects (so that the disc scales are resolved well and more easily measured) inhabiting the general field. Environmental effects may have played an important role in shaping the extended low surface-brightness components in galaxies, just as they have done with bulges and thin discs. This may be especially true in scenarios with thick disc formation through accretion events in a hierarchical structure formation such as the one proposed by Abadi et al. (2003) and Brook et al. (2004).
This paper is an initial effort to systematically address a possible environmental effect on thick disc structure by analysing deep images of 4 edge-on spirals located in Abell clusters. Once a sizeable sample is available for different high-density environments, our final goal is to statistically assess the environmental dependence of the structural parameters of extra-planar light in spirals of different types and masses.
2 Data and photometry
The sample was chosen through inspection of Digital Sky Survey (DSS) fields containing rich Abell clusters in the sourthern equatorial hemisphere. Whenever an edge-on candidate was found, we searched for information on it in the NASA Extragalactic Database (NED). Our list includes only objects with semi-major axis , axis ratio and with a measured redshift whose value is close to that of the Abell cluster. Whenever possible the Hubble Space Telescope (HST) archive was searched in order to confirm the edge-on orientation of the candidate in higher resolution . The galaxies studied here are listed in Table 1, where we provide the basic information on them.
-
a
Source: positions, sizes and redshifts were taken from NED. SMA in column 6 stands for semi-major axis. in column 7 is the axis ratio.
For NGC 705, archival images in the F814W filter were found to be deep enough to allow the analysis without further imaging. A total of 11 raw individual exposures totalling 12700s = 3.5hrs were retrieved, reduced, and stacked as discussed below.
Images of ESO243G49, ESO187G19, and LCSBS0496P were obtained in late 2005 with the Optical Imager (SOI) at the Southern Telescope for Astrophysical Research (SOAR). Seeing was always with . The SOI has 2 E2V CCDs, each one with 2k x 4k pixels, covering a field of view of 5.5X5.5 arcminutes. We used the 2x2 binning, yielding a detector scale of 0.154 arcsec/pixel. To reduce instrumental noise, the images were taken on the slow readout mode. The log of observations is given in Table 2. A total of about 3hrs exposure was taken in the Gunn r filter for each galaxy. As our aim was to measure the disc structural parameters, and also to test the SOI detection limits at low surface brightness levels, we decided to make deep exposures on a single filter sensitive to old stellar populations rather than to acquire colour information.
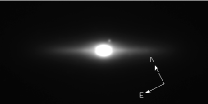
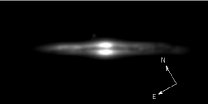
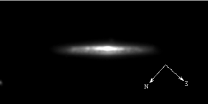
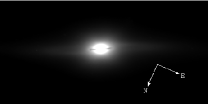
The images were trimmed, bias-subtracted, and flat-fielded using high S/N dome flats. The individual exposures were combined taking the positional dithering into account. The final combined images are shown in Figure 1. Contour plots of the same galaxies are shown in Figure 2.
|
|


|


|
The raw WFPC2/HST frames of NGC 705 were retrieved from the archive, pipelined using IRAF stsdas.wfpc package, and combined. A total of 11 F814W raw frames were successfuly retrieved and stacked in the process. Its final image is also shown in Figure 1.

-
Notes: Column 1: Range perpendicular (zmin:zmax) and parallel (Rmin:Rmax) to major axis where the profile was extracted, in pixels. Pixel scale is 0.154arcsec/pixel; column 2: central pixel position, in pixels; column 3: fit range in pixels used; column 4: panel in Figure 3 where the profile is shown; column 5: artificial shift in surface brightness applied to profile in its panel, mag arcsec2. The larger , the lower the profile position in its panel; column 6: fitted scalength, , in pixels; column 7: scalelength in units of , where and is the Hubble constant in units of km s-1 Mpc-1.
Two very important steps were applied to the combined images: sky-subtraction and masking of contaminating sources. Sky subtraction was performed by iteratively fitting a background plane over points equally spaced on a CCD grid. Grid points that deviated by more than from the median value were rejected, and the median and were recomputed until convergence. This clipping procedure prevented stars and the target galaxies themselves from contaminating the sky fit. After sky subtraction we cut out an image section of the SOI or WFPC2 chip, which conservatively contained the entire galaxy image down to its lowest detectable levels. This image section was then searched for faint sources, either foreground and background, which were masked out by replacing their counts with the mean count within a ring around them. The ring size was varied manually so as to allow an effective masking of contaminated pixels. The search for and masking of contaminating sources was carried out only in regions that were later to be used for the structural modelling. As the galaxies are not superposed on crowded stellar fields, the fraction of masked pixels in these regions was always below 20%.
As a final step before the analysis, the images were rotated to align the galaxy major axis parallel to the horizontal image borders. As common in this type of study, the alignement procedure was done with the fainter and outer isophotes.
Since our goal is to detect the disc components and measure their horizontal and vertical scales, strict photometric calibration was not necessary. For SOI/SOAR, a zero point to the Gunn magnitude scale was found by measuring the instrumental magnitudes and comparing them to the Cousins R magnitudes available in NED. The values are quoted in NED for ESO243G49 and ESO187G19. Aperture photometry within a circle of radius with a zero-point of 25.35 recovers their quoted magnitudes with residuals of 0.02 and -0.04, respectively. We applied the same zero-point to the third galaxy imaged with SOAR, LCSBS0496P. For NGC 705, we used the photometric zero-point quoted by Holtzmann et al. (1995) for WFPC2.
3 Profile fits
Profiles both parallel and perpendicular to each galaxy’s major axis were extracted from the final processed image. We hereafter refer to the image coordinates that run parallel (perpendicular) to the major axis as (). The extraction windows are listed in Tables 3 thru 10. All these tables have the same structure. Column 1 lists the extraction windows [zmin:zmax,Rmin:Rmax] in pixels. Column 2 gives the central pixel along which the profile was extracted. Column 3 gives the range in pixels used in fitting the profiles. In the case of the profiles, two regions are indicated, one for fitting the thin disc, and the outer one where the thick disc was fitted. Column 4 indicates the figure panel and column 5 gives the position (from top to bottom) in this panel where the profile is plotted. Finally, the last two columns list the fit parameters. For the horizontal profiles, only a single exponential fit was carried out, yielding a scalelength , whereas the profiles fits led to the two scaleheights, of the thin and thick disc components ( and , respectively). The profile parameters are shown both in pixels and in units of kpc, where and is the Hubble constant in units of km s-1 Mpc-1. For simplicity, we will not explicitely use the Hubble constant parameterization throughout the text when referring to physical scales. Details on the profile fits are given below.

-
Notes: Column 1: Range perpendicular (zmin:zmax) and parallel (Rmin:Rmax) to major axis where the profile was extracted, in pixels. Pixel scale is 0.154arcsec/pixel; column 2: central pixel position, in pixels; column 3: fit range, in pixels, used for the thin and thick components; column 4: panel in Figure 4 where the profile is shown; column 5: artificial shift in surface brightness applied to profile in its panel, mag arcsec2. The larger , the lower the profile position in its panel; column 6: fitted scaleheights, and , in pixels; column 7: scaleheights in units of , where and is the Hubble constant in units of km s-1 Mpc-1.
The and profiles are shown in Figures 3 thru 10. The panels shown in these figures correspond to the different quadrants relative to the centre and major axis of each galaxy. The quadrants are identified in the figures using the same panel labels as in Tables 3 thru 10. The orientation of the profiles in Figures 1 and 2 is such that increases upwards and increases towards the left in the images.
The extraction and fit regions were chosen to make use of as much independent information as possible from the images, especially at the faint surface brightness levels. Thus, for the profiles, the extraction range in was increased at larger distances from the centre to increase the signal-to-noise ratio (S/N). Similarly, wider ranges in were used to extract the profiles far from the major axis. For a fixed profile, we chose not to bin the profile data unequally in order to increase the signal at the faintest levels, as this would weight the number of data points against these lowest intensity levels, where we expect the thick disc to dominate. This procedure, of course, does not lead to a minimized effect of random noise on the fits, but we opted to pay this price in order to better sample the thick disc component.

The fitting function applied to the profiles was
| (1) |
where is the intensity level at image coordinates , is the central intensity for that profile, is the horizontal exponential scale and is the modified Bessel function of the second type (van der Kruit & Searle 1981). The fit was carried out using and as free parameters in each case. We adopted an exponential function for the profiles:
| (2) |
for each one of the disc components. In the equation above is the intensity at the galaxy disc mid-plane at the each profile position and the exponential scaleheight. We assumed in the fits that the two discs are co-planar. The fits therefore have 4 free parameters, namely, the mid-plane intensities and the scaleheights. The profile fits were done in an iterative way: a first fit to the function shown in equation (2) was made in the outer regions, where the thick disc dominates. The fitted thick disc was then extrapolated towards the disc plane and subtracted from the observed profile within the inner regions listed in the profile tables. The residuals were then fitted to the thin disc, and the result was then extrapolated outwards. The procedure was repeated until convergence to within 5% was reached for all 4 parameters. For some vertical profiles, the fits did not converge after 10 iterations or led to unphysical solutions. We still plot these profiles in Figures 4, 6, 8, and 10 but flag them in the parameter tables with an NA.
We now separately present the profiles and fitting results for each galaxy.
3.1 ESO243G49
This galaxy is an early type spiral located at about 10 arcmin ( Mpc in projected separation) from IC1633, the central dominant (cD) galaxy of Abell 2877. It has essentially the same redshift as the cluster (Abell 2877: ; ESO243G49: ). The profiles shown in Figure 3 follow the same shape with little variation from one quadrant to the next. Such symmetric appearance shows that ESO243G49 has little dust extinction and is fairly undisturbed. The symmetry also indicates that ESO243G49 is very close to a perfect edge-on orientation.
In each panel in the figure, the upper profiles are those along the major axis, whereas the other two are at positions parallel to it. They systematically reach surface brightness levels of mag arcsec-2. Notice that the inner profile region shown is always 100 pixels ( kpc) or farther away from the centre, to avoid the bright bulge (clearly visible in Figure 1). Also note that all these profiles have a break or down-bending in the outer regions (beyond pix kpc); this feature is not accounted for by the fits to an exponential light distribution with an edge-on projection. This down-bending has been previously reported on other edge-on spirals (see Pohlen et al. 2004, 2007) and is discussed later.
-
Notes: Column 1: Range perpendicular (zmin:zmax) and parallel (Rmin:Rmax) to major axis where the profile was extracted, in pixels. Pixel scale is 0.154arcsec/pixel; column 2: central pixel position, in pixels; column 3: fit range in pixels used; column 4: panel in Figure 5 where the profile is shown; column 5: artificial shift in surface brightness applied to profile in its panel, mag arcsec2. The larger , the lower the profile position in its panel; column 6: fitted scalength, , in pixels; column 7: scalelength in units of , where and is the Hubble constant in units of km s-1 Mpc-1.
The fits were carried out at the inner regions, before the observed break in the profiles, and are also shown in the panels. As mentioned earlier, the resulting scalelengths, , are listed in Table 3. A straight average over the individual profile fits yields kpc, with no strong deviant points. Even though the values scatter by no more than 20% around the mean, it is worth noticing the trend toward increasing for the profiles farther away from the disc plane. This may be the result of a larger thick disc scalelength as compared to the thin disc. If we take the last profiles of each panel in Figure 3 as representative of the thick-disc horizontal light distribution, we have an for this component. This is 1.6 times greater than the scalelength resulting from the two major axis profiles.

In Figure 4 we show the profiles for ESO243G49. Again, each panel refers to the profiles in a particular quadrant of the galaxy image. The symmetry among the corresponding profiles in each panel is again clearly visible. Also, nearly all these profiles deviate significantly from a straight line. This means that a single exponential disc model cannot account for the profile shapes. A two-component model is therefore necessary to successfully fit the data. These two- component fits are shown in the panels and were carried out as described in the beginning of this section. The fits avoid the 20 pixels (3.2arcsec) closest to the plane of the galaxy, where seeing effects may be important.
As a rule, these resulting fits from a thin and a thick disc are a very good description of the observed profiles. In general, the fitted scaleheights vary little from one profile to the other. For the thin disc, we have kpc when we average all profiles. Eliminating one obvious outlier yields kpc, the same result as applying an iterative clipping algorithm to the original distribution of . The average thick-disc scaleheight is kpc. Again, the values listed in Table 4 indicate a clearly deviating fitting result. If eliminated, the spread around the average is reduced a lot, yielding kpc. A formal clipping yields kpc.
3.2 ESO187G19
-
Notes: Column 1: Range perpendicular (zmin:zmax) and parallel (Rmin:Rmax) to major axis where the profile was extracted, in pixels. Pixel scale is 0.154arcsec/pixel; column 2: central pixel position, in pixels; column 3: fit range, in pixels, used for the thin and thick components; column 4: panel in Figure 6 where the profile is shown; column 5: artificial shift in surface brightness applied to profile in its panel, mag arcsec2. The larger , the lower the profile position in its panel; column 6: fitted scaleheights, and , in pixels; column 7: scaleheights in units of , where and is the Hubble constant in units of km s-1 Mpc-1.
ESO187G19 is a member of Abell 3716 and is located some 2 arcmin ( Mpc in projected separation) from the cluster centre, although its measured redshift, , is a bit higher than that of the cluster (). In many respects it is a very distinct galaxy when compared to ESO243G49. It is a latter type spiral, with a weak spheroid visible only in its very central regions. It displays a strong dust lane, which cuts the central bulge through its centre. Assuming that this dust absorption originates from the edge of an optically thick thin disc, the inclination of ESO187G19 should be . The galaxy disc is clearly flared in its outer areas ( pixels arcsec kpc), so our profiles are truncated at this radius, and the fits also avoid these flared regions. On the other hand, the much weaker bulge allows the inner fit region to be pix arcsec.
The resulting horizontal profiles and fits are shown in Figure 5. The uppermost ones, corresponding to the major axis, are obviously affected by dust, displaying a wavy shape, not adequately fit by an exponential. The model fits for these profiles are shown just for completeness. The profile distortions are very reduced in the remaining profiles. The corresponding profiles in each quadrant are again very similar, showing the symmetry in the light distribution. Also, the profiles run almost parallel to each other, with no sign of the break in the outer regions seen in the case of ESO243G49. This difference is likely to be real, since in physical units the fitting regions used are very similar in both galaxies.
Averaging over all fits, we find a scalelength kpc. This large scatter is largely caused by a single deviant point, with kpc. Notice that this profile runs along the major axis and is strongly affected by the dust lane, as just mentioned. By applying a clipping to eliminate this outlier, a much more precise kpc is obtained, using 8 out of the 10 profiles shown. In contrast to ESO243G49, no clear trend toward increasing is seen at greater distances from the disc plane.

The vertical profiles of ESO187G19 are shown in Figure 6. Their interpretation is certainly complicated by the clear dust lane, which causes the leveling or down-turning of the profiles at low . The effect of seeing, given the much greater distance, also severely affects the inner region. Still, a cut in pix arcsec from the mid-plane corresponds to 2.5-3.0 times the seeing FWHM, so that the light spread from the galaxy midplane is strongly reduced. In physical terms, this cut corresponds to kpc, which is well within the region dominated by the thick disc in our Galaxy. It is therefore quite noticeable that, even considering this cut-off in , the profiles have a similar shape to those observed in ESO243G49, at about half the distance. The profiles cannot be adequately described by a single straight line, even beyond the inner cut-off radius. Instead, they still show two distinct vertical ranges where such lines can be fit. Therefore, although being cautious about the resulting thin disc scaleheight, we still fitted a double exponential to the observed profiles and show the results in the figure.
-
Notes: Column 1: Range perpendicular (zmin:zmax) and parallel (Rmin:Rmax) to major axis where the profile was extracted, in pixels. Pixel scale is 0.154arcsec/pixel; column 2: central pixel position, in pixels; column 3: fit range in pixels used; column 4: panel in Figure 7 where the profile is shown; column 5: artificial shift in surface brightness applied to profile in its panel, mag arcsec2. The larger , the lower the profile position in its panel; column 6: fitted scalength, , in pixels; column 7: scalelength in units of , where and is the Hubble constant in units of km s-1 Mpc-1.
The profiles were fit out to mag arcsec-2. Within the adopted fitting range, the joint contribution of thin and thick disc provide a very efficient description of the observed profiles. The fitted parameters are not as stable as in the case of ESO243G49. This is naturally reflected in the dispersion around the average scaleheights. For the thin disc we obtain kpc, with no values exceeding from the mean in either direction. The thick disc fit results also show substantial spread around the average. If all points are considered we derive kpc. Applying a formal clipping results in kpc.
3.3 LCSBS0496P
In contrast to the other galaxies studied in this paper, LCSBS0496P is not close to the centre of its cluster. Its projected distance from the centre of Abell 0419 is about 13 arcmin ( Mpc). It is therefore found in relative isolation and has perhaps not had time to fall into the more crowded regions of Abell 0419. On the other hand, we note that its measured redshift is exactly the same as that attributed to Abell 0419.

This galaxy is at a comparable distance to ESO187G19. It is also a late type, rather bulgeless, spiral at an inclination close to . This conclusion again comes from the assumption that the aborption lane is generated at the edge of an optically thick thin disc. As a result of its very late type, profiles could be extracted at pix from its centre.
The profiles of LCSBS0496P are shown in Figure 7, reaching down at least to mag arcsec-2. Notice that only the left part of the image shown in Figure 1 () was used in the fits. The reason is that the regions on the right were contaminated by some residual scattered light that often affected the borders of the SOI images at its early-science stage. From the remaining profiles, we obtain kpc with no outliers.
The profiles exhibit a behaviour similar to that of the early-type ESO243G49. Most of the profiles shown in the figure present an abrupt downturn at an outer radius of pix kpc, preventing a single exponential model from being applied to the entire profile range. On the other hand, there is no clear trend toward increasing the scalelength towards the region where the thick disc dominates.
The vertical profiles shown in Figure 8 are also affected by dust and seeing at the very centre, as in the case of ESO187G19. The profiles are much noisier and less symmetric than in the previous two galaxies. LCSBS0496P also seems to display a steeper profile perpendicular to the disc plane, reaching the sky level at smaller . This significantly shortens the available range for fitting the two disc components, which clearly reflects onto the resulting parameters. Most especially, the thick disc scaleheight () varies considerably from one profile to another. Because of the greater difficulty in fitting two disc components to such shorter and noisier data, we relaxed the parameter convergence criteria to , rather than , in our iterative fitting algorithm. We also had to push the fitting ranges closer to the disc plane in some cases.
For the thin disc, an average results from the fits. Applying a clipping eliminates one outlier and reduces the scatter but does not alter the scaleheight: . This is smaller than in the case of ESO187G19. In contrast to ESO187G19, there is very little variation in the thin disc fit results among the different profiles. As LCSBS0496P is also at a large distance, we are confident that we are seeing real physical variations in scaleheights from one galaxy to another, even though the scaleheights may be systematically affected by seeing. On the other hand, the thick disc has been much less constrained by our fits, which result in a broad distribution of scaleheights, with a mean of kpc. This large uncertainty accommodates the 6 individual estimates.
-
Notes: Column 1: Range perpendicular (zmin:zmax) and parallel (Rmin:Rmax) to major axis where the profile was extracted, in pixels. Pixel scale is 0.154arcsec/pixel; column 2: central pixel position, in pixels; column 3: fit range, in pixels, used for the thin and thick components; column 4: panel in Figure 8 where the profile is shown; column 5: artificial shift in surface brightness applied to profile in its panel, mag arcsec2. The larger , the lower the profile position in its panel; column 6: fitted scaleheights, and , in pixels; column 7: scaleheights in units of , where and is the Hubble constant in units of km s-1 Mpc-1.
3.4 NGC 705
NGC 705 is an early type galaxy in Abell 0262, situated just 1.1 arcmin (projected distance: Mpc) away from the CD galaxy NGC 708. Its redshift is the same as was assigned to the cluster, . Despite being an early-type galaxy, it has a noticeable absorption lane on the major axis. Its disc also displays an S-shaped twist, which is visible in Figure 1. NGC 705 is close enough to NGC 708 that its surface photometry is contaminated by the cD’s light on the eastern side. The contaminated region corresponds to panel c and, to a lesser degree, panel d in Figures 9 and 10, where the horizontal and vertical profiles are shown. Notice that both the and profiles in panel c level off at intensity levels brighter than in the other panels. Not surprinsingly, the regions more affected by NGC 708 are those where the profile fits yield the flatter light distributions, specially for the thick disc (see Tables 9 and 10).

Another limitation to the current analysis was that several of the profiles in panel b had to be shortenned due to contamination by the smaller early type galaxy RSCG 15. As the available range for fitting the thick disc was too narrow, no fit was carried out in these cases. They are indicated as a “not fit” in column 3 of Table 10.
The remaining and uncontaminated profiles are very well fit to a single projected exponential, with no clear truncation or downturn. The inner radii used are again large in order to avoid the bright central bulge. The average scalelength for NGC 705 is kpc when all 10 available profiles are used. However, two of the profiles lie beyond from this mean value. They are located on the eastern side of NGC 705’s disc, which as just mentioned, is only contaminated by the outer regions of the cD galaxy NGC 708. Applying a clipping here again substantially reduces the associated uncertainty, with only a mild change in the parameter itself: .
As in the case of ESO243G49, the fitted is larger away from the disc plane than close to it. If we again interpret this trend as the effect of a longer thick disc, we obtain , but with a large scatter.
-
Notes: Column 1: Range perpendicular (zmin:zmax) and parallel (Rmin:Rmax) to major axis where the profile was extracted, in pixels. Pixel scale is 0.10arcsec/pixel; column 2: central pixel position, in pixels; column 3: fit range in pixels used; column 4: panel in Figure 9 where the profile is shown; column 5: artificial shift in surface brightness applied to profile in its panel, mag arcsec2. The larger , the lower the profile position in its panel; column 6: fitted scalength, , in pixels; column 7: scalelength in units of , where and is the Hubble constant in units of km s-1 Mpc-1.
As for the profiles, the need for a double exponential is again visible, as most of the profiles are not straight lines in Figure 10. However, a few profiles extracted at higher are consistent with a single exponential. In fact, attempts to fit a double exponential failed for them. Their single scaleheights are listed within parenthesis in Table 10. They are usually intermediate between the thin and thick disc scaleheights obtained from the other profiles, attesting to the increasing difficulty of differentiating the two components at faint levels.
The average thin disc scaleheight is kpc, where the uncertainty comfortably accomodates all individual profile fits. Notice that this is a relatively nearby galaxy (as compared to ESO187G19 and LCSBS0946P), which is imaged with HST; the effects of seeing are therefore minimized. Thus, its smaller thin disc scaleheight may indicate that the values from the SOAR/SOI images are only upper limits. The value of for NGC 705 is comparable to that of the Galaxy or other nearby spirals.
The thick disc of NGC 705 also has a lower derived scaleheight than those from the SOAR/SOI galaxies. Eliminating the two clear outliers in Table 10 leads to kpc. As it is impossible that seeing would have a strong effect on an extended thick disc structure, we conclude that NGC 705 in fact has a generally smaller disc structure when compared to the other galaxies.

-
Notes: Column 1: Range perpendicular (zmin:zmax) and parallel (Rmin:Rmax) to major axis where the profile was extracted, in pixels. Pixel scale is 0.10arcsec/pixel; column 2: central pixel position, in pixels; column 3: fit range, in pixels, used for the thin and thick components; column 4: panel in Figure 10 where the profile is shown; column 5: artificial shift in surface brightness applied to profile in its panel, mag arcsec2. The larger , the lower the profile position in its panel; column 6: fitted scaleheights, and , in pixels; column 7: scaleheights in units of , where and is the Hubble constant in units of km s-1 Mpc-1.
3.5 Surface brightnesses
So far our analysis has been limited to measuring the horizontal and vertical scales of both thin and thick disc components in the 4 galaxies. In this section we turn our attention to the expected surface brightness of the two components along the major axis and at their centre. We attempt to reconstruct the major axis profiles by extrapolating the fitted profiles all the way to the disc plane. In doing so, as long as the extrapolations are valid and the fits avoid the areas under dust extinction, we should be able to recover the mid-plane surface brightness of both thin and thick discs at the different values where the profiles were extracted.

In Figure 11 we show the results of applying this exercise to the 4 galaxies. The squares in the panels represent the thin and thick disc values as a function of . They were obtained by fitting a double exponential to the mean profile among the different quadrants at a fixed and extrapolating the fit result to . The triangles show the average of the 2 observed profiles along the major axis, one on each side of the centre of the galaxy. For LCSBS0496P and NGC705, only one major axis profile was used, since the other one was contaminated by scattered light and by the cluster cD galaxy, respectively.
For ESO243G49, we obtained for all 5 positions studied. We then fitted Eq. (1) to these values (shown as dotted and dashed lines, respectively, for the thin and thick components). Extrapolating all the way towards the centre, we infer mag arcsec-2 for the thin disc and mag arcsec-2 for the thick disc. Thus, at the centre, the thick disc roughly corresponds to of the light contribution from the thin disc. Due to the difference in scalelengths, at the down-bending radius ( pix), this fraction increases to about . We also estimate the dust extinction coefficient at the disc plane of ESO243G49 as mag, based on the comparison between the predicted and observed major axis profiles.
For the other galaxies, substantially less information is available for different reasons. We only have 3 points along the ESO187G19 major axis. For all of them we managed to recover a value from the average profiles. The amount of extinction on the disc plane is much greater, as expected, than in ESO243G49: mag. Both thin and thick discs follow the observed flat projected profile along the major axis. The thick/thin disc brightness ratio at is in the 3 positions along the major axis.
LCSBS0496P has a very faint thick disc, some 4 magnitudes fainter than the thin disc. This corresponds to a relative normalization along the major axis of , which is comparable to or smaller than the Galactic thick disc normalization in the solar neighbourhood. A visual extrapolation towards leads to a central surface brightnesses of mag arcsec-2 and mag arcsec-2. The inferred amount of extinction is mag, but with large scatter.
Finally, for NGC 705, we used the profiles in panel a of Figure 10 to find . The other ones were contaminated by light from neighbouring galaxies. Only two successful fits to both the thin and thick discs are available for the quadrant we used. They show a thick disc about mag fainter than the thin disc, contributing therefore with about of the z=0 light at an intermediate range along the major axis. We also plot the results of extrapolating the profile fits using a single disc component, whose results are shown in parenthesis in Table 10. They are shown as open circles and follow the observed major axis profile more closely. We thus conclude that dust is very concentrated towards the centre of NGC 705, yielding an absorption of mag within pix kpc.
4 Discussion and conclusions
We carried out deep surface photometry of 4 edge-on spiral galaxies located in Abell clusters. Three of them were imaged with the SOAR/SOI detector and one was taken from the HST/WFPC2 archive. The surface brightness levels reached are mag arcsec-2.
The profiles parallel to the major axis of two galaxies, ESO243G49 and LCSBS0496P, do not follow a single projected exponential function. They display a downturn at outer radii. This has been previously described by several authors; see, e.g., the review by Pohlen et al. (2004b). According to their profile shapes, these two galaxies fit into the Type II profile class in the scheme originally proposed by Freeman (1970) and later extended by Erwin, Beckman & Pohlen (2005) and Pohlen & Trujillo (2006). The 2 other galaxies, ESO187G19 and NGC 705 exhibit horizontal profiles that are well fit by a single exponential over the entire range studied (Type I profiles according to the same scheme).
Profile fits to single exponential models in directions parallel to the major axis have resulted in scalelengths () for each galaxy. In the case of the Type II profiles mentioned earlier, the fits were restricted to the region inside the truncation radius. The two early-type galaxies, ESO243G49 and NGC705, have lower values close to the disc plane than at larger distances from it. If we interpret this trend as a difference in the horizontal structure of thin and thick discs, we derive a ratio , although with a significant scatter from one fit to another. This is smaller than but still consistent with the mean thick/thin disc scalelength ratio of 1.9 quoted by Pohlen et al. (2004) for their sample of S0 galaxies. We find no significant trend in for our two late-types, ESO187G19 and LCSBS0496P. Results from the literature also suggest a similar dependence of on morphological type. For the Milky-Way and NGC 4565, this ratio is around 1.1-1.4 (Shaw & Gilmore 1989; Ojha 2001; Wu et al. 2002; Larsen & Humphreys 2003), whereas for the late type ESO 342G17, Neeser et al. (2002) have found a ratio close to unity.
As for the physical values of we obtained, they are of course dependent on the adopted distance scale. We here express them in units of , which is the Hubble constant in units of km s-1 Mpc-1. The values vary considerably across the sample ( kpc, where is the mean over all profiles). These values of are typical. Pohlen et al. (2004) list kpc and kpc for their sample of 6 lenticular galaxies . For the Galaxy, these values are kpc and kpc as quoted by Ojha (2001) and Larsen & Humphreys (2003).
We also analysed the light distribution perpendicular to the disc planes. As a rule, in all galaxies the extracted vertical profiles are inconsistent with a single exponential, requiring a two-component fit. Our derived thick-disc / thin-disc scaleheight ratios are for 3 of the galaxies and twice this value for LCSBS0496P. This is quite similar to values quoted in the literature (see compilation in Pohlen et al 2007). In terms of physical units, our results also fit well into the range quoted by previous studies: kpc for the thick disc, and kpc for the thin disc. Given the large distance of ESO187G19 and LCSBS0496P (), however, the scaleheights we obtain for the thin disc must be considered with caution, since they are comparable to the photometric seeing. To better analyse these and other galaxies in high-density regions, we are currently developing a modelling algorithm that will deconvolve the observed images with the point spread function and recover the 3D figure of edge-on spiral galaxies.
By extrapolating the fitted vertical profiles, we derived estimates of the surface brighness values for both disc components at different positions along the major axis of each galaxy. From the rough profiles, we could estimate the thick/thin disc normalization at different values. The fractional contribution of the thick component relative to the thin disc varies from at the mid-plane of LCSBS0496B to at intermediate major axis positions in NGC 705. For ESO243G49 and ESO187G19, the thick disc typically contributes with of the light. Estimates of the amount of dust extinction along the major axis were also obtained by comparing the expected surface brightness at the mid-plane to the observed ones.
In brief, we conclude that the structural parameters for both planar components in our cluster galaxy sample are similar to those typically found in the general field. We stress that 3 of our sample galaxies are very close to their host cluster centre, and should therefore have suffered dynamical effects, such as interactions, accretions, or harassment. Taken at face value, although with a small sample, our results imply that these dynamical effects typical of high density regions may have a limited influence on the sizes of the thin and thick discs.
Acknowledgements.
This work was supported by Conselho Nacional de Desenvolvimento Científico e Tecnológico (CNPq) in Brazil through a research grant to BXS and a doctoral fellowship to TBV. The authors thank the staff at SOAR for collecting the data.References
- (1) Abadi, M., Navarro, J., Steinmetz, M., & Eke, V., 2003, ApJ, 597, 21
- (2) Abe, F., Bond, I., Carter, B., et al, 1999, AJ, 118, 261.
- (3) Brook, C., Kawata, D., Gibson, B., & Freeman, K., 2004, ApJ, 612, 894
- (4) Dalcanton, J., & Bernstein, R., 2000, AJ, 120, 203.
- (5) Dalcanton, J., & Bernstein, R., 2002, AJ, 124, 1328.
- (6) de Grijs, R., 1998, MNRAS, 299, 595.
- (7) Du C., Zhou, X., Ma, J., et al, 2003, A&A, 407, 541.
- (8) Erwin, P., Beckman, J., & Pohlen, M., 2005, ApJ Letter, 626, L81
- (9) Fry, A., Morrison, H., Harding, P., & Boroson, T., 1999, AJ, 118, 1209
- (10) Kerber, L., Javiel, S., & Santiago, B., 2001, A&A, 365, 424
- (11) Larsen, J., & Humphreys, R., 2003, AJ, 125, 1958.
- (12) Morrison, H., Boroson, T., & Harding, P., 1994, AJ, 108, 1191
- (13) Morrison, H., Miller, E., Harding, P., Stinebring, D., & Boroson, T., 1997, AJ, 113, 2061
- (14) Mould, J., 2005, AJ, 129, 698.
- (15) Neeser, M., Sackett, P., De Marchi, G., & Paresce, F., 2002, A&A, 383, 472
- (16) Norris, J., 1999, Ap&SS, 265, 213.
- (17) Ojha, D., 2001, MNRAS, 322, 426.
- (18) Pohlen, M., Balcells, M., Lütticke, R., & Dettmar, R.-J., 2004, A&A, 422, 465.
-
(19)
Pohlen, M., Beckman, J.E., H
”uttemeister, S., Knapen, J., Erwin, P., & Dettmar, R.-J., 2004, in Penetrating Bars through Masks of Cosmic Dust: The Hubble Tuning Fork Strikes a New Note, ed.
D. L. Block, I. Puerari, K. C. Freeman, R. Groess, & E. K. Block (Dordrecht: Springer), p. 731. - (20) Pohlen, M, & Trujillo, I., 2006, A&A, 454, 759.
- (21) Pohlen, M., Zaroubi, S., Peletier, R., & Dettmar, R.-J., 2007, MNRAS, 378, 594.
- (22) Seth A., Dalcanton, J., & de Jong, R., 2005, AJ, 129, 1331
- (23) Seth A., Dalcanton, J., & de Jong, R., 2005, AJ, 130, 1574
- (24) Shaw, M., & Gilmore, G., 1989, MNRAS, 237, 903.
- (25) Tikhonov N., Galazutdinova O., Drozdovsky I., 2005, A&A, 431, 127.
- (26) van der Kruit, P., & Searle, L., 1981, A&A, 95, 105.
- (27) van Dokkum, P., Peletier, R., de Grijs, R., & Balcells, M., 1994, A&A, 286, 415
- (28) Wu, H., Burstein, D., Deng, Z., et al, 2002, AJ, 123, 1364
- (29) Wyse, R., 1999, BaltA, 8, 593