Model Spectra of Hot Subdwarfs for the Gaia Mission
Abstract
The Gaia mission will provide an unprecedented 3D view of our galaxy, it will obtain astrometric, photometric and spectrographic data for roughly one billion stars. We are particularly interested in the treasure chest of new data Gaia will produce for hot subdwarf B (sdB) stars. In order for Gaia to classify sdBs and estimate parameters model spectra covering a wide parameter range are needed. Here we describe the construction of an extensive grid, which will be used for this purpose.
Centre for Astrophysics Research, University of Hertfordshire, College Lane, Hatfield, AL10 9AB, UK
Dr. Remeis-Sternwarte, Universität Erlangen-Nürnberg, Sternwartstr. 7, 96049 Bamberg, Germany
1. Introduction
Subdwarf B stars have been identified with core helium burning stars on the extreme horizontal branch (Heber 1986). The remaining hydrogen envelope is very thin () and they will eventually evolve more or less directly to the white dwarf stage without an excursion to the asymptotic giant branch. However, the origin of sdB stars is still under discussion. Proposed formation scenarios include a late core helium flash in single star evolution (D’Cruz et al. 1996) or close binary evolution (see Han et al. 2002, for a summary of possible scenarios). Radial velocity surveys of sdBs have shown that a large fraction resides in close binary systems (Maxted et al. 2001; Napiwotzki et al. 2004). However, some tentative evidence indicates that the binary fraction of sdBs may vary with membership in the different galactic populations (Napiwotzki et al. 2004; Moni Bidin et al. 2006). Thus the relative contributions of the evolutionary channels could be a sensitive function of age and metallicity. The number of stars going through the sdB phase could vary by a large factor for the different populations with important implications for, e.g., our understanding of the UV excess in elliptical galaxies (cf. the contributions of Podsiadlowski et al. and Yi et al. in these proceedings).
The astrometric satellite mission Gaia will revolutionise many fields of stellar astrophysics, including the study of hot subdwarf stars. Gaia will measure positions, parallaxes and proper motions of many hot subdwarfs of spectral type sdB. This will allow us to get a much clearer picture of space densities (and thus formation rates) and a much improved understanding of membership in the galactic populations.
Unambiguous classification and parameter estimates of hot subdwarfs will be facilitated by spectra taken with a low resolution spectrograph on board Gaia. Radial velocities of bright sdBs will be measured with a high resolution instrument. Gaia will need a database of spectra to perform these tasks. Here we describe the construction of a grid of model spectra covering a large parameter space in temperature, gravity and chemical abundances, which will be used for the analysis of the Gaia spectra. We discuss the potential of the Gaia spectra for parameter determinations and their limitations.
2. The Gaia Mission
Gaia111http://www.rssd.esa.int/index.php?project=GAIA is currently scheduled to be launched in December 2011 from Kourou (French Guyana). Its final orbit will be around the Lagrangian point L2 of the Sun–Earth system. The planned duration of the mission is five years, during which time each object in the sky will be observed about 70 times. The prime objective of Gaia will be high precision astrometric measurements providing the parameters position, proper motion and parallax. The achievable precision depends on the brightness with expected parallax precision ranging from about arcsec for to arcsec for .
The Photometric Instrument uses two low-resolution fused–silicia prisms dispersing light in the along scan direction. It will provide continuous low resolution spectra from 3200 Å to 10000 Å. These will be used for classification purposes. Although the resolution is too low to allow analysis of individual metal lines, these spectra will be used for estimates of the fundamental stellar parameters temperature, gravity and metallicity.
The Radial Velocity Spectrometer (RVS) will provide radial velocity and high resolution spectral data in the narrow band Å (resolution ). This range is far from optimal for hot stars, but will nevertheless allow useful measurements for brighter sdBs (see Fig. 2 and Sect. 3).
3. Model Atmosphere Calculations and Simulations
Fully metal-line blanketed LTE model atmospheres have been calculated using an updated version of the code described in Heber et al. (1984; see also O’Toole & Heber 2006). We are creating a four dimensional grid, varying the parameters: effective temperature: K, gravity dex and metallicity: scaled solar, He abundance: 1/1000–1 solar. Abundances in the atmospheres of sdB stars are strongly modified by diffusion processes, with abundance patterns often very different from a simple scaled solar mix (Edelmann et al. 2001; O’Toole & Heber 2006). A satisfactory theoretical reproduction of the observations has not been achieved so far and the low resolution of the Photometric Instrument will prevent any identification of individual metal lines. The scaled solar model spectra are useful to get an indication of the overall metallicity.
Model spectra are calculated with the Bamberg version of the spectrum synthesis programme LINFOR222www.sternwarte.uni-erlangen.de/ai26/linfit/linfor.html (Lemke 1997) developed originally by Holweger, Steffen and Steenbock at the University of Kiel. Detailed line broadening tables are used for the hydrogen Balmer and Paschen lines and HeI and HeII lines. Metal lines were selected from the Kurucz line list.
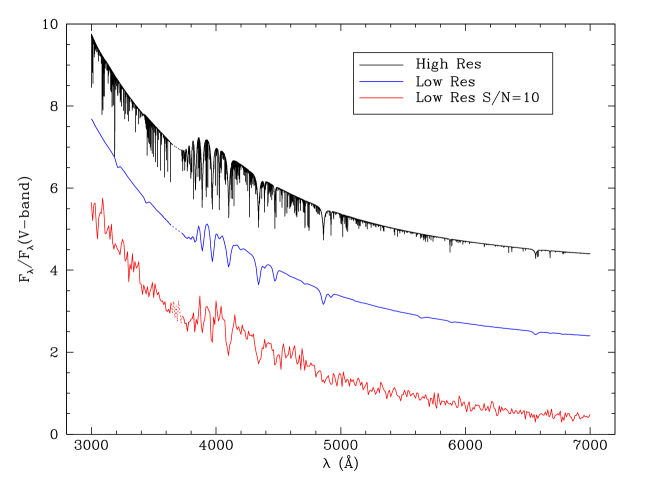
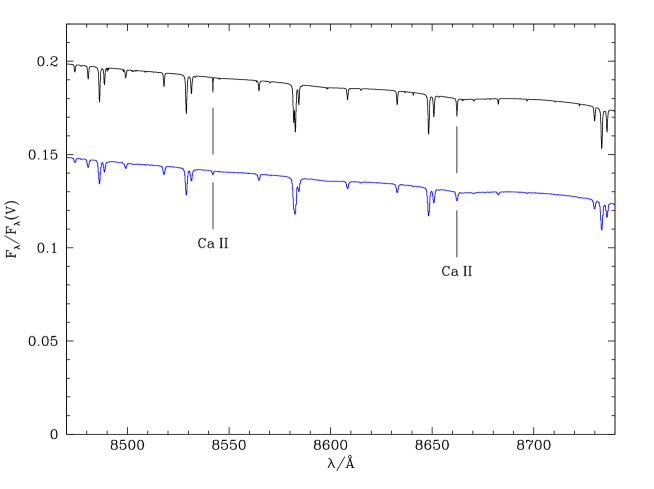
The model spectra were calculated on a fine wavelength grid (0.05 Å). The resolution of the Photometric Instrument spectra will be much lower. To estimate the achievable accuracy of parameter estimates, we performed a set of simulations. One example for typical sdB parameters is shown in Fig. 1. These simulations demonstrate the effect of downgrading the spectra to low resolution and photon noise. Higher resolution spectra will be taken with the Radial Velocity Spectrograph in the near infrared interval Å. This interval was chosen, because it includes a strong CaII triplet, which is well suited for radial velocity measurements in cool stars. However, no strong lines are to be expected in the spectra of sdBs (Fig. 2). Our model calculations show a number of weaker lines. Most moderately strong lines are He i lines. Since the photospheric He abundance of most sdBs is below the solar value, it has to be expected that these lines are weaker in typical sdB spectra. The strongest metal lines in this spectral range are the two Cai̇i lines indicated in the plot. Fig. 2 shows that degradation to the resolution of the RVS will not cause a serious loss of radial velocity accuracy for sdBs. However, a reasonable signal-to-noise ratio will be required, limiting the usefulness of the RVS to brighter sdBs.
Acknowledgments.
This project was supported by Nuffield Science Bursary URB/34488. We gratefully acknowledge financial support of L.H. by the conference organisers.
References
- D’Cruz et al. (1996) D’Cruz, N. L., Dorman, B., Rood, R. T., & O’Connell, R. W. 1996, ApJ, 466, 359
- Edelmann et al. (2001) Edelmann, H., Heber, U., & Napiwotzki, R. 2001, Astronomische Nachrichten, 322, 401
- Han et al. (2002) Han, Z., Podsiadlowski, P., Maxted, P. F. L., Marsh, T. R., & Ivanova, N. 2002, MNRAS, 336, 449
- Heber (1986) Heber, U. 1986, A&A, 155, 33
- Heber et al. (1984) Heber, U., Hunger, K., Jonas, G., & Kudritzki, R. P. 1984, A&A, 130, 119
- Lemke (1997) Lemke, M. 1997, A&AS, 122, 285
- Maxted et al. (2001) Maxted, P. F. L., Heber, U., Marsh, T. R., & North, R. C. 2001, MNRAS, 326, 1391
- Moni Bidin et al. (2006) Moni Bidin, C., Moehler, S., Piotto, G., Recio-Blanco, A., Momany, Y., & Méndez, R. A. 2006, A&A, 451, 499
- Napiwotzki et al. (2004) Napiwotzki, R., Karl, C. A., Lisker, T., Heber, U., Christlieb, N., Reimers, D., Nelemans, G., & Homeier, D. 2004, Ap&SS, 291, 321
- O’Toole & Heber (2006) O’Toole, S. J. & Heber, U. 2006, A&A, 452, 579