An Accreting Black Hole in the Nuclear Star Cluster of the Bulgeless Galaxy NGC 1042
Abstract
We present spectroscopic evidence for a low-luminosity, low excitation active galactic nucleus (AGN) in NGC 1042, powered by an intermediate-mass black hole. These findings are significant in that the AGN is coincident with a compact star cluster known to reside in the nucleus, thus providing an example where the two types of central mass concentration coexist. The existence of a central black hole is additionally remarkable in that NGC 1042 lacks a stellar bulge. Objects such as NGC 1042 may have an important role in testing theories for the genesis of massive black holes in galaxy nuclei, and the extent to which they are in symbiosis with the larger stellar host.
1 Introduction
The origins of supermassive black holes in galaxy nuclei are not well understood. While core-collapse supernovae provide a natural means of producing stellar-mass black holes, dissipation on a much larger scale is required to build up black holes with masses of M⊙ as inferred in luminous quasars and in the centers of massive quiescent galaxies. The gas accretion that powers active galactic nuclei is a means of growing black hole mass, but the onset of QSO activity at redshifts and the correspondingly short timescale for black hole growth may implicate another growth mechanism that is rapid and radiatively inefficient. These considerations have prompted interest in mechanisms for producing “seed” black holes of intermediate mass ( M⊙) that later emerge as the drivers of luminous AGNs (see Shapiro 2004 and van der Marel 2004 for reviews).
Dense star clusters provide one possible vehicle for generating intermediate mass black holes (e.g., Rasio et al., 2004, and references therein). Interest in star clusters as possible precursers for massive black holes has grown as a result of surveys demonstrating that clusters are commonly found in the centers of disk galaxies (Phillips et al., 1996; Carollo et al., 1998; Böker et al., 2002; Seth et al., 2006) and also ellipticals (Grant et al., 2005; Côté et al., 2006). A physical connection between nuclear star clusters and supermassive black holes is suggested by the fact that the masses of the two types of objects independently scale with the luminosity or mass of the host galaxy or bulge, with a similar factor of proportionality (Wehner et al., 2006; Ferrarese et al., 2006; Rossa et al., 2006).
A nuclear star cluster and intermediate-mass black hole are known to coexist in at least one object, NGC 4395, a late-type (Sd) galaxy which hosts a central cluster coincident with a low-luminosity Seyfert 1 nucleus powered by accretion onto a black hole with mass of M⊙ (Filippenko & Ho, 2003; Peterson et al., 2005). Formation of such a collapsed object is clearly not inevitable in such environments; M33, a galaxy of similar morphology, hosts a nuclear star cluster, but no evidence of a significant black hole ( M⊙, Gebhardt et al. 2001; M⊙, Merritt et al. 2001). Additional investigation is needed if we are to understand whether a real connection exists between nuclear star clusters and the formation of intermediate-mass black holes. Late-type galaxies such as NGC 4395 and M33 hold additional special interest as bulgeless systems that nonetheless harbor central mass concentrations, and in the case of NGC 4395, a black hole. Evidence for the coexistence of nuclear clusters with black holes as traced by AGNs in galaxies in general has recently been summarized by Seth et al. (2008).
In this paper we report on observations that bear on this matter for the nuclear star cluster in another bulgeless galaxy, NGC 1042 (morphological type SAB(rs)cd, de Vaucouleurs et al. 1991). The presence of a central cluster in this galaxy was first revealed in the Hubble Space Telescope imaging survey described by Böker et al. (2002); an -band image along with a surface brightness profile of the inner galaxy is given in that reference. Spectroscopic measurements of the cluster stellar population and mass have been presented by Walcher et al. (2005, 2006). Here we focus on emission-line properties of the galaxy nucleus, and evidence they provide for accretion power indicative of a central black hole.
2 Observations
For our analysis we make use of several observations of the NGC 1042 nucleus. The spectrum of this source was obtained with the TWIN spectrograph at the Calar Alto 3.5m telescope on 2005 August 04. Two grating settings were used to cover a total bandpass of 3440 – 7570 Å with a 1″ slit, yielding a spectral resolution of . The seeing during the observations was 08 and the slit was oriented at PA=25∘ which was close to the parallactic angle. The spectra were calibrated using standard methods. Conditions at the time were nonphotometric, and we determined the scalefactor necessary to place our spectra on an absolute photometric scale through comparison with a spectrum of NGC 1042 obtained by the Sloan Digital Sky Survey (SDSS; York et al., 2000). For this purpose we used a 3″-wide extraction from the TWIN spectrum, which is similar in dimension to the 3″-diameter SDSS fiber aperture. The two spectra are very similar in continuum and emission-line properties. The continuum and emission-line fluxes are spatially strongly peaked; we consequently did not attempt to correct for the different aperture areas, but note that the resulting flux scale could be uncertain by as much as a factor of 2. (We note that this uncertainty does not affect our subsequent conclusions that are based on line ratios.)
The TWIN spectrum of the NGC 1042 nucleus as measured through a 1″ 1″synthetic aperture is shown in Figure 1. The spectrum shows emission lines superposed on a stellar continuum, with signal-to-noise ratio decreasing at the blue end. The aperture is substantially larger than the central star cluster, which has an effective radius of 02 (Böker et al., 2004), and thus the spectrum in Figure 1 contains significant circumnuclear starlight (81% of the total light in the I bandpass; Walcher et al., 2006) and nebular emission.

We also obtained high resolution spectra for the NGC 1042 nucleus using UVES at the Very Large Telescope, for purposes of resolving absorption features and enabling accurate estimation of the stellar velocity dispersion and population constraints. The UVES observations were obtained with a 1″-wide slit, and span two wavelength intervals, 3570 – 4830 Å and 6120 – 7980 Å, with resolution of . The seeing for these observations was 08, and we used an extraction width of 1″to measure the spectrum of the nucleus. The instrument slit was maintained at the parallactic angle throughout, thereby sweeping through Position Angles . Portions of the resulting spectra are shown as insets in Figure 1. Further details and analysis of the stellar continuum as measured in the UVES data are presented by Walcher et al. (2005, 2006). As discussed by Walcher et al. (2006), the continuum is dominated by an old stellar population.
3 Analysis
Within the optical bandpass, nebular emission may signal the presence of an active galactic nucleus through emission-line strengths, ratios, and/or profiles. With the data described in §2 we are able to investigate each of these aspects of the NGC 1042 nucleus.
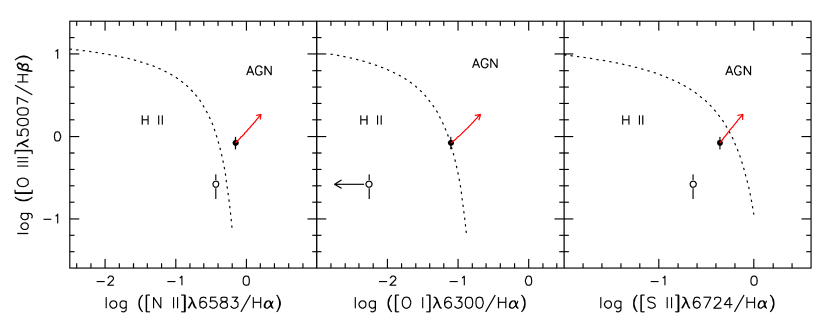
On first inspection, the emission-line ratios for this source are ambiguous in their interpretation. We measured the flux of prominent emission features in the TWIN spectrum; in so doing we did not attempt to subtract the starlight but corrected the Balmer emission-line fluxes using the equivalent widths (EWs) of underlying absorption as determined from the population fit to the high-resolution UVES spectra (Walcher et al., 2006). The resulting line fluxes are listed in Table 1, and line ratios commonly used for nebular classification are plotted in Figure 2. In each case the ratios for the nucleus fall close to the AGN/starburst boundary. Also shown in Table 1 and Figure 2 are measurements obtained through adjacent, off-nucleus apertures, spanning ″on both sides of the nucleus. The off-nucleus spectrum displays emission consistent with high-metallicity H II regions photoionized by hot stars. The nuclear H/H ratio is consistent with the Case B prediction () and hence negligible reddening within the measurement uncertainties.
| Line | ||
|---|---|---|
| Nucleus | Off-Nucleus | |
| [O II] 3726 | … | |
| [O II] 3729 | … | |
| [Ne III] 3869 | … | |
| He I + H8 3889 | … | |
| H 3970 | … | |
| [S II] 4069 | … | |
| H 4102 | … | |
| H 4340 | ||
| H 4861 | ||
| [O III] 4959 | ||
| [O III] 5007 | ||
| [O I] 6300 | ||
| [N II] 6548 | ||
| H 6563 | ||
| [N II] 6583 | ||
| [S II] 6716 | ||
| [S II] 6731 | ||
Note. — erg s-1 cm-2 for the nucleus and erg s-1 cm-2 for the combined off-nucleus apertures. The absolute flux scale is uncertain by up to a factor of 2. H and longer wavelength transitions were measured from the TWIN spectra, while lines shortward of 4800 Å were measured from UVES. The UVES and TWIN measurements were placed on a consistent flux scale by multiplying the UVES values to produce agreement in the H line flux.
If we suppose that the nucleus itself is powered by stars, we can perform a consistency test by comparing the ionizing photon production rate necessitated to explain the Balmer emission with the ionizing photon production rate predicted for the observed stars. Walcher et al. (2006) obtained detailed multi-component stellar population fits to the blue UVES continuum spectra, demonstrating that this source was dominated by old ( Gyr) stars with additional younger components, some with ages yrs. The Bruzual & Charlot (2003) models used by Walcher et al. provide quantitative predictions for the ionizing luminosity emitted by the stars producing the observed blue spectra. For the UVES spectra no absolute flux calibration exists, hence the ionizing photon flux derived from the blue setting and the H flux from the red setting are not directly comparable. However, consistent predictions for the H emission line and the adjacent continuum can be obtained from the fits to the blue spectra, so that the predicted H emission equivalent width (EW) can be directly compared with the observed value. The predicted EW(H) assuming complete absorption of the ionizing photons and Case B recombination is 16.2 Å, which is in excellent agreement with the measured value of Å. (The latter value includes a correction for underlying stellar absorption with EW = Å.) An accretion source is thus not required to explain the nebular recombination flux if the stellar ionizing radiation is absorbed efficiently, and if this radiation truly arises from stars; in composite optical spectra it can, however, be very difficult to distinguish hot stellar components from power-law emission powered by accretion. We thus cannot exclude the possibility that the blue continuum component identified in the stellar populations fitting is in fact a weak AGN continuum that extends beyond 13.6 eV, thereby contributing to the nebular ionization.
The UVES spectra provide detailed information on emission line profiles and the results are surprising. The upper inset in Figure 1 shows the H 6563, [N II] 6548, 6583 lines, which are the strongest transitions in the red UVES spectrum. The [N II] lines have full width at half maximum (FWHM) velocities of km s-1, which is consistent with the stellar velocity dispersion in the same aperture of km s-1 (Walcher et al., 2005) for a Gaussian distribution (FWHM = 2.35). The lines clearly deviate from Gaussian profiles in that they show prominent wings, most visible in [N II] 6583, extending to approximately km s-1 from line center. While these large gas velocities are suggestive of AGN activity, Figure 1 presents a conundrum in that the H line is obviously narrower than the [N II] lines, in contrast with Seyferts and LINERs where the lines have comparable widths, or broader widths for the Balmer lines. This difference can be seen more clearly in Figure 3, which shows an overlay of the two profiles. The H line has FWHM km s-1 which is actually less than would be predicted from the stellar in the Gaussian case. Underlying stellar absorption does not significantly distort the H profile; Figure 3 also shows the result of subtracting the continuum obtained from the stellar population fit described by Walcher et al. (2006), and the emission profile is substantially unaltered.

Insight into the unusual line profiles can be gained by examining the spatial variation of emission properties along the UVES slit. The emission-line flux as a function of position is plotted in Figure 4, which shows measurements obtained from 1″-wide extractions stepped along the slit. The figure shows that the H peak flux is offset by 05 (i.e. pc) from the location of the peak flux in the forbidden lines and in the stellar continuum. This offset is likewise evident in a published SAURON H map (Ganda et al., 2006). Notably, the location of maximum forbidden line flux is also the location of maximum velocity width for all of the lines, including H (Figure 5); at the same site, the [O I]/H, [N II]/H, and [S II]/H ratios achieve maxima. Figure 4 shows that the [S II] 6716/[S II] 6731 flux ratio also exhibits spatial variations, with a minimum value indicative of a maximum plasma density at the site of peak forbidden-line emission. It is additionally noteworthy that emission in [O I], which tends to trace nonstellar ionization processes, is the most highly concentrated, consistent with a compact source centered at the location of peak line and continuum flux. Inspection of the rotation curve measured from the emission lines (Figure 6) indicates that the position of peak continuum and forbidden-line flux is consistent with the kinematic center for this system, although an offset of km s-1 is seen between H and [O I] in the central aperture.


The spatially resolved UVES results can be understood collectively if an accretion source is located at the site of maximum line width, forbidden-line flux, and continuum emission – i.e., coincident with the nuclear star cluster, as well as the kinematic center – and an offset H II region is responsible for the peak H flux. The line profiles seen in the central extraction shown in Figure 1 are thus naturally explained as the blended emission from a weak AGN and an H II region, with the latter component dominating the H line. The composite nature of the nucleus additionally provides an explanation for why line ratios plotted in Figure 2 fall near the AGN/starburst demarcation. We obtained an approximate decomposition of the two contributions by assuming that the [N II] 6583 profile was dominated by the accretion source. We first subtracted the underlying stellar continuum from the H + [N II] wavelength region for the nucleus using the multi-age composite stellar fit described by Walcher et al. (2006). We then scaled the [N II] profile to match the H wings, and subtracted the scaled profile to determine approximately what fraction of H remains that can be attributed to the H II region, i.e., 61%. We can use this fraction to correct the emission ratios shown in Figure 2, and for this purpose use the emission spectrum from the off-nucleus aperture as a template for the H II component. (This estimate assumes that H and H have the same relative proportions of AGN and H II region emission in the central aperture.) The resulting shifts in position for the ratios for the central region are shown in Figure 2; in each case the central source moves more definitively into the locus of AGNs.
While the detailed decomposition described here is only approximate and cannot be considered unique, it is clear that removal of H and other emission associated with the source adjacent to the nucleus (Figure 4) would offset the line ratios to values in stronger accord with a central accretion source. Similar examples of mixed AGN and H II emission revealed through line profile differences are described by, e.g., Véron et al. (1981) and Shields & Filippenko (1990). In NGC 1042 the underlying AGN is a type 2 object (no detected broad H) with emission-line ratios consistent with classification as a LINER.
High energy emission would be expected from the AGN, but will require deep observations in order to be detectable. An archival ROSAT HRI image exists for NGC 1042, with an exposure of 22 ksec in 1995 July. No source is evident at the position of the nucleus, and taking into consideration the Poisson nature of a possible source and local background yields a 90%-confidence upper limit of 7.4 counts for the AGN. Assuming a distance to NGC 1042 of 18.2 Mpc, absorption by the Galactic column density of cm-2 (Dickey & Lockman, 1990), and an intrinsic power-law source with photon index , this limit translates into erg s-1. Extrapolating the same assumed continuum to harder energies would imply erg s-1. It is useful to combine the latter value with the AGN H luminosity, for comparison with other systems. After removing the estimated contamination from the adjacent H II region (see §3) and correcting for Galactic extinction of mag (Schlegel, Finkbeiner, & Davis, 1998), the H luminosity for the NGC 1042 nucleus is erg s-1. The upper limit to the x-ray luminosity is easily consistent with measurements for other weak AGNs with comparable (Ho et al., 2001). The lack of a detection with ROSAT is thus consistent with the low luminosity of the AGN indicated by its optical emission.
4 Discussion
From analysis of the NGC 1042 optical spectra we conclude that this source presents strong evidence for an accreting black hole coincident with a compact nuclear star cluster. We can draw several other inferences from this source which are of interest for comparison with other galaxies.
While we have no means of measuring the black hole mass, we can place a lower limit on its value if the source’s luminosity is less than the Eddington luminosity. We can obtain an order-of-magnitude estimate of the radiative output of the AGN using measurements of the H line. If this low luminosity source has a spectral energy distribution similar to typical LINERs, then we expect the bolometric luminosity to be (Ho, 1999; Ho et al., 2001). The H measurement thus implies erg s-1 for NGC 1042, and hence M⊙ if the AGN accretes at a sub-Eddington rate.
An upper bound on can also be obtained from measurements of the nuclear star cluster based on estimates of the mass-to-light ratio for this source. If is significant in comparison with the stellar mass in the central cluster, based on dynamical estimates of total mass will be increased by a corresponding amount. Walcher et al. (2005) obtained a dynamical estimate of for the nucleus of NGC 1042, and Walcher et al. (2006) reported an independent estimate of using multi-component stellar population fits to the optical spectra. The latter method will not include the contribution from any dark mass, but Walcher et al. find that obtained from the stellar population analysis is formally somewhat larger than the dynamical estimate. We can conclude from this that must be modest in comparison with the cluster stellar mass, M⊙ (Walcher et al., 2005), and can thus adopt this value as an upper limit for the black hole.
We can estimate black hole mass from the stellar using the relation (Gebhardt et al., 2000; Ferrarese & Merritt, 2000), although its applicability in this case is uncertain. The relation is based on measurements of for host galaxy bulges, while in NGC 1042 we only have a measure of for the central star cluster. In this context it is noteworthy that measurements of the globular cluster G1 in M31 are consistent with extrapolation of the relation to the scale of massive globular star clusters (Gebhardt et al., 2005). For NGC 1042 the relation as derived by Tremaine et al. (2002) would predict M⊙. This value is consistent with the bounds obtained above, and would imply a rather low value of the Eddington ratio , in accord with the LINER classification for the observed AGN (Ho, 2004).
Based on these arguments, we can state that an intermediate-mass black hole with M M⊙ resides in NGC 1042’s nucleus, coincident with the central star cluster. This discovery provides added incentive to consider star clusters as an essential element in spawning collapsed objects that grow into the central engines of luminous AGNs. NGC 1042 thus may present some of the attributes today of early galaxies that have evolved to host supermassive black holes. Regardless of the detailed evolutionary pathway, the formation of massive compact star clusters and black holes requires substantial dissipation and collapse of matter to the central parsecs of a galaxy. NGC 1042, along with NGC 4395, provide demonstrations that the two types of massive central objects can readily coexist, a point that should be considered when linking these structures in a common framework (e.g., Ferrarese et al., 2006; Wehner et al., 2006).
The relationship between and other galaxy attributes in objects like NGC 1042 remains ill-determined. It is natural to ask whether the central black hole in such galaxies is linked to the nuclear cluster in some manner analogous to the black hole-bulge correlations found in earlier Hubble types. However, the situation remains confused in that the other known examples, NGC 4395 and M33 (§1), fall off the extrapolated relation with values that are too high and too low, respectively, for the as measured in the central region111 for NGC 4395 obtained from reverberation mapping (Peterson et al., 2005) is larger than expected from the relation, but estimates obtained by other means, as described by Filippenko & Ho (2003), result in better agreement.. Several authors have suggested that is linked most fundamentally to galaxy halo mass, rather than bulge mass (e.g., Ferrarese, 2003; Baes et al., 2003), but this idea remains controversial (Ho, 2007). Bulgeless galaxies like NGC 1042 offer an interesting class of objects for probing these ideas (see also Satyapal et al., 2007, 2008). One complication is the finding by Böker et al. (2003) that apparently bulgeless galaxies often have modest central light excesses above a simple extrapolation of an exponential disk. In this regard it is worth noting that NGC 1042 has one of the largest such excesses among the galaxies analyzed by Böker et al. It is tempting to regard this finding as further evidence linking central black holes and bulge-like structures, but a more systematic survey is needed to draw definite conclusions.
5 Conclusions
In this study we have presented evidence from optical spectroscopy that a low-excitation AGN resides in the nucleus of the late-type galaxy NGC 1042. Existing constraints suggest that the accretion activity is powered by an intermediate-mass black hole. This result is noteworthy in that a compact star cluster also resides in the nucleus; consequently this source may implicate an important role for star clusters in generating “seed” black holes in galaxy centers. NGC 1042 is also remarkable in hosting a central black hole while lacking a stellar bulge. Understanding the implications for black hole formation in relation to galaxy evolution will require study of statistical samples of similar galaxies, where simultaneous measurements of bulge, central cluster, and black hole properties are possible.
References
- Baes et al. (2003) Baes, M., Buyle, P., Hau, G. K. T., & Dejonghe, H. 2003, MNRAS, 31, L44
- Böker et al. (2002) Böker, T., Laine, S., van der Marel, R. P., Sarzi, M., Rix, H.-W., Ho, L. C., & Shields, J. C. 2002, AJ, 123, 1389
- Böker et al. (2004) Böker, T., Sarzi, M., McLaughlin, D. E., van der Marel, R. P., Rix, H.-W., Ho, L. C., & Shields, J. C. 2004, AJ, 127, 105
- Böker et al. (2003) Böker, T., Stanek, R., & van der Marel, R. P. 2003, AJ, 125, 1073
- Bruzual & Charlot (2003) Bruzual, G., & Charlot, S. 2003, MNRAS, 344, 1000
- Carollo et al. (1998) Carollo, C. M., Stiavelli, M, & Mack, J. 1998, AJ, 116, 68
- Côté et al. (2006) Côté, P., et al. 2006, ApJS, 165, 57
- de Vaucouleurs et al. (1991) de Vaucouleurs, G., de Vaucouleurs, A., Corwin, H. G., Buta, R. J., Paturel, G., Fouque, P. 1991, Third Reference Catalogue of Bright Galaxies (New York: Springer-Verlag)
- Dickey & Lockman (1990) Dickey, J. M., & Lockman, F. J. 1990, ARA&A, 28, 215
- Ferrarese (2003) Ferrarese, L. 2003, ApJ, 578, 90
- Ferrarese et al. (2006) Ferrarese, L., et al. 2006, ApJ, 644, L21
- Ferrarese & Merritt (2000) Ferrarese, L., & Merritt, D. 2000, ApJ, 539, L9
- Filippenko & Ho (2003) Filippenko, A. V., & Ho, L. C. 2003, ApJ, 588, L13
- Ganda et al. (2006) Ganda, K., Falcón-Barroso, J., Peletier, R. F., Cappellari, M., Emsellem, E., McDermid, R. M., & de Zeeuw, P. T., & Carollo, C. M. 2006, MNRAS, 46, 78
- Gebhardt et al. (2000) Gebhardt, K., et al. 2000, ApJ, 539, L13
- Gebhardt et al. (2001) Gebhardt, K., et al. 2001, AJ, 122, 2469
- Gebhardt et al. (2005) Gebhardt, K., Rich, R. M., & Ho, L. C. 2005, ApJ, 634, 1093
- Grant et al. (2005) Grant, N. I., Kuipers, J. A., & Phillipps, S. 2005, MNRAS, 363, 1019
- Ho (1999) Ho, L. C. 1999, ApJ, 516, 672
- Ho (2004) Ho, L. C. 2004, in Coevolution of Black Holes and Galaxies, ed. L. C. Ho (Cambridge: Cambridge Univ. Press), 293
- Ho et al. (2001) Ho, L. C., et al. 2001, ApJ, 549, L51
- Ho (2007) Ho, L. C. 2007, ApJ, 668, 94
- Kauffmann et al. (2003) Kauffmann, G., et al. 2003, MNRAS, 346, 1055
- Kewley et al. (2001) Kewley, L. J., Dopita, M. A., Sutherland, R. S., Heisler, C. A., & Trevena, J. 2001, ApJ, 556, 121
- Merritt et al. (2001) Merritt, D., Ferrarese, L., & Joseph, C. L. 2001, Science, 293, 1116
- Peterson et al. (2005) Peterson, B. M., et al. 2005, ApJ, 632, 799
- Phillips et al. (1996) Phillips, A. C., Illingworth, G. D., MacKenty, J. W., & Franx, M. 1996, AJ, 111, 1566
- Rasio et al. (2004) Rasio, F. A., Freitag, M., & Gürken, M. A. 2004, in Coevolution of Black Holes and Galaxies, ed. L. C. Ho (Cambridge: Cambridge University Press), 138
- Rossa et al. (2006) Rossa, J. et al., 2006, AJ, 132, 1074
- Satyapal et al. (2007) Satyapal, S., Vega, D., Heckman, T., O’Halloran, B., & Dudik, R. 2007, ApJ, 663, L9
- Satyapal et al. (2008) Satyapal, S., Vega, D., Dudik, R. P., Abel, N. P., & Heckman, T. 2008, ApJ, 677, 926
- Schlegel, Finkbeiner, & Davis (1998) Schlegel, D. J., Finkbeiner, D. P., & Davis, M. 1998, ApJ, 500, 525
- Seth et al. (2006) Seth, A. C., Dalcanton, J. J., Hodge, P. W., Debattista, V. P. 2006, AJ132, 2539
- Seth et al. (2008) Seth, A., Agueros, M., Duane, L., & Basu-Zych, A. 2008, ApJ, in press
- Shapiro et al. (2004) Shapiro, S. L. 2004, in Coevolution of Black Holes and Galaxies, ed. L. C. Ho (Cambridge: Cambridge University Press), 103
- Shields & Filippenko (1990) Shields, J. C., & Filippenko, A. V. 1990, AJ, 100, 1034
- Tremaine et al. (2002) Tremaine, S., et al. 2002, ApJ, 574, 740
- van der Marel (2004) van der Marel, R. P. 2004, in Coevolution of Black Holes and Galaxies, ed. L. C. Ho (Cambridge: Cambridge University Press), 37
- Véron et al. (1981) Véron, P., Véron, M. P., Bergeron, J., & Zuidervijk, E. J. 1981, A&A, 97, 71
- Walcher et al. (2005) Walcher, C. J., et al. 2005, ApJ, 618, 237
- Walcher et al. (2006) Walcher, C. J., Böker, T., Charlot, S., Ho, L. C., Rix, H.-W., Rossai, J., & Shields, J. C., & van der Marel, R. P. 2006, ApJ, 649, 692
- Wehner et al. (2006) Wehner, E. H., & Harris, W. E. ApJ, 644, L17
- York et al. (2000) York, D. G., et al. 2000, AJ, 120, 1579