Quantum-inspired interferometry with chirped laser pulses
Abstract
We introduce and implement an interferometric technique based on chirped femtosecond laser pulses and nonlinear optics. The interference manifests as a high-visibility (%) phase-insensitive dip in the intensity of an optical beam when the two interferometer arms are equal to within the coherence length of the light. This signature is unique in classical interferometry, but is a direct analogue to Hong-Ou-Mandel quantum interference. Our technique exhibits all the metrological advantages of the quantum interferometer, but with signals at least times greater. In particular we demonstrate enhanced resolution, robustness against loss, and automatic dispersion cancellation. Our interferometer offers significant advantages over previous technologies, both quantum and classical, in precision time delay measurements and biomedical imaging.
Interference is a defining feature of both quantum and classical theories of light. It also enables the most precise measurements of a wide range of physical quantities including length Abbott et al. (2005) and time Udem et al. (1999). Quantum metrology exploits fundamental differences between classical and quantum theories for novel measurement techniques and enhanced precision Lee et al. (2002); Giovannetti et al. (2004). Advantages stem from several phenomena associated with quantum interferometers, including nonlocal interference Franson (1989, 1992), phase-insensitive interference Hong et al. (1987), phase super-resolution and super-sensitivity Walther et al. (2004); Mitchell et al. (2004); Resch et al. (2007a), and automatic dispersion cancellation Franson (1992); Steinberg et al. (1992). Unfortunately, quantum interferometers require entangled states that are practically difficult to create, manipulate, and detect, especially compared to the ease of working with robust, intense classical states. In the present work, we show that the set of advantages previously associated with a quantum interferometer are, in fact, more easily achieved classically.
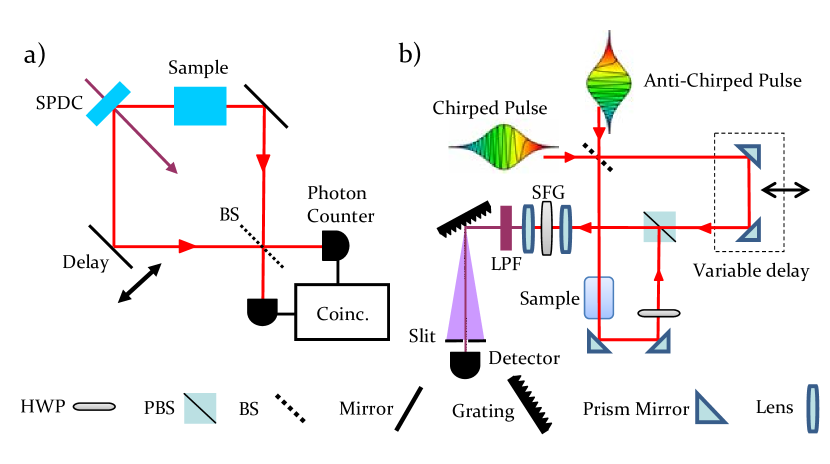
Arguably the best known example of quantum interference was demonstrated by Hong, Ou, and Mandel Hong et al. (1987) (HOM); their interferometer is depicted in fig. 1a. HOM interference induces strong photon-photon interactions and is central to optical quantum technologies, including quantum teleportation Bouwmeester et al. (1997) and linear-optical quantum computing Knill et al. (2001). Several characteristics distinguish HOM from classical interference, such as Michelson’s or Young’s. The HOM signal stems from pairs of interfering photons and manifests as a dip in the rate of coincident photon detections which spans the entire coherence length of the light, as opposed to classical wavelength fringes. It is therefore inherently robust against path length fluctuations. If the photon pairs are entangled, the visibility and width of the HOM interferogram is insensitive to loss Steinberg et al. (1993) and dispersion Steinberg et al. (1992). Furthermore, HOM interferometers achieve higher resolution than classical interferometers using the same bandwidth Abouraddy et al. (2002); Nasr et al. (2003). These features are ideal for precision optical path measurements of dispersive and lossy materials, implemented by placing the sample in one interferometer arm and measuring the delay required to restore the dip. A quantum version of optical coherence tomography Fujimoto et al. (1995) (OCT) was proposed and demonstrated Abouraddy et al. (2002); Nasr et al. (2003) to harness these advantages.
Recently, two proposals Erkmen and Shapiro (2006); Banaszek et al. (2007) and one experimental demonstration Resch et al. (2007b) have described classical systems exhibiting automatic dispersion cancellation. Significant drawbacks to these techniques include reliance on unavailable technology Erkmen and Shapiro (2006) or significant post-processing Banaszek et al. (2007); Resch et al. (2007b). The experimentally demonstrated technique requires wavelength path stability; the interference visibility falls precipitously with loss and is limited to of that possible with the HOM effect. Alternatively, background-free autocorrelation exhibits enhanced resolution, phase insensitivity, and robustness against loss, but notably not automatic dispersion cancellation; this technique has recently been used in OCT Pe’er et al. (2007).
In the present work, we describe and experimentally demonstrate classical interference with all of the metrological advantages of the HOM interferometer. In contrast with other classical interferometers, the Feynman paths giving rise to the interference cannot be identified with the spatial paths constituting the two interferometer arms. Sum-frequency generation (SFG) acts to directly produce the interference signal from a pair of oppositely chirped optical pulses with strong classical frequency correlations; no post-processing or coincidence counting is required. The device can be understood as a time-reversed HOM interferometer using an argument Resch et al. (2007a) based on the corresponding symmetry of quantum mechanics. Remarkably, time reversal converts the quantum interferometer into a device that can use bright classical laser pulses and achieves a demonstrated ten-million-fold higher signal. Our general approach should yield similar improvements in performance when applied to many other entangled-photon based interferometers.
Hong-Ou-Mandel-based metrology can be explained using the following approach Steinberg et al. (1992). The wavevector of light in a material can be expanded about a frequency , , where and are material properties describing the group delay and quadratic group velocity dispersion (GVD), respectively. Ideal frequency-entangled photon pairs are described by the state, , where is the amplitude spectrum. The coincidence rate in the HOM interferometer as a function of the relative delay time, , is given by Steinberg et al. (1992),
| (1) |
Here () are the phases associated with the amplitude where both photons are reflected (transmitted); the delay time , where () is the length of the sample (delay) arm and is the length of the sample; and and , after removing an irrelevant global phase.
Since and have the same dependence on the GVD, , it is automatically cancelled in the interference signal, as are all even orders of dispersion. The coincidence rate drops to zero for , or when the group delay from the material is exactly compensated by unequal physical path lengths; this marks the centre of the HOM dip.
To understand our chirped-pulse interferometry (CPI) technique, consider the cross-correlator shown in fig. 1b as a time-reversed HOM interferometer (Fig. 1a). The detection of a pair of photons with frequencies is replaced by the preparation of a pair of photons with those frequencies; the preparation of a pump photon of frequency , which is subsequently down-converted, is replaced by the detection of a photon of frequency , which had previously been up-converted. The signal in Eq. 1 is built up by repeating the experiment with many pairs of photons with frequencies distributed according to the spectrum, .
The power of CPI stems from the replacement of photon pairs by bright classical beams with frequencies . The SFG from these beams will contain three distinct frequencies, instead of just one: the cross-correlation produces up-converted light at at a rate proportional to (cf. Eq. 1); the autocorrelation produces two new beams at frequencies . A narrow bandpass filter centred at removes the autocorrelation unless is small.
The frequency difference, , is swept using a pair of oppositely-chirped optical pulses with matched frequency ramps. A chirped (anti-chirped) pulse has a frequency that increases (decreases) linearly in time. We require that the chirp and anti-chirp are much greater than any dispersion in the interferometer and stretch the pulses to many times their initial duration. Under these conditions, the input frequencies are swept in an anti-correlated manner such that at any instant only two frequencies, , are input. (Oppositely-chirped pulses have previously been used to efficiently drive rotational and vibrational transitions in molecules Karczmarek et al. (1999); Xia et al. (2003)). This ramp performs the integration in Eq. 1 automatically. As an added benefit, chirped pulses can have high peak intensities yielding correspondingly high frequency-conversion efficiency.
We use a modelocked ti:sapphire laser (centre wavelength 790 nm, pulse duration 110 fs, average power 2.8 W, repetition rate 80 MHz) as the light source for the experiment. The polarization of the output is rotated from vertical to horizontal using a half-wave plate to achieve maximum diffraction efficiency from our gratings. Our laser light is split using a 50/50 beamsplitter. Half of the optical power is sent through a grating-based optical compressor and the other half is sent through a grating-based optical stretcher Treacy (1969); Martìnez (1988); Pessot et al. (1987). The stretcher applies normal dispersion, creating a chirped pulse where the blue lags the red in time, whereas the compressor applies anomalous dispersion, creating the anti-chirped pulse where the red lags the blue. While the terms stretcher and compressor are commonly used, in our experiment both devices stretch our optical pulses. Both stretcher and compressor use , lines/mm gold-coated ruled diffraction gratings, blazed for 800nm.
In the compressor, the gratings are oriented with their faces parallel and separated by a distance of cm. The input beam passes over the top of a prism mirror; the retro-reflecting mirror is angled slightly downward so that the output beam is reflected by the prism mirror. The compressor produces anti-chirped output pulses ps long with nm of bandwidth and the beam has an average power of mW.
In the stretcher, the gratings are oriented with their faces antiparallel and separated by cm. A 1:1 telescope is placed between the gratings and consists of two lenses cm separated by cm with the first lens placed cm after the first grating. The stretcher produces chirped output pulses ps long with nm of bandwidth and the beam has an average power of mW.
Initially, we balanced the stretcher and compressor by sending the output of the stretcher through the compressor and minimizing the pulse duration of the output by changing the grating separation in the compressor. We observed a minimum broadening of % over pulses directly from the laser. The differences between the durations of the chirped and anti-chirped pulses are due to unequal loss of bandwidth in the stretcher and compressor. They do not reflect different chirp rates.
The beams of chirped and anti-chirped pulses are injected into the cross-correlator as shown in fig. 1b. To compensate the shorter optical path in the compressor as compared to the stretcher, the anti-chirped pulse arrives at the beamsplitter via a variable delay path (not shown). The relevant centre frequency for our experiment is not the centre frequency of the pulse, but rather is determined by the temporal overlap of the chirped and anti-chirped pulse at the 50/50 beamsplitter. If the chirped pulse lags (leads) the anti-chirped pulse, the frequency is red-shifted (blue-shifted) from twice the centre frequency of the laser. This can be used to make measurements of group delays over a tunable range of wavelengths, which is difficult to do using HOM interference, since the entangled photons are typically produced using a fixed frequency CW laser Steinberg et al. (1992); Nasr et al. (2003). To illustrate this point, we combined our pulses such that the sum of the frequencies corresponded to a wavelength, nm, well separated from half of the centre wavelength of the laser, nm.
The two outputs from the beamsplitter travel different paths through the cross-correlator. One travels through the delay arm where a retro-reflector is placed on a motorized translation stage with mm travel; the other passes through the sample and an achromatic half-wave plate which rotates the polarization from horizontal to vertical. The two beams are recombined at a broadband polarizing beamsplitter cube (PBS).
The output from the PBS is focused by a cm achromatic lens into a mm -barium-borate (BBO) optical crystal cut for collinear type-II degenerate sum-frequency generation. The sum-frequency beam is then collimated by means of another cm lens. The infrared light is filtered by means of two dichroic mirrors (not shown) designed to reflect nm light at incidence and to transmit nm light, as well as a cyan coloured glass low-pass filter; this is depicted as a low-pass filter (LPF) in fig. 1b.
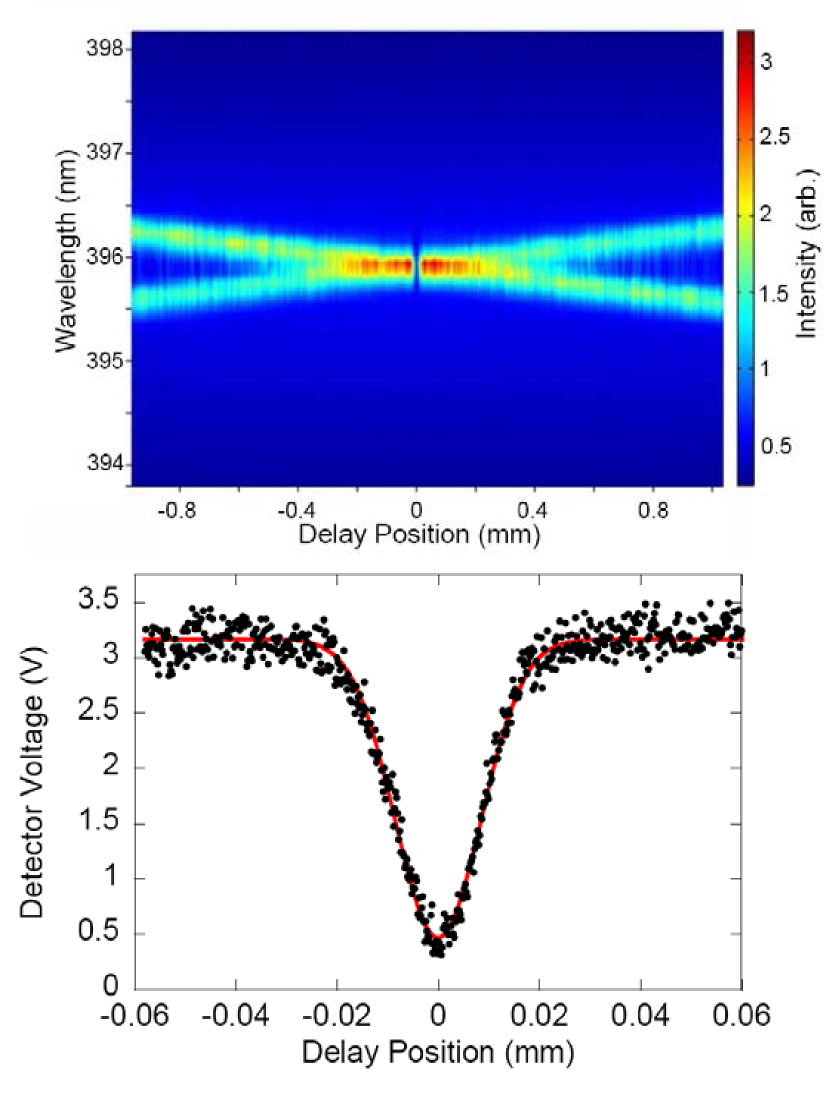
Fig. 2a shows the measured SFG spectrum as a function of the delay. The cross-correlation signal is clearly observed, but the autocorrelation signal comprises a broad background barely visible on this scale. For large delays, the cross-correlation signal contains two easily-discernable wavelengths spaced symmetrically about nm. These peaks arise from SFG due to the chirped component in the sample arm and the anti-chirped component in the delay arm, and vice versa. These different alternatives for producing the cross-correlation signal constitute the distributed Feynman paths which interfere. The two wavelengths approach one another as the path length difference approaches zero, where destructive interference eliminates the cross-correlation signal.
We filter a bandwidth of nm centred at nm using a lines/mm aluminum-coated diffraction grating followed by a slit. The optical power is measured using an amplified silicon photodiode. The photodiode signal as a function of delay is displayed in fig. 2b and clearly shows the interference dip with visibility and FWHM m or fs.
All visibilities were calculated without background subtraction; however, our photodiode registered a bias ranging from mV to mV when in the dark. We measured this bias for every data set and subtracted the negative value from our measured voltage. Note that this bias correction lowers our reported visibilities.
Our measured visibility easily surpasses the limit commonly attributed to any classical analogue of HOM interference. This classical limit applies only to the visibility of the coincidence rate (or correlation) between two square-law photodetector signals showing no individual interference Hong et al. (1987); Paul (1986). Although both SFG and coincidence detection measure correlations, the SFG signal depends on the product of the electric fields, as opposed to intensities; thus our detection scheme avoids this constraint. In practice, the background from the autocorrelation does limit the visibility, but it can be arbitrarily close to with large chirp and narrow filtering. Alternatively, one could achieve visibility by removing the small band of frequencies responsible for the autocorrelation background from the chirped and anti-chirped pulses; this has the drawback of distorting the interferogram.
The optical power corresponding to V on our detector was measured to be W at nm, thus our measured signal of W corresponds to about photons/s. The highest reported coincidence rate Altepeter et al. (2005) from a photon pair source is Hz while the rate is typically orders of magnitude lower in a HOM interferometer. Our signal is a demonstrated 7 orders of magnitude higher than what can be achieved in a HOM interferometer using state-of-the-art photon-pair sources.
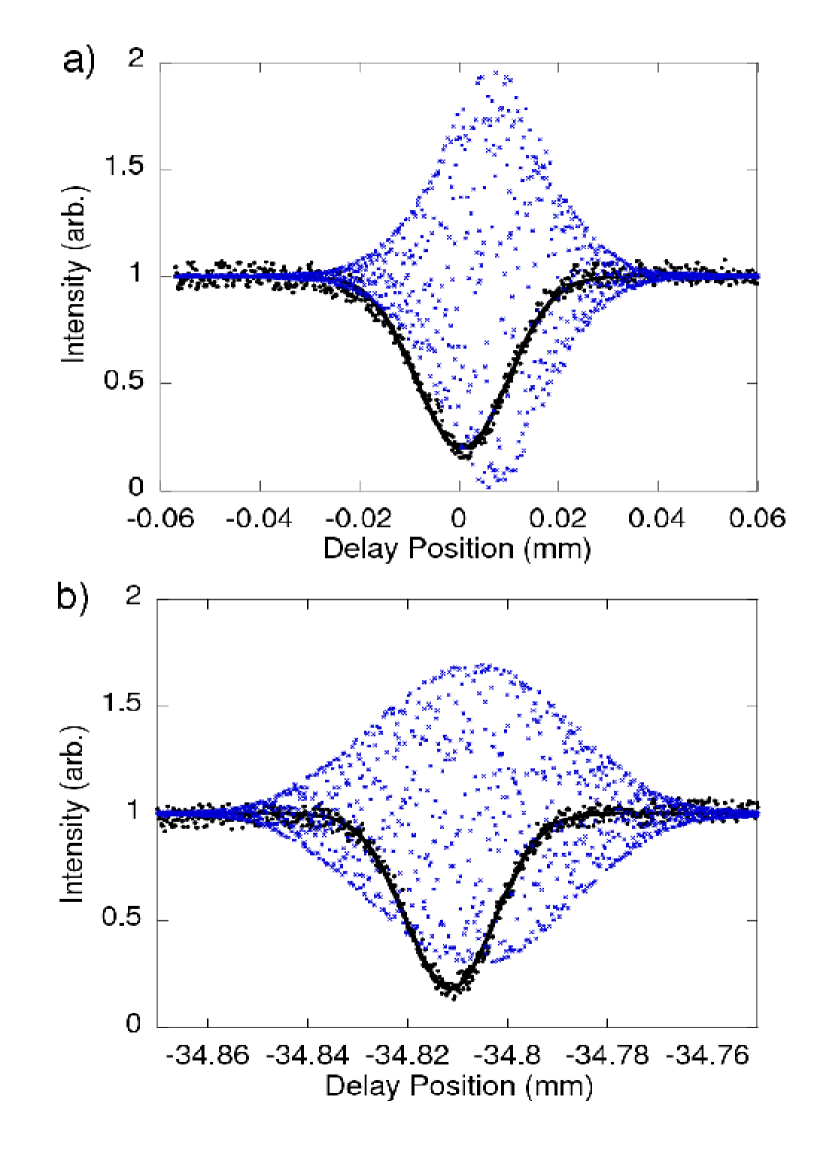
To demonstrate automatic dispersion cancellation, we took two data sets: one with significant dispersive material in the sample arm, mm of calcite and mm of BK7 glass, and one without. (The dispersive properties of calcite and BK7 do not cancel, rather their effects are cumulative). In each configuration we measured chirped-pulse and white-light interferograms. To observe white-light interference, we sent the chirped pulse through the interferometer, placed a polarizer at before the nonlinear crystal, and directly detected the transmitted infrared light. The resulting interferograms are shown in fig. 3a and 3b. The CPI widths and centres were obtained by a Gaussian fit whereas the white-light interference characteristics were obtained via the Hilbert transform method Fercher et al. (2003).
With no sample, fig. 3a, we observe fs FWHM for the chirped-pulse dip and fs FWHM for the white-light interference pattern. By comparing the widths we see that the chirped-pulse signal has better resolution. Theory predicts an increase in resolution of (assuming Gaussian bandwidths); we attribute the difference to the acceptance bandwidth of our SFG crystal, the offset of our chirped-pulse average wavelength from our pulse centre wavelength, and the slightly unequal bandwidths of our chirped and anti-chirped pulses. With the dispersive elements, fig. 3b, we observed fs FWHM for chirped-pulse interference and fs FWHM for white-light interference. Dispersion clearly increased the width of the white-light interference pattern by ; the width of the chirped-pulse interference pattern remained essentially unchanged due to dispersion cancellation.
To show that CPI accurately determines group delays, we measured shifts in the centre of the interference of m and m for the chirped-pulse dip and white-light fringes respectively. These agree well with theoretical shifts of m and m, calculated from the group delays at nm and nm, respectively. Uncertainties in the theory result from errors in the measurement of sample thickness.

A further advantage of CPI as compared to white-light interferometry is the insensitivity of the visibility to unbalanced loss in the interferometer arms; loss will, however, reduce the overall output intensity, and thus the signal, in both cases. We measured both visibilities as a function of attenuation in the sample path. Rotating a half-wave plate in the sample path enables continuous adjustment of the loss at the polarizing beam splitter. The results of these measurements are shown in fig. 4. The visibility in the chirped-pulse interference is far more robust than the white-light interference, dropping only slightly at high attenuation due solely to background. This insensitivity can be explained by noting that in CPI the loss is common to both interfering Feynman paths even though it is localized in one physical path.
Chirped-pulse interferometry features all of the metrological advantages of Hong-Ou-Mandel interference with vastly higher signal levels. CPI achieves this without the inherent disadvantages of entangled photon sources and single-photon detection. Increasing the laser bandwidth and the spectral acceptance of sum-frequency generation Carrasco et al. (2006) will make CPI resolution competitive with that in optical coherence tomography Fujimoto et al. (1995); Drexler (2004). Automatic dispersion cancellation, enhanced resolution, and insensitivity to loss and path length fluctuations promise to make CPI a superior imaging technology, especially for dispersive and lossy media, e.g. biological specimens and photonic devices. More generelly, our work emphasizes the importance of delineating truly quantum effects from those with classical analogue Steinberg et al. (1992); Bennink et al. (2002); Ferri et al. (2005), and shows how quantum insights can inspire novel classical technologies. Our approach provides an avenue into previously untapped potential of classical interferometry.
We thank D. Strickland for sharing invaluable expertise on pulse compression techniques and K. Bizheva and G. Weihs for important discussions and loaning equipment. We thank J. Sanderson, J. Lundeen, M. Mitchell, J. Gambetta, A. White, and A. Steinberg for helpful comments. This work was supported by NSERC, and CFI. D.B. and R.K. acknowledge financial support from the Mike and Ophelia Lazaridis Fellowship and IQC, respectively.
References
- Abbott et al. (2005) B. Abbott, R. Abbott, R. Adhikari, J. Agresti, P. Ajith, B. Allen, J. Allen, R. Amin, S. B. Anderson, W. G. Anderson, et al., Phys. Rev. Lett. 95, 221101 (2005).
- Udem et al. (1999) T. Udem, J. Reichert, R. Holzwarth, and T. W. Hänsch, Phys. Rev. Lett. 82, 3568 (1999).
- Lee et al. (2002) H. Lee, P. Kok, and J. P. Dowling, J. Mod. Opt. 49, 2325 (2002).
- Giovannetti et al. (2004) V. Giovannetti, S. Lloyd, and L. Maccone, Science 306, 1330 (2004).
- Franson (1989) J. D. Franson, Phys. Rev. Lett. 62, 2205 (1989).
- Franson (1992) J. D. Franson, Phys. Rev. A 45, 3126 (1992).
- Hong et al. (1987) C. K. Hong, Z. Y. Ou, and L. Mandel, Phys. Rev. Lett. 59, 2044 (1987).
- Walther et al. (2004) P. Walther, J.-W. Pan, M. Aspelmeyer, R. Ursin, S. Gasparoni, and A. Zeilinger, Nature 429, 158 (2004).
- Mitchell et al. (2004) M. W. Mitchell, J. S. Lundeen, and A. M. Steinberg, Nature 429, 161 (2004).
- Resch et al. (2007a) K. J. Resch, K. L. Pregnell, R. Prevedel, A. Gilchrist, G. J. Pryde, J. L. O’Brien, and A. G. White, Phys. Rev. Lett. 98, 223601 (2007a).
- Steinberg et al. (1992) A. M. Steinberg, P. G. Kwiat, and R. Y. Chiao, Phys. Rev. Lett. 68, 2421 (1992).
- Bouwmeester et al. (1997) D. Bouwmeester, J.-W. Pan, K. Mattle, M. Eibl, H. Weinfurter, and A. Zeilinger, Nature 390, 575 (1997).
- Knill et al. (2001) E. Knill, R. Laflamme, and G. J. Milburn, Nature 409, 46 (2001).
- Steinberg et al. (1993) A. M. Steinberg, P. G. Kwiat, and R. Y. Chiao, Phys. Rev. Lett. 71, 708 (1993).
- Abouraddy et al. (2002) A. F. Abouraddy, M. B. Nasr, A. V. S. B. E. A. Saleh, and M. C. Teich, Phys. Rev. A 65, 053817 (2002).
- Nasr et al. (2003) M. B. Nasr, B. E. A. Saleh, A. V. Sergienko, and M. C. Teich, Phys. Rev. Lett. 91, 083601 (2003).
- Fujimoto et al. (1995) J. G. Fujimoto, M. E. Brezinski, G. J. Tearney, S. A. Boppart, and B. Bouma, Nat. Med. 1, 970 (1995).
- Erkmen and Shapiro (2006) B. I. Erkmen and J. H. Shapiro, Phys. Rev. A 74, 041601 (2006).
- Banaszek et al. (2007) K. Banaszek, A. S. Radunsky, and I. A. Walmsley, Opt. Comm. 269, 152 (2007).
- Resch et al. (2007b) K. J. Resch, P. Puvanathasan, J. S. Lundeen, M. W. Mitchell, and K. Bizheva, Opt. Express 15, 8797 (2007b).
- Pe’er et al. (2007) A. Pe’er, Y. Bromberg, B. Dayan, Y. Silberberg, and A. A. Friesem, Opt. Express 15, 8760 (2007).
- Karczmarek et al. (1999) J. Karczmarek, J. Wright, P. Corkum, and M. Ivanov, Phys. Rev. Lett. 82, 3420 (1999).
- Xia et al. (2003) J. F. Xia, J. H. Sanderson, W.-K. Liu, and D. Strickland, J. Phys. B. AMO Phys. 36, L409 (2003).
- Treacy (1969) E. B. Treacy, Quantum Electron. QE-5, 454 (1969).
- Martìnez (1988) O. E. Martìnez, IEEE J. Quantum Electron. 24, 2530 (1988).
- Pessot et al. (1987) M. Pessot, P. Maine, and G. Mourou, Opt. Comm. 62, 419 (1987).
- Paul (1986) H. Paul, Rev. Mod. Phys. 58, 209 (1986).
- Altepeter et al. (2005) J. Altepeter, E. Jeffrey, and P. Kwiat, Opt. Express 13, 8951 (2005).
- Fercher et al. (2003) A. F. Fercher, W. Drexler, C. K. Hitzenberger, and T. Lasser, Rep. Prog. Phys. 66, 239 (2003).
- Carrasco et al. (2006) S. Carrasco, M. B. Nasr, A. V. Sergienko, B. E. Saleh, M. C. Teich, J. P. Torres, and L. Torner, Opt. Lett. 31, 253 (2006).
- Drexler (2004) W. Drexler, J. Biomed. Opt. 9, 47 (2004).
- Bennink et al. (2002) R. S. Bennink, S. J. Bentley, and R. W. Boyd, Phys. Rev. Lett. 89, 113601 (2002).
- Ferri et al. (2005) F. Ferri, D. Magatti, A. Gatti, M. Bache, E. Brambilla, and L. A. Lugiato, Phys. Rev. Lett. 94, 183602 (2005).