Galaxy bulges and their black holes: a requirement for the quenching of star formation
Abstract
One of the central features of the last 8 to 10 billion years of cosmic history has been the emergence of a well-populated red sequence of non-star-forming galaxies. A number of models of galaxy formation and evolution have been devised to attempt to explain this behavior. Most current models require feedback from supermassive black holes (AGN feedback) to quench star formation in galaxies in the centers of their dark matter halos (central galaxies). Such models make the strong prediction that all quenched central galaxies must have a large supermassive black hole (and, by association, a prominent bulge component). I show using data from the Sloan Digital Sky Survey that the observations are consistent with this prediction. Over 99.5% of red sequence galaxies with stellar masses in excess of have a prominent bulge component (as defined by having a Sérsic index above 1.5). Those very rare red sequence central galaxies with little or no bulge () usually have detectable star formation or AGN activity; the fraction of truly quenched bulgeless central galaxies is of the total red sequence population. I conclude that a bulge, and by implication a supermassive black hole, is an absolute requirement for full quenching of star formation in central galaxies. This is in agreement with the most basic prediction of the AGN feedback paradigm.
1 Introduction
A key feature of the last 8–10 billion years of galaxy evolution is the emergence of a well-populated red sequence of non-star forming galaxies (e.g., Bell et al., 2004; Faber et al., 2007; Brown et al., 2007). The present-day red sequence has little scatter in color at a given magnitude, and appears to be largely composed of bulge-dominated and early-type spiral galaxies (Visvanathan & Sandage, 1977; Bower et al., 1992). Theoretical models of galaxy evolution have had difficulty in reproducing the properties of red sequence galaxies using standard recipes for the cooling of gas, star formation and stellar feedback (see, e.g., Bower et al., 2006; Croton et al., 2006; Cattaneo et al., 2007, for discussions of this issue). In such ‘standard’ models, star formation is insufficiently quenched, leading to a dramatic overabundance of massive blue star-forming galaxies.
Current models have attempted to remedy this shortcoming by quenching star formation in galaxies through two main classes of mechanism. The first mechanism, which affects only satellite galaxies (i.e., the non-central galaxies in groups and clusters), is a shutoff of gas cooling in galaxies once they fall into a larger halo. Such a recipe has been in at least semi-analytic models for some time (see, e.g., Cole et al., 2000) and produces a population of relatively low-mass highly-clustered red sequence galaxies. These prescriptions are being currently tested using the SDSS and other surveys (e.g., Baldry et al., 2006, Weinmann et al., 2006, Haines et al., 2007a), and I will not touch further on this issue in this paper.
Another mechanism (or mechanisms) has been required by the models to shut off star formation in central galaxies (i.e., the galaxies lying in the center of their dark matter halos, and presumably at the focus of any inflow of gas). An important candidate (I will touch upon others later) is feedback from accretion of matter onto supermassive black holes, which either disrupts gas cooling in the galaxy halo (e.g., ‘radio mode AGN feedback’, Croton et al., 2006, Fabian et al., 2006) or drives gas out of the central galaxy (e.g., ‘quasar mode AGN feedback’; Kauffmann & Haehnelt, 2000; Hopkins et al., 2006, Tremonti et al., 2007)111It is expected that such mechanisms act together; e.g., stellar or quasar-powered winds may expel the gas from the galaxy originally, while low-level AGN activity may suppress future gas cooling. Most models include both types of feedback. . In this picture, given the existence of a tight correlation between black hole mass and bulge mass (e.g., Magorrian et al., 1998; Häring & Rix, 2004), it is natural to expect that quenching and the existence of a large bulge would be tightly linked.
Indeed, such a correlation is well-documented, at least in a broad sense (see, e.g., Strateva et al., 2001 or Fig. 7 of Blanton et al., 2003b). Yet, if AGN feedback is the only way for central galaxies to quench their star formation, such a paradigm makes a strong prediction: bulgeless quenched central galaxies cannot exist. In this sense, the small but non-negligible population of bulgeless (low Sérsic index) galaxies with red colors in Fig. 7 of Blanton et al. (2003b) is of key importance. Are these galaxies all satellite galaxies and/or dust-obscured edge-on galaxies? Or, is there indeed a significant population of red, central bulgeless disk galaxies? In the latter case, one would be driven to prefer, at least in certain circumstances, other possible mechanisms for quenching star formation (see, e.g., Naab et al., 2007, Dekel & Birnboim, 2007, Khochfar & Ostriker, 2007, Dekel & Birnboim, 2006, Birnboim et al., 2007 or Guo & Oh, 2007 on gravitational heating, the influence of the development of virial shocks, and the heating of large halos with cosmic ray energy).
The goal of this paper is to attempt to test the key prediction of AGN feedback — namely, that bulgeless quenched central galaxies do not exist — using the Sloan Digital Sky Survey’s Data Release 2 (Abazajian et al., 2004). In §2, I describe the data and derived parameters that I use in this investigation. In §3, I describe the results, showing the properties of the galaxy population as a function of galaxy morphology for central galaxies. In sections 4 and 5, I discuss the results and present my conclusion. I adopt km s-1 Mpc-1, and in what follows.
2 The Data
I use publicly-available catalogs derived from the Sloan Digital Sky Survey’s (SDSS) Data Release Two (Abazajian et al., 2004)222DR2 is used in preference to larger, later SDSS data releases because it is the only data release to have publicly-available galaxy density estimates, group catalogs, Sérsic fits and star formation rate estimates.. The SDSS is an imaging and spectroscopic survey that has so far mapped of the sky. Imaging data are produced simultaneously in five photometric bands, namely , , , , and (Fukugita et al., 1996; Gunn et al., 1998; Hogg et al., 2001; Gunn et al., 2006). The data are processed through pipelines to measure photometric and astrometric properties (Lupton et al., 1999; Stoughton et al., 2002; Smith et al., 2002; Pier et al., 2003; Ivezić et al., 2004; Tucker et al., 2006) and to select targets for spectroscopic follow-up (Blanton et al., 2003c; Strauss et al., 2002). DR2 includes spectroscopy over an area of square degrees, and imaging for a larger area.
For this paper, I use the sample of galaxies in the New York University Value Added Galaxy Catalog (NYU VAGC; Blanton et al., 2005). For galaxies with spectroscopic redshifts, I use absolute magnitudes -corrected to the rest-frame and passbands (Blanton et al., 2003a) and corrected for Galactic foreground extinction following Schlegel et al. (1998). I adopt the absolute Petrosian magnitude for the galaxy absolute magnitude (random and systematic uncertainties mag), and the model color for a higher S/N estimate of galaxy color (uncertainties mag). Stellar masses were estimated under the assumption of a universally-applicable Chabrier (2003) stellar IMF using the following color–stellar M/L relation:
| (1) |
where an offset of dex has been applied to the relation from Bell et al. (2003) to convert from a diet Salpeter IMF to a Chabrier (2003) IMF. These stellar masses have random uncertainties of dex; systematic uncertainties from recent bursts of star formation and other sources may exceed this estimate in cases where the bursts contribute a significant fraction of the galaxy’s light (Bell & de Jong, 2001).
In order to gain a more complete understanding of star formation and AGN activity in the sample galaxies, star formation and AGN classifications and estimates of total star formation rate were taken from Brinchmann et al. (2004), using emission line measurements described in Tremonti et al. (2004). Galaxies are classified as star forming, AGN, composites, or are left unclassified (typically because the galaxies lack line emission in their SDSS spectra).
Disk galaxies were selected by selecting galaxies with nearly an exponential light profile. Blanton et al. (2003b) fit the light profile of galaxies in the SDSS with a seeing-convolved Sérsic (1968) profile . The Sérsic index describes the shape of the light profile, where corresponds to an exponential light profile and corresponds to a law profile characteristic of massive early-type galaxies. In what follows, I apply a cut to the Sérsic indices in -band to select disk galaxies with little or no contribution from a bulge to the light profile of the galaxy; I apply a further cut that the half-light radius should be larger than to discard all galaxies with little/no structural information in the NYU VAGC333The Sérsic fits are used in preference to the more frequently used concentration parameter because the Sérsic fits are convolved with the point spread function (i.e., the Sérsic fits should be less dependent on seeing than the seeing-dependent concentrations)..
Finally, in order to test the model predictions for the properties of central and satellite galaxies separately, I use a volume-limited catalog of galaxy groups complete to for group redshifts from Yang et al. (2005). Groups are identified using an iterative method which adopts a trial mass and identifies galaxies within a group mass-dependent transverse radius and velocity difference. Then based on the total -band luminosity of all candidate group members the group mass is adjusted and the process repeated until one converges on a final group mass. The group mass is assigned based on the total -band group luminosity of all members; in a cosmological simulation with the same volume as the observed sample, the most luminous group is assigned the largest halo mass, the second most luminous group the second largest mass, etc. Such groups are complete and contaminated at the level. In this group catalog, the majority of galaxies reside in single galaxy ‘groups’; i.e., they are the central galaxies in their own halos, with no satellites above the luminosity limit of the sample. For the purposes of this paper, I am almost completely unaffected by group mass uncertainties, as the primary purpose in using the catalogs is to separate the galaxy population into central galaxies and satellites; obviously, for single galaxy groups the identification of the central galaxy is trivial. For all multi-galaxy groups, Yang et al. identify the brightest galaxy in the group as the central galaxy. Comparison with mock group catalogs derived using this method demonstrates that of central galaxies are indeed the brightest galaxy in their group (Weinmann et al., 2006). Satellites are defined to be all other galaxies in groups.
3 Results
The goal of this paper is to test the generic prediction of AGN feedback that there should be no bulgeless central galaxies with quenched star formation. In order to test this prediction, I select galaxies with from the above sample. I further select galaxies with inclination (). This is a selection cut of some importance, as it minimizes the effects of dust extinction on galaxy colors and emission line-derived estimates of star formation rates; low-inclination galaxies with red colors and/or low star formation rates become then a reasonably clean probe of quenching444A further advantage of the selection of low-inclination systems is that the circular apertures used for the SDSS model and Sérsic fits are more appropriate for these more circular systems than they are for higher inclination systems..
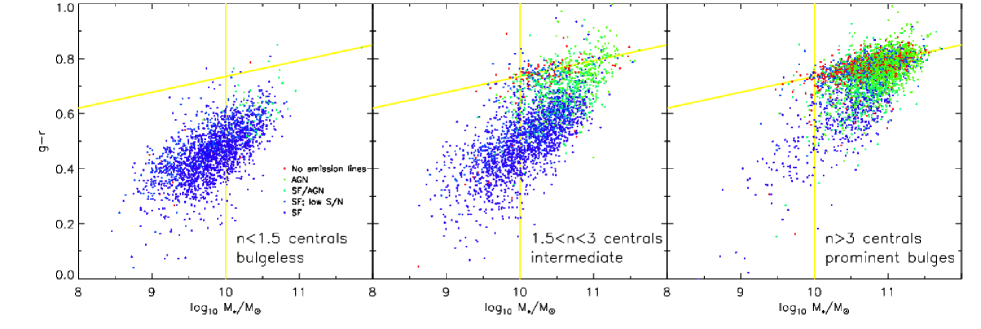
The key result of this study is shown in Fig. 1. The left-hand panel shows the properties of central galaxies without significant bulges, selected by requiring that the Sérsic index 555The referee pointed out that there are a number of examples of low-mass red sequence early-type (E/S0) galaxies with , e.g., in the Virgo cluster. Indeed, in the current sample, the vast majority of the red, non-star-forming galaxies are low-mass () satellites, primarily of groups with group masses in excess of . There are no non-star-forming central galaxies with (Fig. 1, left panel), lending weight to the notion that while non-star-forming E/S0 galaxies exist, they exist almost exclusively as satellites of reasonably massive groups, and are the product of (primarily hydrodynamical) stripping of late-type disk-dominated galaxies. . The right-hand panel shows the properties of central galaxies with large bulges, selected using . It is to be noted that the bin contains a number of galaxies with prominent (even dominant) disks; the is reflecting primarily the existence of a large bulge. The middle panel shows the intermediate bin. One can see that there are very few bulgeless galaxies on the red sequence; adopting a definition of red sequence of (i.e., a line 0.05 mag bluewards of the red sequence locus described by the thick line) and restricting our attention only to galaxies with , only (14/2744) of red sequence central galaxies have (14/725, or 1.9%, of galaxies are on the red sequence)666There are 16 red sequence central galaxies with values of and ; two of these (SDSS J142922.73004939.1 and SDSS J084958.78381203.2) are clearly edge-on and should have not been included in the sample (their catalog values of are simply incorrect) and they were excluded from the sample..
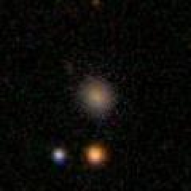
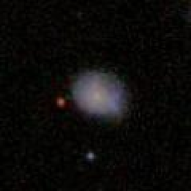
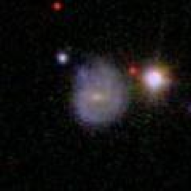
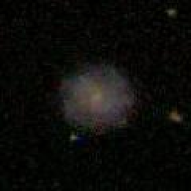
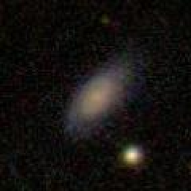
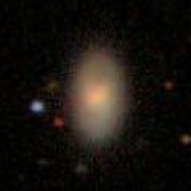
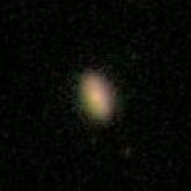
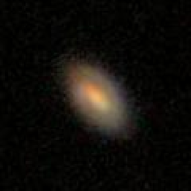
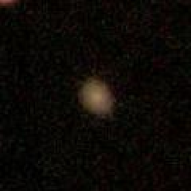
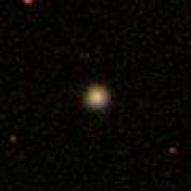
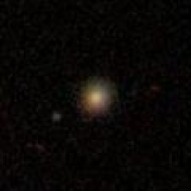
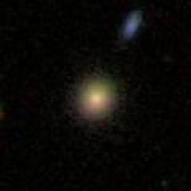
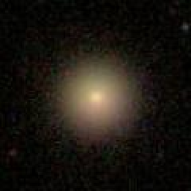
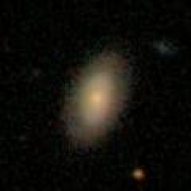
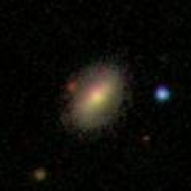
Fig. 2 shows example SDSS cutouts for subsamples of central galaxies with . The top panels show five of the 711 blue central galaxies; one can clearly see that the typical galaxy in this subsample is a late-type disk galaxy with a small or nonexistent bulge. The middle panels show five of the 14 red central galaxies. One can see in some cases a prominent bar and possible bulge. The lower panels show five of the 163 red central galaxies with . There is a tendency towards better defined bulges than for the red central galaxy subsample; however, it is clear that at least some fraction of the low- red subsample have structures similar to the higher subsample, lending weight to the notion that some of the 14 red central galaxies have incorrect estimates — 0.5% is an upper limit to the fraction of bulgeless red sequence galaxies. Taking Figs. 1 and 2 together, it is clear that there are very few, if any, bona fide bulgeless red central galaxies — in agreement with the most basic expectation of the AGN feedback paradigm.
One may have the concern that perhaps this result was an artifact of the way in which central and satellite galaxies are chosen by the group finding algorithm. One can repeat the analysis using cylindrical overdensities from the NYU VAGC (i.e., overdensities measured in cylinders of 1.4 Mpc radius and 1600 kms-1 extent along the line of sight; Blanton et al., 2003b), which are simpler and more conventional measures of environment. Isolated galaxies (defined as having overdensities ) are likely to reside as centrals in their own halos. When repeating the analysis using isolated galaxies as a (conceptually less optimal) proxy for central galaxies, one finds that the fraction of red sequence galaxies in isolated environments with is 1.0% (18/1842). So one finds, using a completely different technique for identifying likely central galaxies, the same result: in central galaxies, quenching is empirically correlated with the existence of a prominent bulge component.
4 Discussion
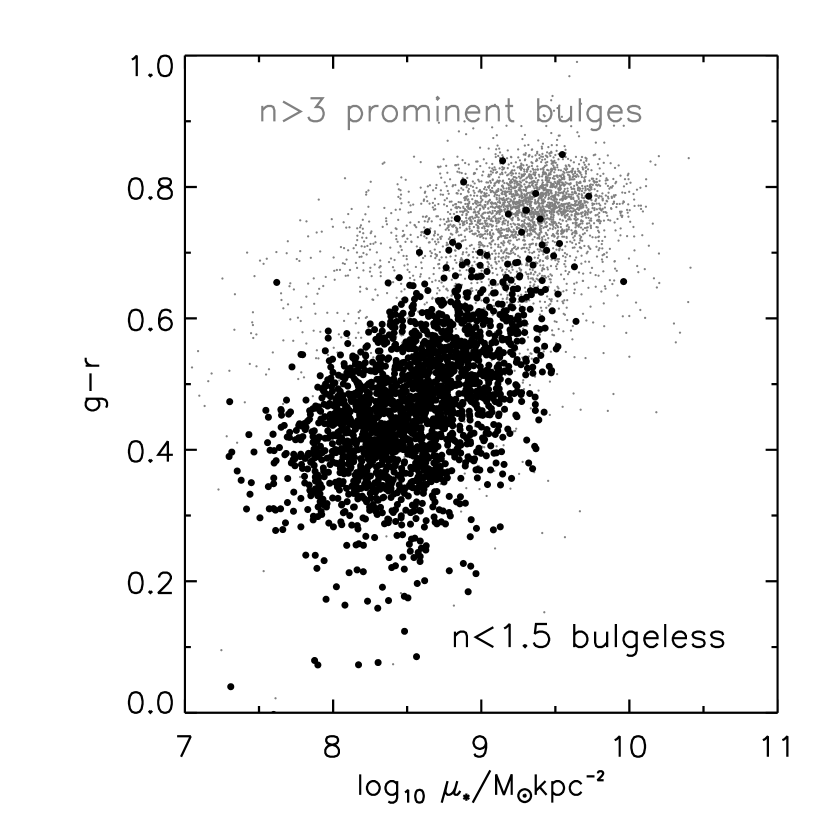
It is worth asking if this empirical association between having a bulge and the ability to quench is a truly bulge-specific association, or if it reflects a third, unexplored parameter. An obvious candidate parameter is surface density. In Kauffmann et al. (2003) and Bell & de Jong (2000) it was found that the stellar surface density of a galaxy was correlated strongly with star formation history, inasmuch as galaxies with high surface densities appeared to form the bulk of their stars at earlier epochs than galaxies with lower surface densities. In Fig. 3, I plot optical rest-frame color as a function of the stellar surface density within the half light radius for bulgeless galaxies (; black) and galaxies with large bulges (; gray). While is indeed a function of surface density for the galaxies, it is clear that at a given surface density (e.g., in the range around ) that galaxies with strong bulges are primarily quenched, whereas bulgeless galaxies at that same density still actively form stars. Such a conclusion was also reached by Kauffmann et al. (2006, see their Fig. 14), who explored this star formation rate per unit stellar mass as a function of surface density for a samples of galaxy split by concentration. Thus, one can rule out that the correlation seen in Fig. 1 is driven by underlying correlations with stellar surface density.
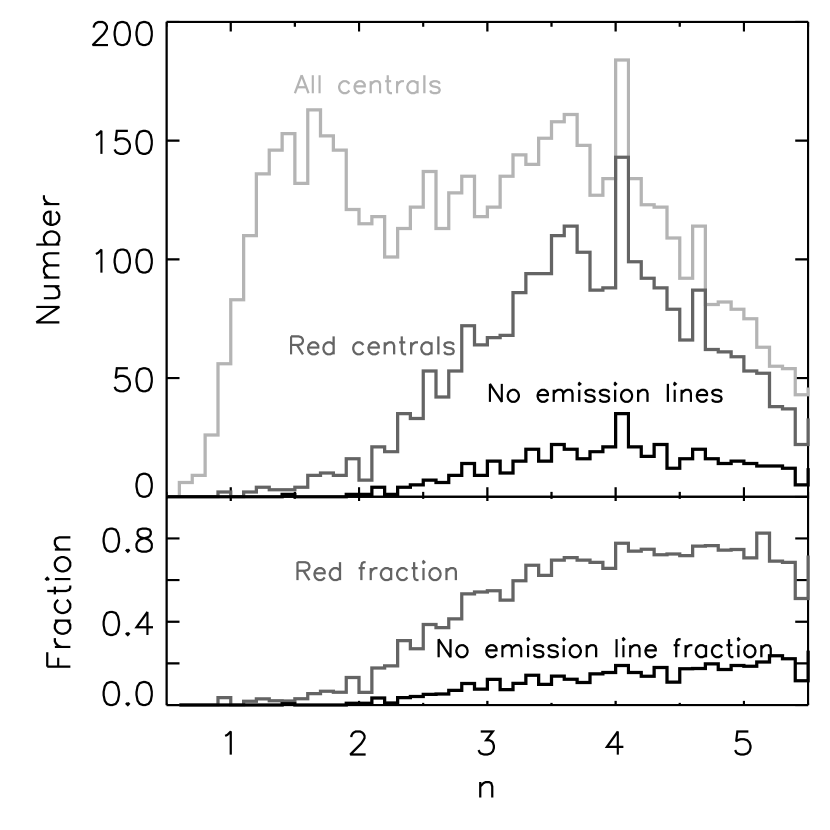
Fig. 4 shows the distribution of the Sérsic indices of the sample of central galaxies. One can see that the fraction of the sample that is red is a strong function of the Sérsic index, with a small red fraction for smoothly increasing to 777The red fraction does not asymptotically approach unity for the high systems because of the combined influence of our somewhat restrictive red sequence cut and the scatter of a small fraction of high systems towards the blue, as seen in Fig. 1.. Interestingly, only a small fraction () of red galaxies have no emission lines at all (the fraction of galaxies which are completely quenched, at least to the detection limits characteristic of the SDSS; see Haines et al., 2007b for the same result using GALEX data in conjunction with the SDSS). Put differently, complete quenching of gas infall into in central galaxies is a relatively uncommon occurrence; most red sequence centrals have some modest AGN activity or low-level star formation. In particular, only 1 out of the 14 red central galaxies with stellar masses above lacks line emission Fig. 1; i.e., complete quenching of bulgeless galaxies is a very rare occurrence888The right-most panel of the middle row of Fig. 2 shows this galaxy; this galaxy appears to be significantly more compact and concentrated than its would imply..
Finally, it is obvious that while bulges appear to be a necessary condition for the suppression of star formation, the simple existence of a bulge is not a sufficient condition to suppress star formation. There are a number of suggestions as to what this ‘second parameter’ could be: pseudobulges vs. classical bulges (Drory & Fisher, 2007), the transition to a hot virialized halo at halo masses (Dekel & Birnboim, 2006; Cattaneo et al., 2006), or the rate at which cosmological infall can deposit energy into the halo (Naab et al., 2007; Khochfar & Ostriker, 2007). In this context, it is noteworthy that for group masses 23% of the central galaxies are blue999Most of these blue central galaxies are spiral galaxies with large bulges (70%), 20% appear to be relatively undisturbed early-type (E/S0) galaxies, and 10% of them are highly disturbed, with asymmetries or tidal tails indicative of a previous interaction or merger. (as opposed to 35% for halos with masses below ). Thus although models which assume quenching is complete above a given mass cut (e.g., in the work of Cattaneo et al., 2006) offer a qualitatively interesting and computationally convenient approximation for the evolution of the galaxy population, it is clear that such an approximation is not correct in detail — even at group masses quenching is incomplete.
5 Concluding Remarks
The main message of this paper is simple. Galaxy evolution models with AGN feedback predict that quenching of star formation in central galaxies should occur only in those central galaxies with prominent bulges (therefore, large supermassive black holes). I have shown that this prediction was essentially correct, using data from the SDSS DR2. I choose to analyze only relatively low-inclination galaxies with ; while the general conclusions of this paper would hold also if higher inclination galaxies were included, the scattering of galaxies onto the red sequence by dust extinction considerably dilutes the significance and impact of the results. I found that at least of red sequence galaxies with stellar masses have prominent bulges (Sérsic indices ). Furthermore, most the 0.5% of bulgeless red sequence central galaxies had detectable line emission; there is only 1 central galaxy without detectable star formation out of the 6036 central galaxies in this mass-limited sample. This almost perfect empirical association between having a prominent bulge and quenching is in excellent agreement with the basic expectation of AGN feedback.
References
- Abazajian et al. (2004) Abazajian, K., et al. 2004, AJ, 128, 502
- Baldry et al. (2006) Baldry, I. K., Balogh, M. L., Bower, R. G., Glazebrook, K., Nichol, R. C., Bamford, S. P., & Budavari, T. 2006, MNRAS, 373, 469
- Bell & de Jong (2000) Bell, E. F., & de Jong, R. S. 2000, MNRAS, 312, 497
- Bell & de Jong (2001) —. 2001, ApJ, 550, 212
- Bell et al. (2003) Bell, E. F., McIntosh, D. H., Katz, N., & Weinberg, M. D. 2003, ApJS, 149, 289
- Bell et al. (2004) Bell, E. F., Wolf, C., Meisenheimer, K., Rix, H.-W., Borch, A., Dye, S., Kleinheinrich, M., Wisotzki, L., & McIntosh, D. H. 2004, ApJ, 608, 752
- Birnboim et al. (2007) Birnboim, Y., Dekel, A., & Neistein, E. 2007, submitted to MNRAS (astro-ph/0703435)
- Blanton et al. (2005) Blanton, M. R., et al. 2005, AJ, 129, 2562
- Blanton et al. (2003a) Blanton, M. R., Brinkmann, J., Csabai, I., Doi, M., Eisenstein, D., Fukugita, M., Gunn, J. E., Hogg, D. W., & Schlegel, D. J. 2003a, AJ, 125, 2348
- Blanton et al. (2003b) Blanton, M. R., et al. 2003b, ApJ, 594, 186
- Blanton et al. (2003c) Blanton, M. R., Lin, H., Lupton, R. H., Maley, F. M., Young, N., Zehavi, I., & Loveday, J. 2003c, AJ, 125, 2276
- Bower et al. (2006) Bower, R. G., Benson, A. J., Malbon, R., Helly, J. C., Frenk, C. S., Baugh, C. M., Cole, S., & Lacey, C. G. 2006, MNRAS, 370, 645
- Bower et al. (1992) Bower, R. G., Lucey, J. R., & Ellis, R. S. 1992, MNRAS, 254, 601
- Brinchmann et al. (2004) Brinchmann, J., Charlot, S., White, S. D. M., Tremonti, C., Kauffmann, G., Heckman, T., & Brinkmann, J. 2004, MNRAS, 351, 1151
- Brown et al. (2007) Brown, M. J. I., Dey, A., Jannuzi, B. T., Brand, K., Benson, A. J., Brodwin, M., Croton, D. J., & Eisenhardt, P. R. 2007, ApJ, 654, 858
- Cattaneo et al. (2007) Cattaneo, A., Blaizot, J., Weinberg, D. H., Kereš, D., Colombi, S., Davé, R., Devriendt, J., Guiderdoni, B., & Katz, N. 2007, MNRAS, 377, 63
- Cattaneo et al. (2006) Cattaneo, A., Dekel, A., Devriendt, J., Guiderdoni, B., & Blaizot, J. 2006, MNRAS, 370, 1651
- Chabrier (2003) Chabrier, G. 2003, PASP, 115, 763
- Cole et al. (2000) Cole, S., Lacey, C. G., Baugh, C. M., & Frenk, C. S. 2000, MNRAS, 319, 168
- Croton et al. (2006) Croton, D. J., Springel, V., White, S. D. M., De Lucia, G., Frenk, C. S., Gao, L., Jenkins, A., Kauffmann, G., Navarro, J. F., & Yoshida, N. 2006, MNRAS, 365, 11
- Dekel & Birnboim (2006) Dekel, A., & Birnboim, Y. 2006, MNRAS, 368, 2
- Dekel & Birnboim (2007) —. 2007, arXiv 0707.1214
- Drory & Fisher (2007) Drory, N., & Fisher, D. B. 2007, ApJ, 664, 640
- Faber et al. (2007) Faber, S. M., et al. 2007, ApJ, 665, 265
- Fabian et al. (2006) Fabian, A. C., Sanders, J. S., Taylor, G. B., Allen, S. W., Crawford, C. S., Johnstone, R. M., & Iwasawa, K. 2006, MNRAS, 366, 417
- Fukugita et al. (1996) Fukugita, M., Ichikawa, T., Gunn, J. E., Doi, M., Shimasaku, K., & Schneider, D. P. 1996, AJ, 111, 1748
- Gunn et al. (1998) Gunn, J. E., et al. 1998, AJ, 116, 3040
- Gunn et al. (2006) —. 2006, AJ, 131, 2332
- Guo & Oh (2007) Guo, F., & Oh, S. P. 2007, ArXiv e-prints, 706
- Haines et al. (2007a) Haines, C. P., Gargiulo, A., La Barbera, F., Mercurio, A., Merluzzi, P., & Busarello, G. 2007a, MNRAS, in press (arXiv 0707.1262)
- Haines et al. (2007b) Haines, C. P., Gargiulo, A., & Merluzzi, P., 2007b, submitted to MNRAS (arXiv 0707.2361)
- Häring & Rix (2004) Häring, N., & Rix, H.-W. 2004, ApJ, 604, L89
- Hogg et al. (2001) Hogg, D. W., Finkbeiner, D. P., Schlegel, D. J., & Gunn, J. E. 2001, AJ, 122, 2129
- Hopkins et al. (2006) Hopkins, P. F., Hernquist, L., Cox, T. J., Di Matteo, T., Robertson, B., & Springel, V. 2006, ApJS, 163, 1
- Ivezić et al. (2004) Ivezić, Ž., et al. 2004, Astronomische Nachrichten, 325, 583
- Kauffmann & Haehnelt (2000) Kauffmann, G., & Haehnelt, M. 2000, MNRAS, 311, 576
- Kauffmann et al. (2006) Kauffmann, G., Heckman, T. M., De Lucia, G., Brinchmann, J., Charlot, S., Tremonti, C., White, S. D. M., & Brinkmann, J. 2006, MNRAS, 367, 1394
- Kauffmann et al. (2003) Kauffmann, G., Heckman, T. M., White, S. D. M., Charlot, S., Tremonti, C., Peng, E. W., Seibert, M., Brinkmann, J., Nichol, R. C., SubbaRao, M., & York, D. 2003, MNRAS, 341, 54
- Khochfar & Ostriker (2007) Khochfar, S., & Ostriker, J. P. 2007, submitted to ApJ (arXiv 0704.2418)
- Lupton et al. (1999) Lupton, R. H., Gunn, J. E., & Szalay, A. S. 1999, AJ, 118, 1406
- Magorrian et al. (1998) Magorrian, J., et al. 1998, AJ, 115, 2285
- Naab et al. (2007) Naab, T., Johansson, P. H., Ostriker, J. P., & Efstathiou, G. 2007, ApJ, 658, 710
- Pier et al. (2003) Pier, J. R., Munn, J. A., Hindsley, R. B., Hennessy, G. S., Kent, S. M., Lupton, R. H., & Ivezić, Ž. 2003, AJ, 125, 1559
- Schlegel et al. (1998) Schlegel, D. J., Finkbeiner, D. P., & Davis, M. 1998, ApJ, 500, 525
- Sérsic (1968) Sérsic, J. L. 1968, Atlas de galaxias australes (Cordoba, Argentina: Observatorio Astronomico, 1968)
- Smith et al. (2002) Smith, J. A., et al. 2002, AJ, 123, 2121
- Stoughton et al. (2002) Stoughton, C., et al. 2002, AJ, 123, 485
- Strateva et al. (2001) Strateva, I., et al. 2001, AJ, 122, 1861
- Strauss et al. (2002) Strauss, M. A., et al. 2002, AJ, 124, 1810
- Tremonti et al. (2004) Tremonti, C. A., et al. 2004, ApJ, 613, 898
- Tremonti et al. (2007) Tremonti, C. A., Moustakas, J., & Diamond-Stanic, A. M. 2007, ApJ, 663, L77
- Tucker et al. (2006) Tucker, D. L., et al. 2006, Astronomische Nachrichten, 327, 821
- Visvanathan & Sandage (1977) Visvanathan, N., & Sandage, A. 1977, ApJ, 216, 214
- Weinmann et al. (2006) Weinmann, S. M., van den Bosch, F. C., Yang, X., Mo, H. J., Croton, D. J., & Moore, B. 2006, MNRAS, 372, 1161
- Yang et al. (2005) Yang, X., Mo, H. J., van den Bosch, F. C., & Jing, Y. P. 2005, MNRAS, 356, 1293