Pattern Formation During Deformation of a Confined Viscoelastic Layer:
From a Viscous Liquid to a Soft Elastic Solid.
Abstract
We study pattern formation during tensile deformation of confined viscoelastic layers. The use of a model system (PDMS with different degrees of crosslinking) allows us to go continuously from a viscous liquid to an elastic solid. We observe two distinct regimes of fingering instabilities: a regime called ”elastic“ with interfacial crack propagation where the fingering wavelength only scales with the film thickness, and a bulk regime called ”viscoelastic“ where the fingering instability shows a Saffman-Taylor-like behavior. We find good quantitative agreement with theory in both cases and present a reduced parameter describing the transition between the two regimes and allowing to predict the observed patterns over the whole range of viscoelastic properties.
pacs:
47.54.-r,47.20.Gv,68.15.+e,83.80.VaIntroduction – Good soft adhesives show viscous and elastic properties that allow on the one hand having a good molecular contact with the substrate and on the other hand a resistance to a certain stress level during debonding. The viscoelastic properties determine the debonding mechanisms when being detached from a rigid substrate, involving the formation of complex patterns as bulk fingering or interfacial crack propagation Shull and Creton (2004). Pattern formation during tensile deformation of thin layers in confined geometries has also attracted much interest from a fundamental point of view. In the case of a purely viscous liquid confined between two plates being separated, air penetrating from the edges leads to the formation of bulk fingers. This fingering instability is well described by the classical Saffman – Taylor instability Saffman and Taylor (1958); Lindner et al. (2005); Derks et al. (2003); Ben Amar and Bonn (2005); Shelley et al. (1997); Poivet et al. (2004), where a less viscous liquid pushes a more viscous liquid in a confined geometry. For a thin layer of a purely elastic material, undulations of an interfacial crack front have been observed experimentally and explained theoretically Ghatak et al. (2000); Adda-Bedia and Mahadevan (2006); Monch and Herminghaus (2001); Fields and Ashby (1976). Some studies have focused on complex or yield stress fluids Derks et al. (2003); Ben Amar and Bonn (2005), elastic gels Shull et al. (2000); Webber et al. (2003), ferromagnetic fluids Oliveira and Miranda (2006), pastes Lemaire et al. (1993), or considered the role of the substrate Sinha et al. (2008). The transition between a viscous liquid and a glassy material has been studied Harvey and Cebon (2003); Zhao et al. (2006).
However no systematic study of the pattern formation during deformation of a viscoelastic material focusing on the respective role of the liquid and elastic properties has been undertaken so far. We present here a system involving a specifically designed model soft material with tunable properties going continuously from a viscous liquid to an elastic solid. Studying the debonding mechanisms using a probe tack test on these materials allows for the first time to explain the observed patterns quantitatively over the whole range of viscoelastic properties and to describe the transition between the two well known limits observed for a pure liquid or an elastic solid. Such a study helps for a better understanding of the instabilities observed in the viscoelastic regime of industrial applications. It is also of importance for any theoretical treatment aiming to bridge the gap between the different formalisms that apply to viscous liquids and elastic solids.
Materials and Methods – As model system we use a weakly cross linked polymer, Poly(dimethylsiloxane) (PDMS). We chose the commercial product ”Sylgard© 184 Silicone Elastomer Kit“ purchased at Dow Corning. It consists of a silicone oil and a curing agent that is able to form cross links, i.e. chemical bonds between the polymer chains. The non cured silicone oil is a Newtonian liquid. Adding curing agent increases the number density of cross link points and the material becomes viscoelastic. The fully cured PDMS at of curing agent is an elastic solid. This system thus represents an ideal model system providing a reproducible and easy way to go continuously from a viscous liquid to an elastic solid.
To determine the material’s linear rheological properties, we perform oscillatory frequency sweep tests after curing in a plate-plate geometry. This gives access to the storage and loss moduli and that are measures for the material’s elastic and viscous properties, respectively, as well as to the complex modulus .

Figure 1 shows the results for different amounts of cross linker. The material with about of cross linker is elastic, having a several orders of magnitude higher than ; adding about of cross linker leads to a product in the viscoelastic regime close to the gel point.
We prepare polymeric films on microscope glass slides () that are precleaned and coated with a primer (Dow Corning 1200 OS) to enhance the adherence of PDMS to the slide. We use applicators to deposit films of different thicknesses. The samples are cured in a desiccator at for five hours under vacuum. To determine the final thickness, we measure the film’s weight and size. We validated this method by comparison with an optical technique using interference fringes.

We perform tensile deformation tests using a home built ”probe tack“ set up with good resolution
and visualization capabilities Josse et al. (2004). It mainly consists of a flat circular
steel probe that is brought into contact and debonded from a soft viscoelastic film with controlled
speed, see figure 2. During the test, the probe displacement and the normal
force on the probe are measured. We also visualize the debonding process from above with a camera
mounted on a microscope to gain qualitative insight into the debonding mechanisms. The probe has a
radius and is made of polished stainless steel.
Experimental – The parameters varied in our experiments, besides the viscoelastic
properties, are the layer thickness and the debonding speed . Typical values are and . During a typical experiment, air penetrates from the edge of the
confined layer. It can penetrate either in the bulk, followed by a strong deformation and the
subsequent formation of thin ”bridges” (fibrils) between the probe and the glass slide, or at the
interface between the probe surface and the polymer film, leading to a fast debonding by
interfacial crack propagation. In both cases, we observe the destabilization of the initially
circular debonding line by undulations and the subsequent propagation of air fingers. We
characterize the emerging patterns by determining the finger number at the moment the first
undulations are observable, see inset of figure 5, and calculate
a wavelength Initially a destabilizing wavelength can be clearly defined,
but as the time and debonding process go on, highly non-linear patterns are evolving, showing
features like side branching and tip splitting, see figure
3. In the present study we restrict our interest to the analysis of the
linear destabilization process at the onset.
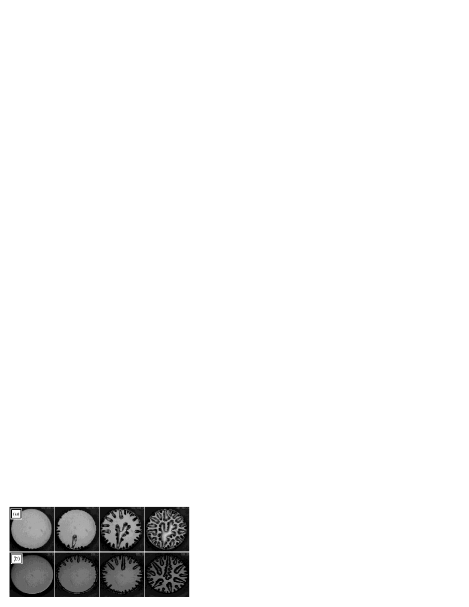
Results and Discussion – We characterize here in more detail the two cases of interfacial and bulk mechanisms introduced above. Although the patterns look quite similar in the top view pictures on figure 3 (a) and (b), two different mechanisms are at their origin.
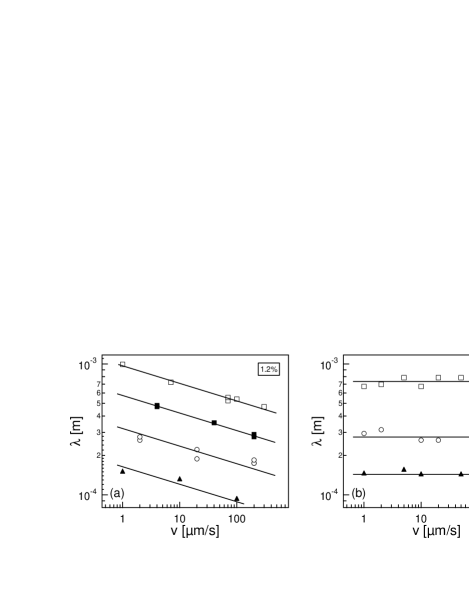
In the case of the viscoelastic regime characterized by fibrillation and a bulk deformation mechanism, the pattern formation is sensitive to both the initial film thickness and the debonding speed for a given material. As the wavelength decreases with the debonding speed and increases linearly with the initial film thickness (figure 4(a)), one can attempt to compare to the classical Saffman - Taylor (ST) or viscous fingering instability Saffman and Taylor (1958); Paterson (1981) predicting by linear stability analysis
| (1) |
is the dimensionless capillary number comparing viscous to capillary forces, the viscosity, the surface tension between PDMS and air, and denotes the radial velocity of the circular interface. Presuming an incompressible fluid and therefore volume conservation, for a Newtonian fluid. To adapt this prediction to the case of viscoelastic materials, we replace the Newtonian viscosity with a complex viscosity defined as . depends on the frequency, estimated for each of our experiments following .
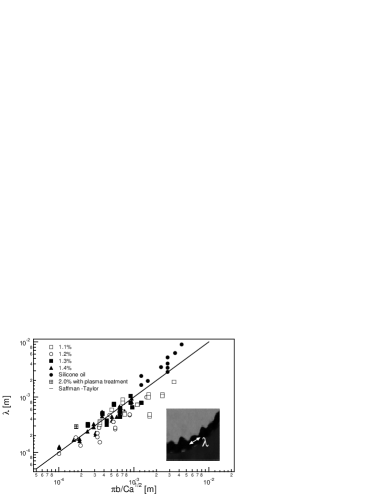
Figure 5 shows a good quantitative agreement between the ST prediction and our data, despite some scattering. The limit of a purely viscous liquid is represented by the dark full spots obtained for Newtonian silicone oils Derks and Lindner (2007). Surprisingly, the ST prediction holds going from the viscous limit up to highly non-Newtonian viscoelastic materials above the gel point.
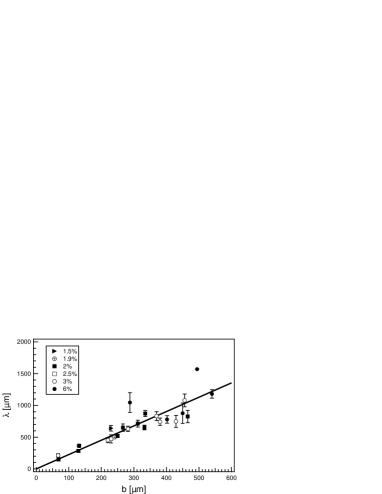
The second case we investigated, the elastic regime, is characterized by interfacial crack propagation. The linear wavelength does not depend on the debonding speed over three decades, see figure 4(b). The dependence on the debonding speed is a quantitative criterion to decide which regime an experiment belongs to. Figure 6 shows that depends only on the initial film thickness over three orders of magnitude of the elastic modulus (). These results are in qualitative agreement with theoretical predictions and with experimental observations in a slightly different geometry Ghatak et al. (2000). Linear stability analysis has also been done by Adda-Bedia and Mahadevan Adda-Bedia and Mahadevan (2006). Considering the case of static peeling, they take into account the bending stiffness of the flexible cover plates used for the peeling tests and the finite film thickness. They calculate a critical confinement above which shear deformations are more beneficial for the system’s energy than normal deformations, leading to undulations. The confinement parameter is defined as , being the bending stiffness of the cover plate, the film’s elastic modulus and the film thickness. The critical value is in good agreement with experiments by Ghatak et al who find . We compare our experiments to these results by considering the bending stiffness of our microscopic glass slides. With for a glass slide of , we find for all our experiments, thus we place ourselves always in the regime of an unstable crack front. The critical wavelength calculated in Adda-Bedia and Mahadevan (2006) scales only with the film thickness and is independent of all material parameters. Our result is in good quantitative agreement with theory. Deviations might be due to the fact that calculations are done for whereas our experiments are placed far beyond the critical value.
A surprising result of our work is the very abrupt change in the debonding behavior: our experiments always fall into the elastic or viscoelastic regime without experiencing a transition regime. The appropriate parameter to describe the transition between interfacial and bulk mechanisms in the case of an elastic rubber has been proposed to be Webber et al. (2003). The critical energy release rate is a measure for the energy one has to provide to the system to make an interfacial crack move. represents the elastic energy necessary to deform the bulk of a sample of thickness with elastic modulus . For a viscoelastic material, can be divided into a constant component , the threshold fracture energy, and a dissipation term depending on crack velocity. It has been proposed Maugis and Barquins (1978) that the dissipation term should be proportional to . Hence approximating and substituting into yields for soft viscoelastic layers a new parameter depending only on the linear rheological properties and Carelli et al. (2007). For cases where the energy cost to propagate a crack is high, bulk mechanisms are expected, while interfacial crack propagation should be observed when the elastic deformation of the layer requires high energy. This is well presented by plotting the parameter space spanned by and , see figure 7. Full symbols indicate interfacial, open symbols bulk mechanisms.

Following the theory it should be possible to switch between interfacial and bulk mechanism by
changing . We performed an exemplary experiment replacing the steel probe
() by a glass surface previously subjected to plasma treatment,
increasing considerably. We estimated by
measuring the work of adhesion for the fully cured PDMS performing a tack test at low debonding
speed. We were indeed able to change the debonding mechanism from interfacial to bulk behavior for
a sample with of cross linker. This experiment is represented by the symbol on
figure 7. Furthermore, changing changes the wavelength which
is now well described by the ST
prediction,see on figure 5.
Conclusion – We present in this Letter for the first time a systematic study of the transition between bulk deformation mechanisms and interfacial crack propagation during tensile tests on thin layers of viscoelastic materials with properties going from a viscous liquid to an elastic solid. In both cases, we characterize the emerging fingering patterns quantitatively following theoretical predictions. The transition we observe is very sharp without experiencing an intermediate regime. We propose a possible empiric parameter that allows to draw a mechanism map spanned by the parameters and separating nicely the different mechanisms and allowing therefore to predict the debonding behavior of our system.
We thank Mokhtar Adda-Bedia, Arezki Boudaoud and Dominic Vella (LPS-ENS) for stimulating discussions and Guylaine Ducouret (PPMD-ESPCI) and Alexis Prevost (LPS-ENS) for help with the sample characterization.
References
- Shull and Creton (2004) K. R. Shull and C. Creton, Journal of Polymer Science Part B-Polymer Physics 42, 4023 (2004).
- Saffman and Taylor (1958) P. G. Saffman and G. Taylor, Proceedings of the Royal Society of London Series a-Mathematical and Physical Sciences 245, 312 (1958).
- Lindner et al. (2005) A. Lindner, D. Derks, and M. J. Shelley, Physics of Fluids 17, 172107 (2005).
- Derks et al. (2003) D. Derks, A. Lindner, C. Creton, and D. Bonn, Journal of Applied Physics 93, 1557 (2003).
- Ben Amar and Bonn (2005) M. Ben Amar and D. Bonn, Physica D-Nonlinear Phenomena 209, 1 (2005).
- Shelley et al. (1997) M. J. Shelley, F. R. Tian, and K. Wlodarski, Nonlinearity 10, 1471 (1997).
- Poivet et al. (2004) S. Poivet, F. Nallet, C. Gay, J. Teisseire, and P. Fabre, European Physical Journal E 15, 97 (2004).
- Ghatak et al. (2000) A. Ghatak, M. K. Chaudhury, V. Shenoy, and A. Sharma, Physical Review Letters 85, 4329 (2000); V. Shenoy and A. Sharma, Physical Review Letters 86, 119 (2001); A. Ghatak and M. K. Chaudhury, Langmuir 19, 2621 (2003); A. Ghatak and M. K. Chaudhury, Journal of Adhesion 83, 679 (2007).
- Adda-Bedia and Mahadevan (2006) M. Adda-Bedia and L. Mahadevan, Proceedings of the Royal Society a-Mathematical Physical and Engineering Sciences 462, 3233 (2006).
- Monch and Herminghaus (2001) W. Monch and S. Herminghaus, Europhysics Letters 53, 525 (2001).
- Fields and Ashby (1976) R. J. Fields and M. F. Ashby, Philosophical Magazine 33, 33 (1976).
- Shull et al. (2000) K. R. Shull, C. M. Flanigan, and A. J. Crosby, Physical Review Letters 84, 3057 (2000).
- Webber et al. (2003) R. E. Webber, K. R. Shull, A. Roos, and C. Creton, Physical Review E 68, 021805 (2003).
- Oliveira and Miranda (2006) R. M. Oliveira and J. A. Miranda, Physical Review E 73, 036309 (2006).
- Lemaire et al. (1993) H. Lemaire, Y. Ould Mohamed Abdelhaye, J. Larue, R. Benoit, P. Levitz, and H. Van Damme, Fractals 1, 968 (1993).
- Sinha et al. (2008) S. Sinha, T. Dutta, and S. Tarafdar, European Physical Journal E 25, 267 (2008).
- Harvey and Cebon (2003) J. A. F. Harvey and D. Cebon, Journal of Materials Science 38, 1021 (2003).
- Zhao et al. (2006) B. X. Zhao, H. B. Zeng, Y. Tian, and J. Israelachvili, Proceedings of the National Academy of Sciences of the United States of America 103, 19624 (2006); H. Zeng, Y. Tian, B. Zhao, M. Tirrell, and J. Israelachvili, Macromolecules 40, 8409 (2007).
- Josse et al. (2004) G. Josse, P. Sergot, C. Creton, and M. Dorget, Journal of Adhesion 80, 87 (2004).
- Paterson (1981) L. Paterson, Journal of Fluid Mechanics 113, 513 (1981).
- Derks and Lindner (2007) D. Derks and A. Lindner, private communication (2007).
- Maugis and Barquins (1978) D. Maugis and M. Barquins, Journal of Physics D-Applied Physics 11, 1989 (1978).
- Carelli et al. (2007) C. Carelli, F. Deplace, L. Boissonnet, and C. Creton, Journal of Adhesion 83, 491 (2007).