Wide-Field Chandra X-Ray Observations of AGN in Abell 85 & Abell 754
Abstract
To better understand the mechanism or mechanisms that lead to AGN activity today, we measure the X-ray AGN fraction in a new sample of nearby clusters and examine how it varies with galaxy properties, projected cluster-centric radius, and cluster velocity dispersion. We present new wide-field Chandra X-ray Observatory observations of Abell 85, Abell 754 and the background cluster Abell 89B out to their virial radii. Out of seventeen X-ray sources associated with galaxies in these clusters, we classify seven as X-ray AGN with . Only two of these would be classified as AGN based on their optical spectra. We combine these observations with archival data to create a sample of X-ray AGN from six clusters and find that of galaxies host X-ray AGN with . We find that more X-ray AGN are detected in more luminous galaxies and attribute this to larger spheriods in more luminous galaxies and increased sensitivity to lower Eddington-rate accretion from black holes in those spheroids. At a given X-ray luminosity limit, more massive black holes can be accreting less efficiently, yet still be detected. If interactions between galaxies are the principal drivers of AGN activity, then the AGN fraction should be higher in lower velocity dispersion clusters and the outskirts of clusters. However, the tendency of the most massive and early-type galaxies to lie in the centers of the richest clusters could dilute such trends. While we find no variation in the AGN fraction with projected cluster-centric radius, we do find that the AGN fraction increases significantly from in rich clusters to in those with lower velocity dispersions.
Subject headings:
galaxies: active — galaxies: clusters: general — galaxies: general — X-rays: galaxies — X-rays: galaxies: clusters — X-rays: general1. Introduction
What is the principal driver of Active Galactic Nuclei (AGN) in the nearby Universe? Major mergers between gas-rich galaxies are largely accepted as the dominant fueling mechanism (e.g., Barnes & Hernquist 1992) for the luminous quasar population. Galaxy harassment, where dynamical instabilities driven by high-speed fly-by interactions efficiently channel gas to the centers of galaxies, has also been invoked as a mechanism for fueling AGN (Moore et al. 1996; Lake et al. 1998). In both scenarios, higher AGN fractions are predicted for environments where gas-rich galaxies are likely to interact with one another. Although galaxy densities are high, such interactions are not favored in the centers of rich clusters, whose galaxies are less (cold) gas-rich than their counterparts in the field (e.g., Giovanelli & Haynes 1985) and where the large relative velocities betweens galaxies inhibits actual mergers. Higher fractions of AGN are expected for lower velocity dispersion structures. The AGN fraction at the outskirts of clusters should also be larger as a higher fraction of gas-rich galaxies are found toward the outskirts of clusters and infalling structures with lower velocity dispersions may not yet have virialized. Some of this picture has been supported by numerous studies of clusters that identified AGN by their optical spectra observed a substantial decrease in the number of cluster AGN relative to the field (Gisler 1978). Specifically, Dressler et al. (1985) measured a decrease from to in AGN residing in bright galaxies.
On the other hand, a large fraction of elliptical galaxies (–) contain low-ionization nuclear emission-regions (LINERs; Ho et al. 1997), many of which may be ionized by the accretion disk of a low-luminosity AGN (Ho et al. 1993). These elliptical galaxies comprise a higher fraction of the galaxy populations in the high surface density regions at the centers of clusters (Dressler 1980), and in particular the most luminous elliptical galaxies () that are much more centrally concentrated (Thomas & Katgert 2006). Toward the outskirts of clusters, progressively higher fractions of poststarburst and starforming galaxies are found (e.g., Dressler 1980; Fisher et al. 1998). Therefore, a relation between AGN and early-type galaxies could dilute or even reverse the trends predicted by gas-rich mergers or galaxy harassment.
To gain leverage on these issues, it is critical to improve on the range of environments probed by past studies. We are continuing a program that measures the AGN fraction with environment, probing cluster environments for these indirect signatures of AGN fueling mechanisms. To identify the AGN we use X-ray observations. Galaxy studies in the nearby Universe (e.g., Grimm et al. 2003; Kim & Fabbiano 2004; Sun et al. 2007) indicate that contributions from the other potential sources of luminous X-ray emission besides an AGN, namely X-ray binaries and the hot interstellar medium (ISM), only exceed X-ray luminosities of for the most massive or massively star-forming galaxies. Thus, AGN can be identified down to relatively low X-ray luminosities by considering galactic parameters such as their optical luminosity and star formation rate. In addition, X-ray observations can identify AGN that lack obvious spectral signatures in visible wavelength spectra. Such signatures could potentially be absent due to selection effects (e.g., optical dilution of low-luminosity AGN, Martini et al. 2002; Moran et al. 2002), obscuration (e.g., Matt 2002), or different accretion modes (e.g., radiatively inefficient accretion flows that do not produce emission lines, Yuan & Narayan 2004).
In the most detailed study of X-ray AGN in clusters to date, Martini et al. (2006, hereafter M06) studied eight low-redshift () galaxy clusters and found that of bright () cluster galaxies contain AGN with , where is the broad (–) band X-ray luminosity. Most of these X-ray identified AGN lacked obvious AGN spectral signatures in visible wavelength spectra. In this sample, the X-ray AGN were centrally concentrated (Martini et al. 2007, hereafter M07). When fainter X-ray AGN with were included, no central concentration was found, although they had limited sensitivity to radial variations in their more distant clusters. While the increase in AGN fraction of bright X-ray AGN is more consistent with the increased concentration of bright elliptical galaxies outlined above as opposed to predictions from galaxy interactions, it is somewhat surprising that the lower luminosity AGN are not also centrally concentrated under such a model.
While X-ray AGN fractions in nearby clusters have been previously measured, past observations have concentrated on the cores of clusters. In Martini et al. (2007, hereafter M07), 90% of the galaxies were within , where is the physical radius within which the mean density of a virialized cluster exceeds the critical density at that redshift by a factor of 200. The outskirts of clusters, and their different environment, are relatively unexplored. This highlights the value for X-ray observations that can identify X-ray AGN beyond the cores of clusters. Nearby clusters allow the most sensitive measurements at both visible and X-ray wavelengths. But such observations must be made over wide fields-of-view (FOVs) to cover the entire cluster. With its superb spatial resolution, the Chandra X-ray Observatory is ideal for detecting a central AGN; however, its widest FOV (using the ACIS-I detectors) is only . For nearby clusters, this does not provide adequate coverage out to .
To attain the best measurements on the radial distribution of AGN for comparison to the opposing predictions, we undertook wide-field Chandra observations of two clusters, Abell 85 and Abell 754. In X-rays, both Abell 85 (Kempner et al. 2002; Durret et al. 2005) and Abell 754 (e.g., Markevitch et al. 2003) show evidence of recent mergers of multiple components; both clusters show evidence of cold fronts in their intracluster medium (ICM). In particular, Abell 754 is often used as a prototype of a major cluster - cluster merger, with the peak of its X-ray emission well offset from the major galaxy clumps identified by optical data (Zabludoff & Zaritsky 1995), while there is no such offset in Abell 85, where smaller structures appear to be falling on to the major component of Abell 85 (Durret et al. 1998). Both clusters already have detailed optical spectroscopy (Christlein & Zabludoff 2003, hereafter CZ03) that established cluster membership and measured other spectral properties. We present the analysis of these observations in § 2. We add these clusters and Abell 89B, an additional cluster in the Abell 85 FOV, to three clusters from the M06 study to form a sample of clusters in § 3. In § 4, we detail the identification of sources as X-ray AGN and spectroscopically identified AGN, and compare their properties (photometric and radial distribution) to the underlying cluster population. We present the dependence of AGN fraction on velocity dispersion and redshift in § 5. Finally, we discuss our conclusions in § 6. All errors presented indicate the double-sided confidence interval111We note that previous error bars on the AGN fraction presented single-sided confidence intervals, which are slightly larger (\al@MKK+2006,MMK2007; \al@MKK+2006,MMK2007).. Throughout this paper we assume that the cosmological parameters are , where . All absolute magnitudes and luminosities are presented in their rest-frame.
2. Chandra Observations
| Field | OBSID | Date | T | |
|---|---|---|---|---|
| (ks) | () | |||
| (1) | (2) | (3) | (4) | (5) |
| Abell 85-C | 0904 (catalog ADS/Sa.CXO#obs/00904) | 2000-08-19 | 38.4 | |
| Abell 85-SE | 4881 (catalog ADS/Sa.CXO#obs/04881) | 2004-09-03 | 9.8 | |
| Abell 85-S | 4882 (catalog ADS/Sa.CXO#obs/04882) | 2004-09-03 | 9.6 | |
| Abell 85-SW | 4883 (catalog ADS/Sa.CXO#obs/04883) | 2004-09-03 | 9.6 | |
| Abell 85-E | 4884 (catalog ADS/Sa.CXO#obs/04884) | 2004-09-03 | 9.6 | |
| Abell 85-W | 4885 (catalog ADS/Sa.CXO#obs/04885) | 2004-09-03 | 9.6 | |
| Abell 85-NE | 4886 (catalog ADS/Sa.CXO#obs/04886) | 2004-09-03 | 9.6 | |
| Abell 85-N | 4887 (catalog ADS/Sa.CXO#obs/04887) | 2004-09-04 | 10.1 | |
| Abell 85-NW | 4888 (catalog ADS/Sa.CXO#obs/04888) | 2004-09-04 | 9.6 | |
| Abell 754-C | 0507 (catalog ADS/Sa.CXO#obs/00507) | 1999-10-30 | 29.8 | |
| Abell 754-SE | 6793 (catalog ADS/Sa.CXO#obs/06793) | 2006-01-18 | 9.9 | |
| Abell 754-S | 6794 (catalog ADS/Sa.CXO#obs/06794) | 2006-01-27 | 9.9 | |
| Abell 754-SW | 6795 (catalog ADS/Sa.CXO#obs/06795) | 2006-01-28 | 9.6 | |
| Abell 754-E | 6796 (catalog ADS/Sa.CXO#obs/06796) | 2006-01-18 | 9.6 | |
| Abell 754-W | 6797 (catalog ADS/Sa.CXO#obs/06797) | 2006-01-25 | 10.0 | |
| Abell 754-NE | 6798 (catalog ADS/Sa.CXO#obs/06798) | 2006-01-28 | 10.0 | |
| Abell 754-N | 6799 (catalog ADS/Sa.CXO#obs/06799) | 2006-01-28 | 9.6 | |
| Abell 754-NW | 6800 (catalog ADS/Sa.CXO#obs/06800) | 2006-02-15 | 10.2 |
Note. — Chandra ACIS-I Observation Log. Columns are: (1) Field targeted; (2) Observation ID of Chandra data; (3) Observation date; (4) Usable exposure; (5) Estimate of the – luminosity limit of the observation for a galaxy.
2.1. Data Reduction
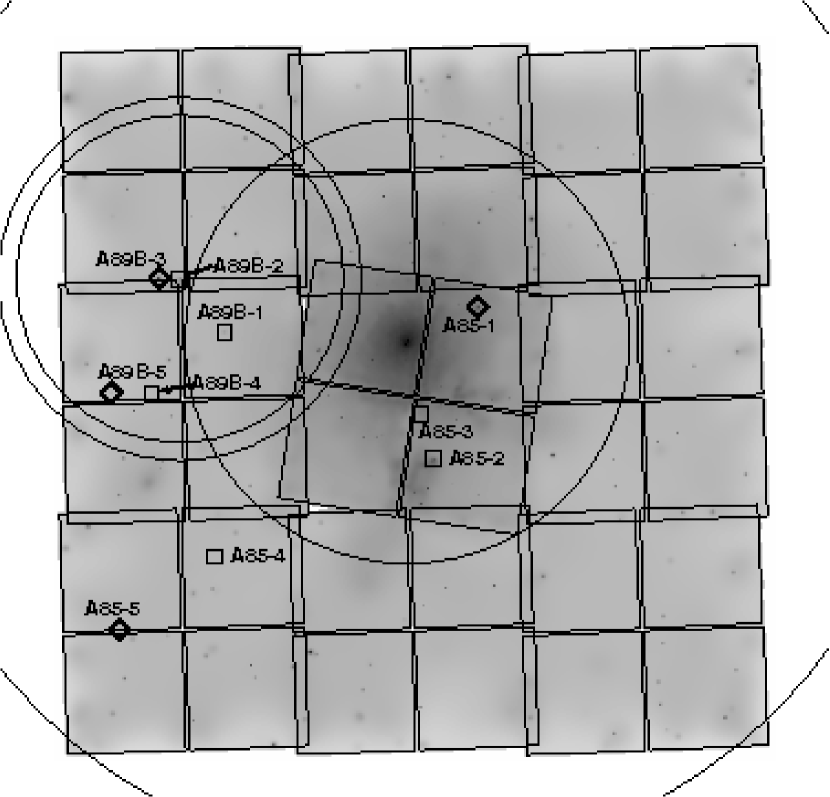
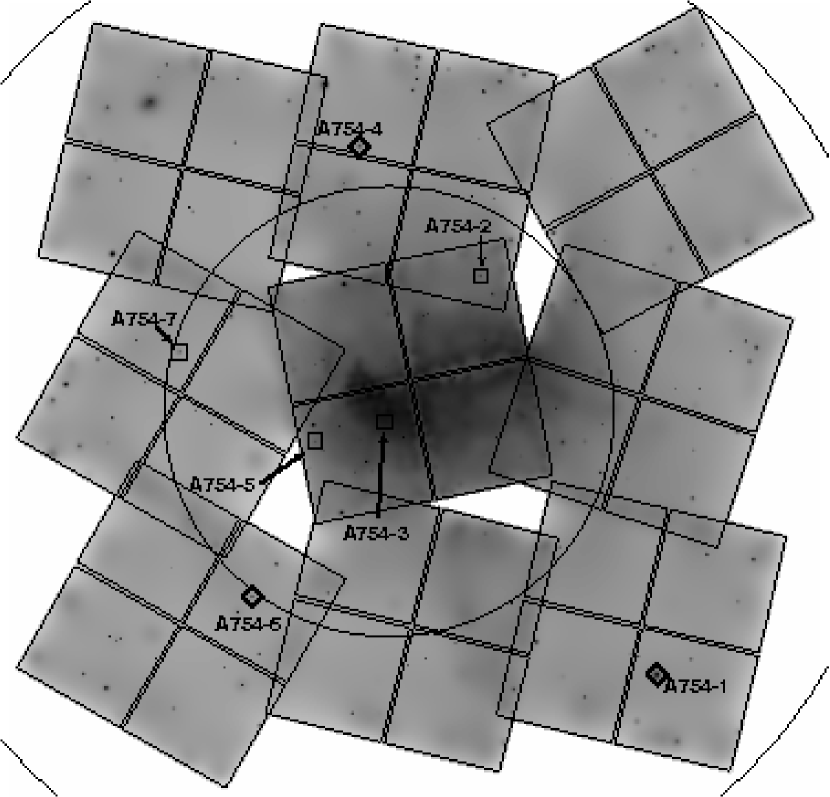
For both Abell 85 (Figure 1) and Abell 754 (Figure 2), our wide-field Chandra ACIS-I observations consist of a central archival field flanked by eight new, fields. We list these observations in Table 1.
We reduced all data as uniformly as possible using ciao 3.4222See http://asc.harvard.edu/ciao/. with caldb 3.3.0.1 and NASA’s ftools 6.0333See http://heasarc.gsfc.nasa.gov/docs/software/lheasoft/.. Since these observations represent a combination of archival and new observations spanning over 6 years, there were minor differences in their reduction. For Observations 0577, 0944, and 4881-4888, the frame times were , while for Observations 6793-6800, the frame times were . Both Observation 0577 and 0944 were telemetered and cleaned in Faint mode. The new observations were telemetered and cleaned in Very-Faint mode, which leads to a reduced background. Observation 0577 was operated at , while the remaining observations were operated at . Thus for Observation 0577, no corrections were made for time dependence of the gain or the charge-transfer inefficiency and photon energies were determined using the gain file acisD1999-09-16gainN0005.fits. The other observations were all corrected for the time dependence of the gain and the charge-transfer inefficiency with their photon energies determined using the gain file acisD2000-01-29gainctiN0006.fits. For Observation 0577 and 0944, we recreated bad pixel files using the newest tools to detect hot pixels and cosmic ray afterglows. For all observations, we only consider events with ASCA grades of 0, 2, 3, 4, and 6 detected by ACIS-I. Known aspect offsets were applied for each observation. All observations were corrected for quantum efficiency degradation and had exposure maps determined at . We excluded bad pixels, bad columns, and columns adjacent to bad columns or chip node boundaries.
Since we use local backgrounds and small extraction regions to analyze point sources, this analysis is not very sensitive to the periods of high background (“background flares”) that Chandra may encounter. To avoid periods with extreme flaring, we excluded times where the blank-sky rate was more than three times the expected blank-sky rate derived from calibrated blank-sky backgrounds. We only removed from Observation 0507. Final flare-filtered live exposure times for the five observations are listed in Table 1.
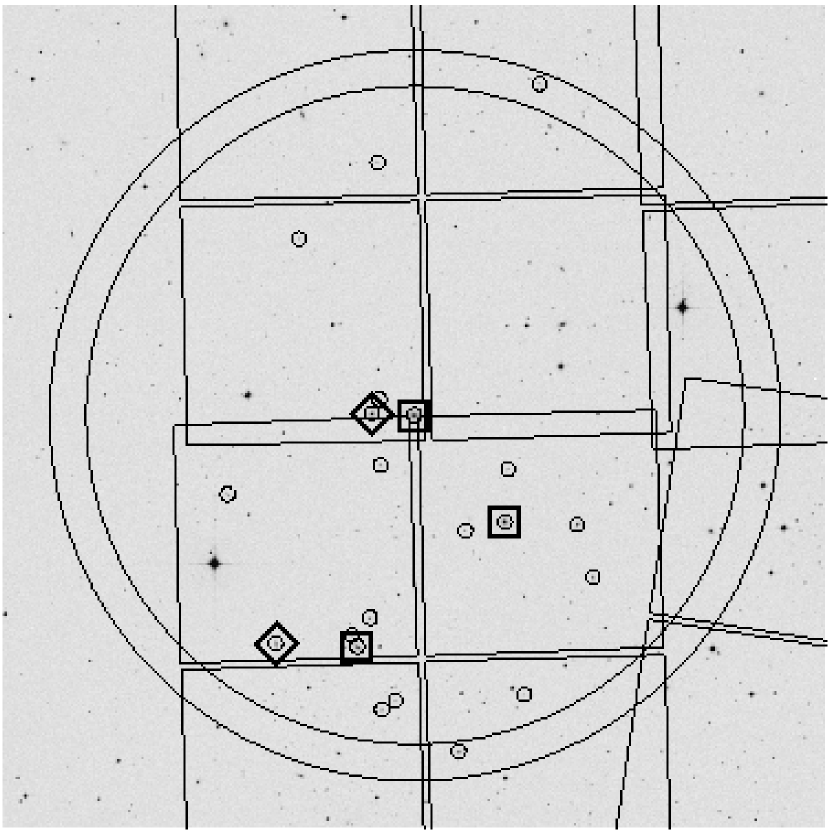
In Figures 1 and 2, we display the adaptively smoothed, exposure-corrected Chandra X-ray image of both fields using a minimum signal-to-noise ratio (S/N) per smoothing beam of 3. The FOVs of the individual observations are overlaid. Both clusters have ICM in the central archival field; however, only a little diffuse gas extends into the flanking fields. There are point sources seen in these images; however, most are unassociated with the clusters. On these figures we also display the radii corresponding to and . Abell 85 has nearly complete coverage to and partial coverage out to just beyond . Although the coverage for Abell 754 is similar, there are more holes due to the unmatched roll angles of the observations. The Abell 85 fields also provide coverage for two other nearby large-scale structures, Abell 89B and Abell 89C (Durret et al. 1998). We include Abell 89B in this analysis, the less distant and richer of the two structures. Our Chandra data covers most of Abell 89B to its radius (Figure 3). Abell 89C is not included as our sample of galaxies is incomplete at its redshift () and we were unable to self-consistently identify group members using the redshift and positions of candidate members (See § 3).
2.2. Source Detection and Analysis
For each observation, we applied the wavelet detection algorithm (ciao wavdetect program) with scales ranging from 1 to 64 pixels in steps of factors, requiring a source detection threshold of to identify discrete X-ray sources that are potential X-ray AGN in these clusters. Source detection was not performed in regions with an exposure of less than 10% of the total for the observation. The numbers of total detected X-ray sources are 350 and 365 in Abell 85 and Abell 754, respectively, with only a few sources multiply detected where the FOVs overlap. Our source detection threshold corresponds to falsely detected X-ray sources (due to a statistical fluctuation) for each observation.
There are two potential ways an X-ray source could be incorrectly associated with an optical source: First, an associated X-ray detection could be a false detection. Second, the positions from an X-ray detected source and an optical counterpart could randomly overlap. The magnitude of both effects depends on the number of optical sources and the matching radius used to associate X-ray and optical sources. There are 172, 21, and 270 optical members of Abell 85, Abell 89B, and Abell 754, respectively, from CZ03 in the Chandra FOVs, and 50, 4, and 10 additional members from other sources. We first considered a very generous matching radius for identifying potential X-ray emitting galaxies. This radius is large due to a uncertainty in the position of optical sources from fiber positioning (CZ03) and potential poor localization of the X-ray position due to low-count X-ray data. At this radius, we expect and false associations in the Abell 85 and Abell 754 FOVs, respectively, due to statistical fluctuations above our source detection threshold. By replacing the source detection threshold with the average number of real X-ray sources per pixel, we can calculate the number of false associations due to random overlap. We estimate and false associations in the Abell 85 and Abell 754 FOVs, respectively, from randomly overlapping sources. Since X-ray AGN must be at the galaxy centers of cluster members, we apply a stricter requirement ( offset from the 2MASS galaxy position) in § 4 to classify a source as an X-ray AGN. Thus, we estimate the expected number of optical galaxies falsely identified as X-ray AGN is per cluster FOV. In addition, this expected number drops by a factor of two if we only consider galaxies with .
| ID | CXOU XID | CZ2003 ID | 2MASX ID | Offset | Net Counts | |
|---|---|---|---|---|---|---|
| (1) | (2) | (3) | (4) | (5) | (6) | (7) |
| A85-1 | J004130.2091546 | 85A_993[6] | J004130320915459 | () | ||
| A85-2 | J004142.9092621 | 85A_993[13] | J004143020926219 | () | ||
| A85-3 | J004146.7092313 | 85A_993[12] | J004146810923129 | () | ||
| A85-4 | J004244.7093312 | 85A_993[86] | J004244700933162 | () | ||
| A85-5 | J004311.5093816 | 85A_993[47] | J004311620938163 | () | ||
| A89B-1 | J004242.0091731 | 85A_993[80] | J004241930917312 | () | ||
| A89B-2 | J004254.8091349 | 85A_993[81] | J004254660913493 | () | ||
| A89B-3 | J004300.6091346 | 85A_993[57] | J004300670913463 | () | ||
| A89B-4 | J004302.7092151 | 85A_993[59] | J004302700921513 | () | ||
| A89B-5 | J004314.0092144 | 85A_993[60] | J004314180921453 | () | ||
| A754-1 | J090802.1095937 | 754A_494[25] | J090802170959378 | () | aaX-ray analysis affected by pileup. The luminosity correction factor of is uncertain to . | |
| A754-2 | J090852.2093149 | 754A_494[100] | J090852290931507 | () | ||
| A754-3 | J090919.2094159 | 754A_494[9] | J090919230941591 | () | ||
| A754-4 | J090926.3092247 | 754A_494[93] | J090926330922471 | () | ||
| A754-5 | J090939.0094321 | 754A_494[106] | J090939130943233 | () | ||
| A754-6 | J090956.8095409 | 754A_393[55] | J090956850954093 | () | ||
| A754-7 | J091017.3093707 | 754A_494[76] | J091017370937068 | () |
Note. — X-ray Measurements. Columns are: (1) ID used in this paper; (2) X-ray object ID; (3) ID from CZ03; (4) 2MASS Extended Source Catalog ID of counterpart; (5) Offset between X-ray and near-IR position with the an estimate of the statistical uncertainty of the X-ray position in the parentheses; (6) Net X-ray counts detected in observed frame – band with exact Gehrel’s errors Gehrels (1986); (7) X-ray luminosity in rest frame – band in units of . The X-ray luminosity was calculated assuming a power-law with corrections for Galactic absorption and the enclosed fraction of the PSF used to extract the counts.
We used the coordinate list generated by wavdetect and the positions of optical galaxies from CZ03 to identify X-ray detections within of optical counterparts. Due to the sensitivity of the flanking field observations, we only considered detections and optical galaxies in regions where the local exposure was at least half of the maximum exposure; this eliminates the edges of the ACIS-I chips and the gaps between them. To determine cluster membership, we adopted the velocity range in Christlein & Zabludoff (2003) for Abell 85 and Abell 754. For Abell 89B, we determined its cluster properties ourselves (see § 3). We found no additional matches when we added additional cluster members from the NASA/IPAC Extragalactic Database (NED). In Table 2, we list the 17 detections that correspond to a galaxy in Abell 85, Abell 89B, or Abell 754. These galaxies are also indicated in Figures 1 and 2. We label the sources in RA order by cluster and list their X-ray position and optical counterpart from CZ03. For each optical counterpart, we adopted the 2MASS position in the Extended Source Catalog (Skrutskie et al. 2006), and recalculated the offset between the X-ray detection and the galaxy center. Using Kim et al. (2007), we have estimated the X-ray positional uncertainty (1) due to wavdetect. Our first criteria for an X-ray AGN is that the offset between the X-ray detection and the galaxy is less than , consistent with that used in M06. Since all three detections that fail this criterion have positional uncertainty, they are still likely associated with the identified galaxies. We have excluded a detection consistent with the brightest cluster galaxy (BCG) of Abell 85, as this detection also corresponds to the peak in the X-ray flux from ICM. We also note that a detection corresponding to an Abell 85 member that is likely an X-ray AGN with (2MASX J00415019-0925469) was excluded since it fell in a chip gap of Observation 0904 and the photometry is therefore highly uncertain.
| Cluster | , | Reference | |||||
|---|---|---|---|---|---|---|---|
| (1) | (2) | (3) | (4) | (5) | (6) | (7) | (8) |
| Abell 85 | 00:41:50.4 | :18:11 | 0.0554 | 0.0448,0.0658 | 993 (85) | 2.4 | 1 |
| Abell 89B | 00:42:54.6 | :13:50 | 0.077 | 0.0692,0.0850 | 474 (155) | 1.1 | 2 |
| Abell 3125 | 03:25:17.9 | :29:37 | 0.0616 | 0.0530,0.0700 | 475 (94) | 1.1 | 3 |
| Abell 3128 | 03:30:43.8 | :31:30 | 0.0595 | 0.0435,0.0755 | 906 (74) | 2.1 | 3 |
| Abell 754 | 09:09:18.0 | :41:17 | 0.0546 | 0.0446,0.0632 | 953 (64) | 2.3 | 1 |
| Abell 644 | 08:17:25.6 | :30:45 | 0.0701 | 0.0531,0.0871 | 952 (382) | 2.2 | 3 |
Note. — Sample of clusters with X-ray identified AGN. Columns are: (1) Cluster name; (2 and 3) RA and DEC of the cluster center for epoch J2000; (4) Redshift; (5) Redshift range of cluster members; (6) Velocity dispersion and uncertainty (90%); (7) in Mpc; (8) Reference for velocity information.
For all detections in Table 2, we used ACIS Extract 3.131 to create source extraction regions enclosing 90% of the flux in the X-ray PSF and to determine a masking radius that encircled 97% of the flux. For most of the sources, whose photons had median energies of –, we determined the regions assuming the PSF at . Since the events for A754-6 had a median energy of , we used the PSF determined at . For each source, we created background regions just beyond the masking radius with an area five times that of the source extraction region. Column (6) of Table 2 indicates the net counts for each source in the – band, with proper Poisson errors (Gehrels 1986). To estimate the rest-frame – X-ray luminosity, column (7), we folded a power-law spectrum with absorbed by the Galactic column ( for Abell 85 and Abell 89B; for Abell 754) through the spectral response at the location of each source. We set the model normalization using xspec33footnotemark: 3 to match the observed net counts, corrected for the mean redshift of the cluster and the enclosed fraction of the flux in the source extraction region.
We note that A754-1 is bright enough that it suffers from events lost to pileup. At counts per frame, pileup can be relatively minor and require only a small correction or pileup can be more severe and require a larger correction. Since there is no readout-streak and the source is shaped like the PSF, the branch with less pileup is more likely correct. Therefore, the luminosity in Table 2 has been corrected assuming that our spectral model has been affected by pileup with a typical grade-migration parameter, (Davis 2001). We estimate that the correction factor of is accurate to a factor of . If the source is more extremely effected by pileup, this will only increase its X-ray luminosity.
By combining the luminosities and counts from Table 2 with our exposure maps, we estimated the limiting X-ray luminosity for each observation. This is listed in Table 1 assuming a redshift of near that of Abell 85 and Abell 754. For the more distant Abell 89B, the limiting luminosity is a factor of two higher. For consistency with M06, we have calculated this number corresponding to five counts on-axis. However, we caution that this limit is optimistic over an entire ACIS-I FOV for two reasons. First, at the spatial structure to the quantum efficiency degradation leads to 15% lower exposure at approximately off-axis in the latest observations. More importantly, the larger off-axis PSF makes detection of weak sources more difficult. Kim & Fabbiano (2003) show that at and off-axis, 70% completeness can be expected for 7 and 11 counts sources respectively. We estimate that completeness limits over the entire ACIS-I FOV are about a factor of four higher than reported in Table 1 of M06 and Table 2 of this work. This means that the AGN fraction above may be underestimated; however, we estimate that this is a smaller effect than the current error due to the small numbers of AGN.
3. Cluster Sample
We required a sample large enough to statistically test which galaxy and cluster properties lead to X-ray AGN activity. This is especially important as not all detected X-ray sources will be X-ray AGN. To supplement the sample of 17 potential X-ray AGN in Abell 85, Abell 89B, and Abell 754, we have also included three other clusters with X-ray identified AGN, Abell 644, Abell 3125, and Abell 3128 (\al@MKK+2006,MMK2007; \al@MKK+2006,MMK2007). We list the cluster properties in Table 2.2, adopting the M07 values for the latter three clusters.
In columns (2) and (3) , we list the cluster positions. For Abell 85 and Abell 754, we adopted the peak of the ICM as the cluster position. The BCG of Abell 85 is coincident with this peak. In Abell 754, the third brightest galaxy (in -band), A754-3, is embedded in the ICM away from this position. This galaxy is located near one of the concentrations of Abell 754 member galaxies.
We list the mean cluster redshift, redshift range of cluster members, and velocity dispersion, with 90% confidence limit, in columns (4)–(6). We adopted the values of CZ03 for Abell 85 and Abell 754; however, we increased their uncertainties in velocity dispersion by a factor of 1.6 to match our confidence limits. For Abell 89B, the Christlein & Zabludoff (2003) data suggested that its members were in the range. We calculated membership via the biweight estimator for center and scale, following M07, adding additional nearby galaxies with velocity data in the NED to the CZ03 sample. We iteratively determined 29 galaxies were within 5 of the cluster mean velocity and the , assuming the BCG was the center of the cluster. Of the 29 galaxies, our FOV overlapped with 25. We used the jackknife of the biweight estimator to determine the 90% confidence limit for the velocity dispersion. The symmetric confidence limit (eq. 22 of Beers et al. 1990) was chosen for consistency with \al@MKK+2006,MMK2007; \al@MKK+2006,MMK2007.
To characterize the extent of the clusters and best compare the spatial distributions of cluster AGN, we determined the of each cluster following equation A1 of Treu et al. (2003). These are listed in column (7).
4. Galaxy Properties of X-ray Sources
4.1. X-ray AGN Identification
Near the luminosity limits of these observations, there are three potential sources of X-ray emission: X-ray binaries, hot ISM, and a central AGN (e.g., Sivakoff et al. 2003, 2004). X-ray binaries with low-mass companions (LMXBs) are sensitive to the total stellar mass of a galaxy, while X-ray binaries with high-mass companions (HMXBs) are sensitive to recent star formation (Grimm et al. 2003; Kim & Fabbiano 2004). From a sample of fourteen nearby galaxies, Kim & Fabbiano (2004) derived a (linear) relation between the total X-ray luminosity of LMXBs within the galaxy and the -band or -band luminosity. We prefer the latter relation as -band is a better tracer of stellar mass, and the relation has a smaller dispersion;
| (1) |
where is the -band luminosity within the isophote, assuming . We caution that most of these galaxies in this archival sample were originally targeted due to their X-ray properties. These galaxies are roughly divided into X-ray bright galaxies, galaxies with significantly higher X-ray to optical flux ratios that are dominated by the diffuse gas, and X-ray faint galaxies, galaxies with lower X-ray to optical flux ratios that are dominated by the X-ray binaries. The X-ray bright galaxies should be relatively free from a bias on the total LMXB X-ray luminosities in these systems. As studying LMXBs was often the primary science driver for targeting the X-ray faint galaxies, these galaxies were often selected based on their X-ray luminosities or X-ray to optical flux ratios. Due to such selection criteria, X-ray faint galaxies whose X-ray luminosities are towards the lower-end of the intrinsic relation between X-ray luminosity from LMXBs and stellar mass are less likely to be targeted by observers. Thus, the above relation may overestimate the intrinsic relation. To estimate the X-ray luminosity from HMXBs, the star-formation rate (SFR) is needed. Assuming a X-ray spectrum, we can convert the relation found in Grimm et al. (2003) to a , such that
| (2) |
Since the ISM is thought to have a stellar origin, a rough correspondence with stellar mass is expected; however, at a given stellar mass there is a wide-range of ISM luminosities and the relation to stellar mass is known to be non-linear. We adopt the Sun et al. (2007) relation
| (3) |
where the soft (–) band X-ray luminosity, is calculated assuming an ISM spectral model and is the total -band luminosity. This relation is derived including the effects of upper limits for non-detections of the ISM. For the galaxies in our cluster sample, we have estimated that and that the for a power-law is times the for gas with 0.8 solar abundance when requiring that the observed – count-rates match. Note that applying just a luminosity cut of to identify AGN can be contaminated by galaxies without AGN if either or .
| ID | Ref. | |||
|---|---|---|---|---|
| (1) | (2) | (3) | (4) | (5) |
| A85-1aaGalaxy selected as X-ray AGN. | 14.32 | 1 | ||
| A85-2 | 14.43 | 1 | ||
| A85-3 | 15.86 | 1 | ||
| A85-4 | 14.81 | 1 | ||
| A85-5 aaGalaxy selected as X-ray AGN. | 15.03 | 1 | ||
| A89B-1 | 14.18 | 1 | ||
| A89B-2 | 15.03 | 1 | ||
| A89B-3aaGalaxy selected as X-ray AGN. | 15.17 | 1 | ||
| A89B-4 | 14.92 | 1 | ||
| A89B-5aaGalaxy selected as X-ray AGN. | 14.09 | 1 | ||
| A754-1aaGalaxy selected as X-ray AGN. | 14.40 | 1 | ||
| A754-2 | 14.60 | 1 | ||
| A754-3 | 14.05 | 1 | ||
| A754-4aaGalaxy selected as X-ray AGN. | 14.24 | 1 | ||
| A754-5 | 14.28 | 1 | ||
| A754-6aaGalaxy selected as X-ray AGN. | 15.84 | 1 | ||
| A754-7 | 13.93 | 1 | ||
| A3125-1aaGalaxy selected as X-ray AGN. | 15.77 | 2 | ||
| A3125-2 | 14.93 | 2 | ||
| A3125-3 | 15.24 | 2 | ||
| A3125-4 | 15.16 | 2 | ||
| A3125-5aaGalaxy selected as X-ray AGN. | 15.97 | 2 | ||
| A3125-6aaGalaxy selected as X-ray AGN. | 14.97 | 3 | ||
| A3128-1 | 15.24 | 2 | ||
| A3128-2aaGalaxy selected as X-ray AGN. | 17.17 | 2 | ||
| A3128-3 | 16.21 | 4 | ||
| A3128-4aaGalaxy selected as X-ray AGN. | 14.81 | 2 | ||
| A3128-5 | 15.65 | 5 | ||
| A3128-6aaGalaxy selected as X-ray AGN. | 16.82 | 2 | ||
| A3128-7 | 15.01 | 2 | ||
| A3128-8 | 15.28 | 2 | ||
| A3128-9aaGalaxy selected as X-ray AGN. | 16.41 | 2 | ||
| A3128-10 | 14.60 | 2 | ||
| A644-1aaGalaxy selected as X-ray AGN. | 16.63 | 2 | ||
| A644-2aaGalaxy selected as X-ray AGN. | 15.90 | 2 |
Note. — Optical/Near-IR Measurements of X-ray Identified Galaxies in Six Clusters. Columns are: (1) ID from this paper or M06; (2) Observed -band magnitude; (3) Extinction corrected rest-frame absolute -band magnitude; (4) Extinction corrected rest-frame absolute -band magnitude within the isophote; (5) Reference for -band magnitude
In Table 4.1, we list the optical/near-IR magnitudes for galaxies in our sample of clusters. In column (2), we list the observed -band magnitude. We list the references for these magnitudes in column (5). The absolute -band magnitude, including extinction corrections (; Schlegel et al. 1998), are listed in column (3), assuming a distance corresponding to the mean redshift of each cluster. As in Martini et al. (2006), we applied corrections for bandpass shifting and stellar evolution based on a simple stellar population model with solar metallicity and formation redshift of (Bruzual & Charlot 2003). At these redshifts the corrections to the -band magnitudes are small (0.06–0.08). All X-ray sources are in galaxies with . For comparison, we note that the knee of local galaxy luminosity functions occurs at (CZ03). In column (4), we list the absolute -band magnitude with extinction corrections (; Majewski et al. 2003), where we have used the 2MASS magnitude within the isophote (Skrutskie et al. 2006). The correction for bandpass shifting and stellar evolution to the -band magnitudes are larger (0.24–0.32) than those applied to the -band magnitudes. While we do not have robustly measured SFR for these galaxies, we place rough limits on the SFR in § 4.3.
In Figure 4, we plot the X-ray luminosity versus the -band luminosity for galaxies in our cluster sample. The errors for the X-ray luminosity are calculated from the errors in the count-rates alone, except for A754-1 whose errors arise from uncertainty in the pileup correction. To estimate the near-IR luminosity for the two galaxies that were not in the 2MASS Extended Source Catalog, we used the relation between the standard aperture magnitude in the Point Source Catalog and the -band isophotal magnitude for the other galaxies. These two galaxies are indicated with their larger dashed error bars. Galaxies with X-ray luminosities newly measured by this paper are indicated with filled symbols in Figure 4. We overlay the ranges of the Kim & Fabbiano (2004) and Sun et al. (2007) relations after correcting the latter to isophotal optical luminosities and assuming a power-law. The solid line indicates the sum of the upper limits from both relations.
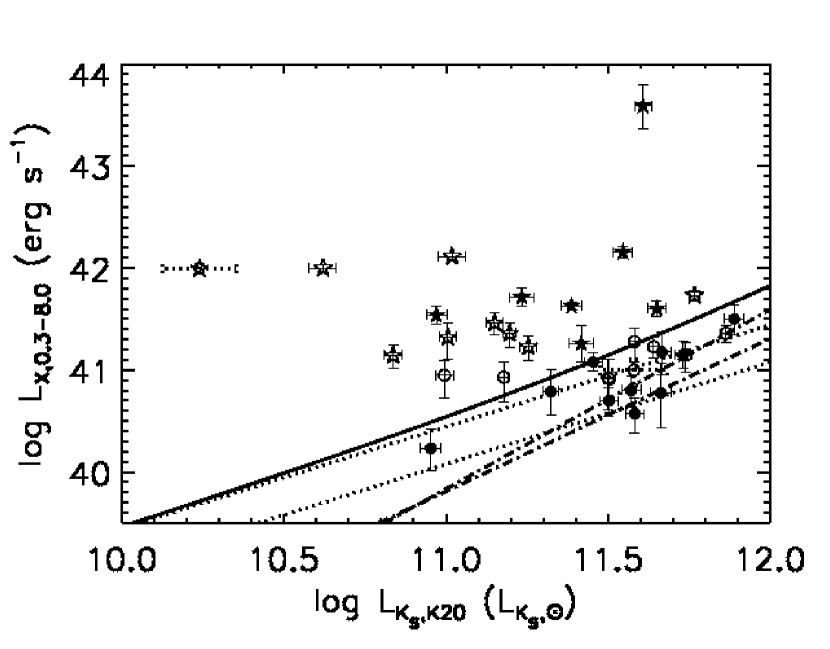
We classify a galaxy as an X-ray AGN if the following conditions are met: , more than higher than the sum of the upper limits to the Kim & Fabbiano (2004) and Sun et al. (2007) relations, and an optical counterpart within . These galaxies are indicated by a note in Table 4.1 and with a star in Figure 4. One source is marginally above the sum of the upper limits to the Kim & Fabbiano (2004) and Sun et al. (2007) relations, A89B-5; all other sources are above the sum of the upper limits of the relations. Since our X-ray luminosity is derived for a point-source, and not the entire galaxy, we note that the total galaxy X-ray luminosity will be even larger than that in Figure 4 if there is a contribution from the extended emission of the distribution of LMXBs or ISM. Thus, the only likely contaminating sources in this sample of X-ray AGN are galaxies with . We argue below that such contamination does not seem likely for our sample. We also note that A3128-3 is an X-ray AGN if we do not impose an X-ray luminosity cut, i.e., it has a close optical counterpart, is above the sum of the LMXB and ISM relations, but has .
Although one could consider adding additional requirements to classify a source as an X-ray AGN based on its X-ray data, in particular estimates of its spectrum (e.g., through hardness ratios or quantiles) and spatial decomposition into a point source and extended galactic emission, the quality of the data for the lower luminosity sources is insufficient. First, only 20% of the X-ray detected galaxies have more than 50 counts. There would be little to no discriminating power for the vast majority of our sample. Second, it is unclear that a spectral selection using hardness ratios or quantiles is appropriate. M06 found that the spectroscopically identified AGNs were those least consistent with unobscured, , power-law emission. While one might hope to discriminate the soft emission of diffuse gas from harder power-law emission, some AGNs have ultrasoft spectra, that corresponds to steep power-law photon indices, (Puchnarewicz et al. 1992). This highlights the need for deep enough observations where spectral modeling can be done to detect the iron L-shell hump characteristic of diffuse gas (e.g., Sun et al. 2007). Since most of our X-ray detected galaxies have less than 50 counts, spatial decomposition of the X-ray emission would also not be useful for the vast majority of galaxies in our sample.
Based on Kim & Fabbiano (2003), we estimate that the completeness limits over the entire ACIS-I FOV is approximately four times the X-ray luminosity in Table 1 of M06 and Table 2 of this work. This suggests that the central observation of Abell 85 and Abell 754 are incomplete at , while the flanking field observations are incomplete for . Since Abell 89B is in flanking field observations of Abell 85 and is more distant, it is incomplete for . Abell 644 and Abell 3128 are incomplete for , while Abell 3125 is incomplete for . Although there is a gap between and the completeness limits in some areas of the clusters, we estimate that the completeness in this gap is above 50%. Since only one X-ray AGN is detected in the gap between and its completeness limit, A89B-5, we estimate that we are not likely to be missing more than one or two X-ray AGN due to incompleteness.
4.2. Spectroscopically Identified AGN in Abell 85, Abell 89B, and Abell 754
| ID | EW [O II] | EW [O III] | EW H |
|---|---|---|---|
| (1) | (2) | (3) | (4) |
| A85-1 | |||
| A85-2 | |||
| A85-3 | |||
| A85-4 | |||
| A85-5 | |||
| A89B-1 | |||
| A89B-2 | |||
| A89B-3 | |||
| A89B-4 | |||
| A89B-5 | |||
| A754-1 | |||
| A754-2 | |||
| A754-3 | |||
| A754-4 | |||
| A754-5 | |||
| A754-6 |
Note. — Optical Spectral Properties of X-ray Identified Galaxies in Abell 85, Abell 89B, and Abell 754. Columns are: (1) ID from this paper; (2) Equivalent width of [O II] emission; (3) Equivalent width of [O III] emission; (4) Equivalent width of H emission without correction for absorption. Abell 754-7 is not included due to its spectrum having low signal-to-noise.
In addition to measuring the redshifts of galaxies in Abell 85, Abell 89B, and Abell 754, the spectroscopy described in CZ03 and Christlein & Zabludoff (2005) yielded measurements of the equivalent widths of the [O II] doublet, [O III] , and H emission lines. The last is not corrected for any H absorption. These emission lines can be indicative of ionization from an AGN and/or current, unobscured star-formation. These values are listed in Table 5 for X-ray detected galaxies. We used our spectroscopic measurements to check for AGN identifiable by their optical spectra among our X-ray detected galaxies in Abell 85, Abell 89B, and Abell 754. The spectroscopic identification of AGN in our other clusters was previously discussed in M06.
Only three of the X-ray detected galaxies, A85-1, A89B-5, and A754-6, show emission lines detected at . All three galaxies, which are classified as X-ray AGN, have significant detections of [O II] and [O III]; however, none of them have H emission. To conservatively correct for potential absorption, we have added the emission-corrected H absorption equivalent widths of 5 Å found for post-starburst galaxies in the Sloan Digital Sky Survey (C. Tremonti, private communication) to all measurements of H. Both A85-1 and A89B-5 are spectroscopically classified as AGN via the [O III]/H versus [O II]/H diagnostic (Rola et al. 1997; Lamareille et al. 2004);
| (4) |
No other galaxies in the Chandra FOVs of these clusters are spectroscopically identified as AGN with our emission line data. Since A85-1 has been previously identified as a Seyfert galaxy (Durret et al. 2005) and A89B-5 has been classified as a QSO by SDSS (Adelman-McCarthy et al. 2007), their identifications as spectroscopically identified AGN appear secure.
In addition to the galaxies we identify as spectroscopic AGN, two other X-ray detected galaxies have been previously identified as AGN based on their optical spectral properties. A85-2 was identified as a Seyfert 2 (Hewitt & Burbidge 1991); however, we note that the redshift associated with this identification (0.0453) does not match our measured redshift of the galaxy (0.0564). A85-3 was identified as an AGN based on the limit to its [N II]/H ratio (Hornschemeier et al. 2005). Both A85-2 and A85-3 were not identified as X-ray AGN because their low X-ray luminosities () were consistent with emission from their LMXB populations. These sources illustrate that although current X-ray observations allow identification of low-luminosity AGN, some lower-luminosity AGN are still being missed. Another famous example is that the X-ray emission from the core and jet of M87 (e.g., Marshall et al. 2002) would not be luminous enough to be classified as an X-ray AGN with our criteria.
4.3. Star Formation Rates
Since HMXBs associated with star formation may also lead to X-ray emission, it is important to evaluate whether an X-ray detected galaxy has a high SFR. We use optical spectroscopy to constrain the current SFR through the [O II] equivalent width. Rough limits on the SFR for X-ray galaxies can be estimated from detections and limits based on the Infrared Astronomy Satellite IRAS Faint Source Catalog (Moshir et al. 1990). For Abell 85, Abell 89B, Abell 754, and Abell 644, radio fluxes and limits from the NRAO VLA Sky Survey (NVSS, Condon et al. 1998) are also available to constrain the current SFR.
In the absence of an AGN component, the [O II] equivalent width can be used to estimate the SFR that is unobscured,
| (5) |
where is the -band luminosity in solar luminosities (Kennicutt 1992; Barbaro & Poggianti 1997). Among X-ray sources in Abell 644, Abell 3125, and Abell 3128, only A3125-5 and A3128-2 have measurable [O II] emission (M06); however, the implied SFR for both sources is small (). For galaxies in Abell 85, Abell 89B, and Abell 754, we estimate assuming , which is appropriate for cluster X-ray sources with [O II] emission (M06). Among the galaxies with detections of [O II], two have SFR, A85-1 () and A89B-5 (). A85-1 is an Sbc galaxy (Paturel et al. 2003) whose peculiar velocity ( times the velocity dispersion of Abell 85) suggests it is an infalling galaxy towards the edge of the Abell 85 despite its small projected cluster-centric distance (). A89B-5 is also a late type-galaxy (S?; Paturel et al. 2003) at the edge of Abell 89B (). If the [O II] equivalent widths of A85-1 and A89B-5 were indicative of their SFR, then approximately 60% and 40% of their X-ray emission could come from HMXBs. However, our identification of both as spectroscopic AGN suggests their [O II] likely includes a considerable AGN component. This would lead to an overestimate of their SFR and implied HMXB X-ray luminosity.
For galaxies without detections of [O II], we conservatively adopted three times the measurement error of [O II]. We have excluded A754-7 because its spectra had low signal-to-noise. Only one remaining galaxy had a large implied SFR, A89B-2 (). A89B-2 was already excluded as an X-ray AGN due to the expected X-ray emission from diffuse gas and the large offset between the X-ray and optical positions; however, HMXBs could account for 30% of the X-ray emission from A89B-2. From the combined detections and limits on the SFR from [O II], we conclude that unobscured star formation is not likely to be responsible for the X-ray emission used to identify our X-ray AGN.
Since [O II] emission can be obscured, one must also consider wavelengths where obscuration is less of an issue. In the far-infrared (FIR), reradiating dust reveals obscured star formation. If one considers the far-infrared SFR relation (Kennicutt 1998), corrected to the Infrared Astronomy Satellite (IRAS) bands (Calzetti et al. 2000), the obscured SFR can be estimated from
| (6) |
where is calculated from the luminosity distance, , and the the IRAS 60 and 100 m fluxes in Janskys,
| (7) |
Only two of the X-ray detected galaxies are detected by IRAS, A85-1 and A754-6, both X-ray AGN. For A85-1, there are detections at both 60 and 100 m, while A754-6 is only detected at 60 m. Their predicted SFRFIR of about 9 and , respectively imply approximately 20% and of their X-ray emission could come from HMXBs. The hard median X-ray energy of A754-6 suggests that whatever source is emitting X-rays is obscured; an obscured AGN would also reradiate in the FIR. Although some star formation might be ongoing in these two sources, their identification as X-ray AGN appears secure.
Given the typical minimum fluxes of detected sources, and in the IRAS Faint Source Catalog (Moshir et al. 1990), rough upper limits to the SFRFIR of about , , , , , and can be set for FIR undetected galaxies in Abell 754, Abell 85, Abell 3128, Abell 3125, Abell 644, and Abell 89B, respectively. Since a SFR of could account for X-ray luminosities from HMXBs of , current SFR limits from IRAS are too shallow to rule out a 100% HMXB origin of the X-ray emission for three of the X-ray AGN, A89B-5, A644-2, and A3128-9.
In galaxies without a radio AGN, the radio emission at frequencies below tens of GHz can be a direct probe of the current star formation of massive stars (, Condon 1992);
| (8) |
where is the radio luminosity measured at frequency . The X-ray detected galaxies that have NVSS counterparts are A85-1 (), A89B-3 (), A754-1 (), A754-2 (), A754-3 (), A754-4 (), and A754-7 (). Three of the sources, A754-1, A754-4, and A754-7, have multiple NVSS components and have been identified as narrow-angle tail radio AGN (Zhao et al. 1989)444Only one narrow-angle tail candidate in Abell 754, PGC 025746, is undetected in our X-ray observations (Zhao et al. 1989).. As such, they are not suitable for placing limits on the SFR and the extended radio sources unambiguously reveal the presence of AGN. Since the NVSS counterparts to A89B-3 and A754-2 are offset by and , respectively, they too are unlikely to be due to star formation. In fact, catalog results from the higher resolution 1.4 GHz FIRST survey (White et al. 1997) indicates that the A89B-3 is a narrow-angle tail radio AGN, while no FIRST data for A754-2 are available. Only two of the sources have radio emission that could arise from the core of a radio jet or galactic star formation, A85-1 and A754-3. If the radio emission from A85-1 arises from star-formation, its . However, the joint radio and FIR detection allows calculation of its parameter (e.g., Condon et al. 1991; Yun et al. 2001). With , A85-1 is well away from the typical value of for star forming galaxies (Yun et al. 2001), indicative of a radio excess with a likely AGN origin. This suggests its SFR would be lower than what we measure. Given its additional classification as a spectroscopic AGN, its identification as an X-ray AGN seems robust against the effects of star formation. A754-3, whose detection could be consistent with of star formation, was not classified as an X-ray AGN due to its low X-ray luminosity that could be due to LMXBs or diffuse gas. Since A754-3 is an early-type galaxy (E-S0; Paturel et al. 2003) at the center of Abell 754, the radio emission appears more likely to arise from a low-luminosity AGN than from star-formation. If star-formation is ongoing, X-ray emission from HMXBs could also be responsible for the X-ray emission.
With a detection limit of , the 1.4 GHz NRAO VLA Sky Survey (NVSS) can place tighter constraints on the current SFR than the FIR. For sources undetected in the NVSS, upper limits to the SFR of about , , , and can be set for galaxies in Abell 754, Abell 85, Abell 644, and Abell 89B, respectively; Abell 3125 and Abell 3128 are too far south to have been included in the survey. These limits are low enough to rule out a strong HMXB origin of the X-ray emission among our sample of X-ray AGN undetected by NVSS, A85-5 () , A89B-5 (), A644-1 (), A644-2 (), and A754-6 ().
From the combined constraints on star formation in our X-ray detected galaxies, we conclude that star formation is not likely to be responsible for the X-ray emission used to identify our X-ray AGN. We also conclude that there is not strong evidence for more than a few highly star-forming galaxies () in these clusters.
4.4. AGN Fraction and Host Galaxy Magnitude
For and , the X-ray identified AGN fraction, , summing over galaxies in eight clusters was 2.2%, and (M06). Sun et al. (2007) found for clusters. This presents an indication that the optical luminosity of a host galaxy affects whether an X-ray AGN is detected at these X-ray luminosities. In determining these AGN fractions, both samples did not eliminate luminous X-ray galaxies whose emission could actually be due to diffuse gas. This may affect the Sun et al. (2007) X-ray AGN sample more, as half of them were in BCGs, while none of the M06 X-ray AGN were. In the following section, we explore the magnitude dependence of for galaxies in our sample, after applying the relations to select X-ray AGN.
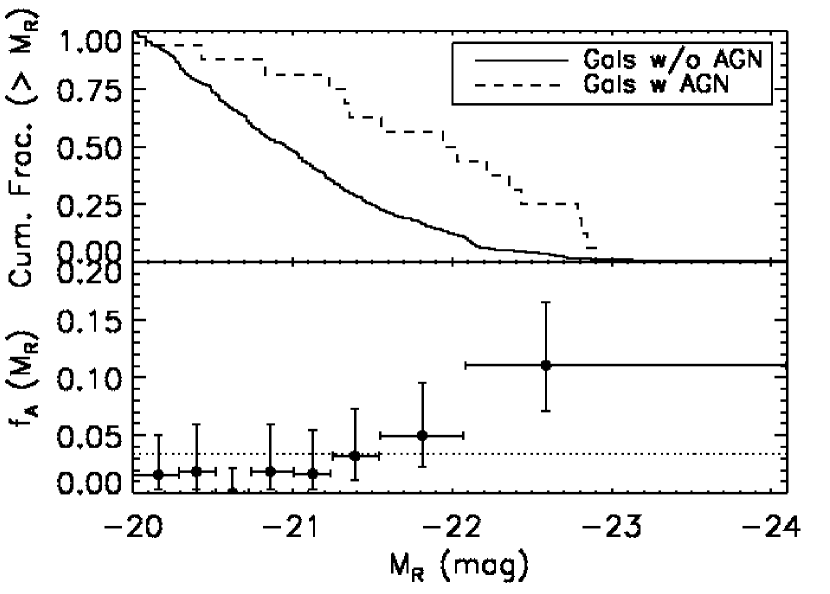
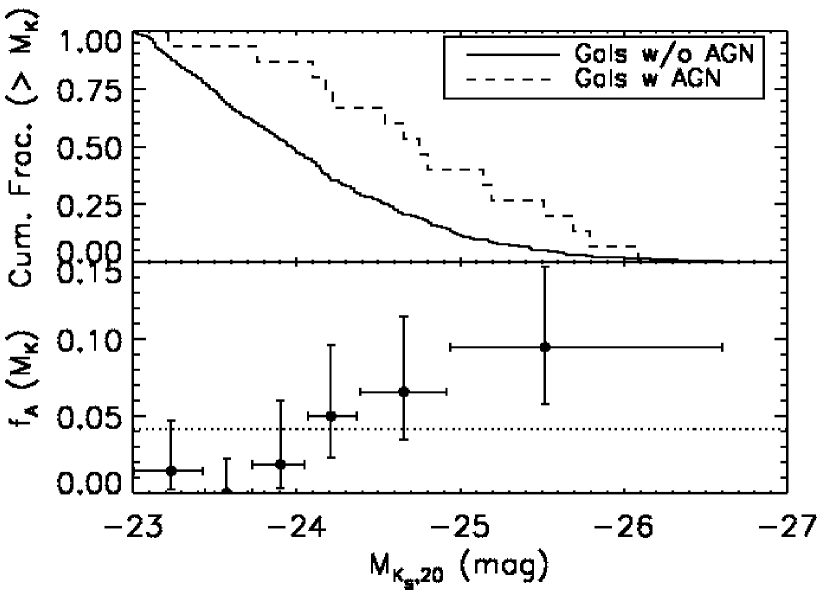
We calculated the extinction-corrected, absolute and rest-frame magnitudes for all available cluster galaxies, as in § 2.2 and Table 4.1. Based on all cluster galaxies with both magnitudes, we find the distribution of rest-frame colors is consistent with a Gaussian distribution centered on 2.82 with a dispersion of 0.26. Since we were unable to determine if the BCG of Abell 85 contained an X-ray AGN, we removed it from the sample. In the top panels of Figure 5, we compare the (left) and (right) distributions of galaxies with AGN (dashed) and without AGN (solid). The distributions are clearly different; KS tests indicate the probabilities they are the same are and , respectively. In the bottom panels of Figure 5, we display in magnitude bins. For the galaxies in Abell 644 and Abell 3125, we applied a correction ( and 1.4, respectively; see Table 6) to the number of galaxies at a given magnitude to account for their incomplete membership information (M07). This was necessary because membership is incomplete at these optical magnitudes, but any X-ray detected optical source was always targeted for spectroscopy in M07. The spectroscopic measurements for Abell 85, Abell 89B, and Abell 754 are 100% complete at , but completeness does drop to – by (CZ03). We note that corresponds to for Abell 89B and for Abell 85 and Abell 754. Since these measurements were made prior to our analysis of the X-ray data, the spectroscopic completeness should be largely independent of the X-ray properties of galaxies; any completeness correction would equally correct the numerator and denominator in the fractions involved. Although one might be concerned that AGN with emission lines are more likely to have a measured redshift, we note that only a small fraction, of X-ray AGN have such emission lines. Any correction for such an effect would be smaller than the current error bars on AGN fractions, which are limited by the small numbers of AGN. We further note that we found no X-ray source matched to a photometric object without a redshift that would be consistent with .
Since it is difficult to construct a clear situation where the X-ray completeness depends on the optical/near-IR host magnitude of the galaxy, we do not expect that sources not detected as X-ray AGN due to X-ray incompleteness are the cause of this discrepancy. To explicitly test this, we considered two sets of X-ray AGN at brighter luminosities, X-ray AGN with over the entire sample, and X-ray AGN with when removing all A89B galaxies from consideration. In both case, we still find that the optical/near-IR magnitudes of galaxies with and without X-ray AGN are drawn from different distributions using the KS test.
| Cluster | — — | — Members — | ——— ——— | |||||
|---|---|---|---|---|---|---|---|---|
| Name | Confirmed | Corrected | ||||||
| (1) | (2) | (3) | (4) | (5) | (6) | (7) | ||
| Abell 85 | 2 | 0 | 109 | 109 | ||||
| Abell 89B | 2 | 1 | 22 | 22 | ||||
| Abell 3125 | 3 | 0 | 20 | 28 | ||||
| Abell 3128 | 4 | 1 | 67 | 67 | ||||
| Abell 754 | 3 | 1 | 171 | 171 | ||||
| Abell 644 | 2 | 1 | 19 | 75 | ||||
| Average | ||||||||
| Sum | 17 | 4 | 408 | 472 | ||||
Note. — AGN fractions for galaxies in six clusters. Columns are: (1) Cluster Name; (2) Number of X-ray AGN with ; (3) Number of X-ray AGN with ; (4) Number of galaxies with spectroscopically confirmed redshifts within Chandra FOV; (5) Number of galaxies within Chandra FOV, corrected for preferential spectroscopic targetting of X-ray detections; (6) X-ray AGN fraction with ; (7) X-ray AGN fraction with ;
Since the X-ray emission from LMXBs and diffuse gas also increases with optical/near-IR magnitude, one concern is that the higher fractions of X-ray AGN at brighter magnitudes is due to normal X-ray emitting galaxies that are misidentified as X-ray AGN. To address this, we have performed Monte Carlo simulations to determine how severely our AGN sample could be contaminated by the combination of X-ray emission from LMXBs and diffuse gas.
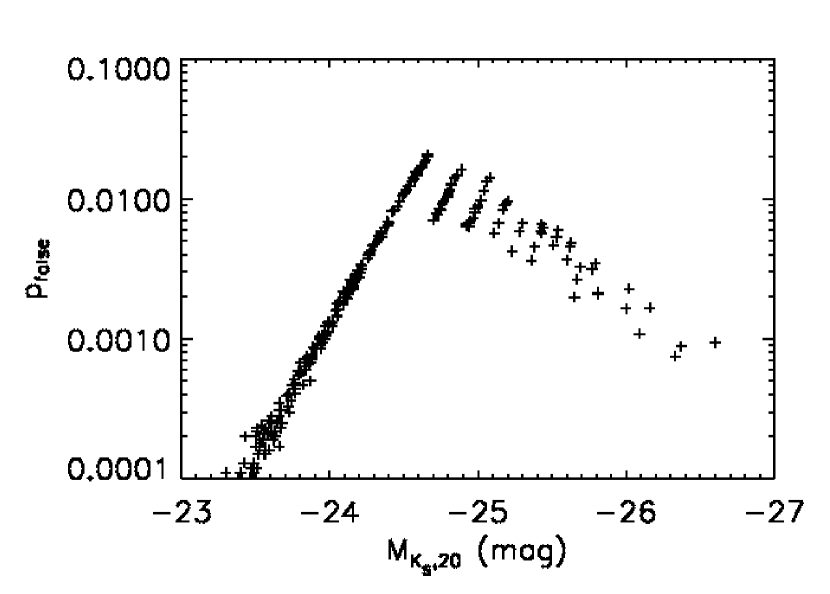
We performed realizations of the X-ray to near-IR luminosity relations for both LMXBs (eq. 1) and diffuse gas (eq. 3, with proper corrections), assuming that the reported errors in the relations follow Gaussian statistics. Within each realization, we combined the two simulated relations to predict the X-ray luminosity from LMXBs and diffuse gas for each cluster galaxy. Since our measured luminosities were for point sources, while the predicted luminosities were for entire galaxies, we needed to determine and apply a correction factor. Comparisons of the point-source counts and the counts within the isophote for the X-ray detected galaxies not classified as X-ray AGN indicated that the average luminosity of the entire galaxy was 1.5 times that for a point source. We applied this correction to the predicted luminosities and then converted to an expected number of counts for each realization assuming an exposure time appropriate for the flanking field observations. This expected number of counts was used to create a simulated output number of counts assuming random deviations drawn from Poisson distributions with the expected number of counts as its mean. The output number of counts and its error were then converted back into luminosity, , and we performed the same (luminosity) selection criteria to identify a source as an X-ray AGN: and more than higher than the sum of the upper limits to the Kim & Fabbiano (2004) and Sun et al. (2007) relations. Thus, for each cluster galaxy we could calculate the probability that a source was misidentified as an X-ray AGN, (Figure 6).
For , and drops as host galaxy optical luminosity decreases due to the minimum X-ray luminosity for X-ray AGN classification. For , , and roughly drops as host galaxy optical luminosity increases. This is due to the X-ray AGN selection criteria set by the X-ray emission expected from LMXBs and gas. The roughly diagonal line up to corresponds to a minimum of 5 counts. Similar rough diagonal lines at increasing galaxy optical luminosity corresponds to an increasing minimum number of counts that satisfy our criteria. As the exposure times are made larger, as in our central field observations, the values of drop at a given . Therefore, calculations based on Figure 6 represent the most conservative, i.e., highest, estimate of the number of sources in our entire sample that are falsely identified as X-ray AGN due to their LMXB and diffuse gas emission. By summing the probabilities, we estimate that there are such false sources. Approximately 0.3, 0.6, and 0.2 falsely indentified sources are predicted for the three brightest bins, respectively, in each of the bottom panels of Figure 5. This would reduce their fractions by , 0.010, and 0.003, which is much less than the current error bars. In addition, we note that even after removing the three AGN closest to the expected relation combining LMXBs and diffuse gas, the KS test still indicates that the (left) and (right) distributions of galaxies with and without AGN are not drawn from the same distributions. We conclude that misidentified X-ray emission from LMXBs and diffuse gas are not responsible for X-ray detected AGN being more likely to be found in more luminous galaxies.
Our results that X-ray detected AGN are more likely to be found in more luminous galaxies for are consistent with results from the XMM detections of AGN in the Abell 901/902 supercluster ( Gilmour et al. 2007). Both show a nearly constant fraction of X-ray AGN of for galaxies. For brighter galaxies, this increases to a maximum of –. We can use to derive galactic stellar masses for these galaxies. If we use Bruzual & Charlot (2003), assuming their Padova 1994 evolutionary tracks for a , solar abundance single stellar population with the Chabrier (2003) initial mass function, and correct the isophotal magnitude to a total magnitude, the magnitudes in Figure 5 (right) correspond to about – . A similar trend has been observed for radio-loud AGN, where the fraction of radio-loud AGN increases with stellar mass, up to (Best et al. 2005). On the other hand, the fraction of strong (, optically identified AGN drops from at to at and (Kauffmann et al. 2003b). The physically relevant question that these trends raise is whether AGN are more likely to reside in more luminous (massive) host galaxies.
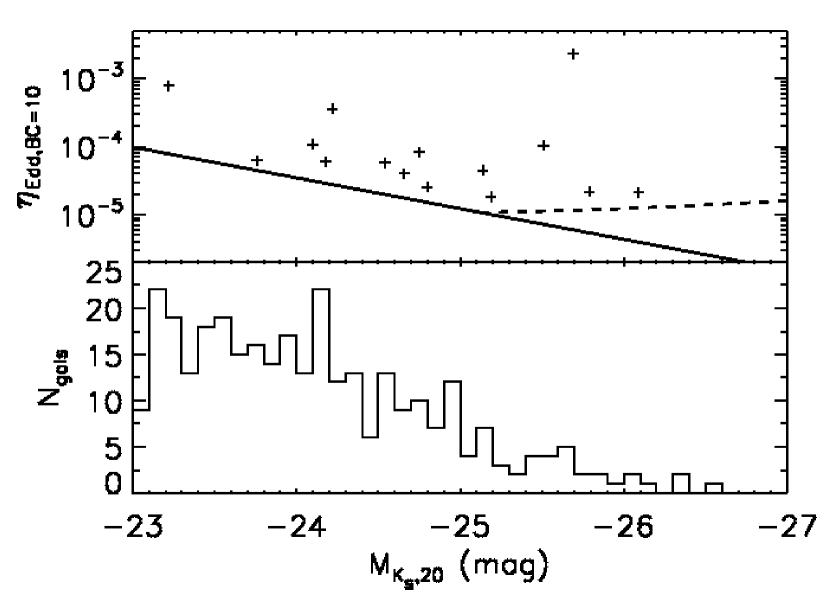
In the case of our X-ray AGN, much of the signal may actually be due to a physical selection bias. For each of our X-ray AGN, we can roughly estimate the accretion rate relative to the Eddington value, divided by the bolometric correction , , from . As near-IR light is a better tracer of mass and subject to less extinction than visible light, we converted the detected near-IR luminosity to a black hole mass (Marconi & Hunt 2003) under the assumption that all the luminosity is from a bulge component, . Since these sources are likely to have a range of disk contributions to their luminosities our derived are underestimated; however, our results are still illustrative. Although BC is uncertain, especially if the mechanism for low and high luminosity X-ray AGN differ, we assume and display, in Figure 7. This assumption is reasonable given derived values of BC at these X-ray luminosities (in the – band; Vasudevan & Fabian 2007). The detected sources cover ranges of . Given our requirement that , we can calculate the minimum . It is clear that at higher luminosities, X-ray AGN at lower can, and are, detected. Similar results are also seen in Abell 901/902 (Gilmour et al. 2007); their are higher because they adopted the -band host-galaxy luminosity black hole mass relation of McLure & Dunlop (2002). Calculated AGN fractions will only be independent of the galaxy luminosity function when they are sensitive to the same .
Since more massive galaxies tend to be more centrally concentrated (e.g., Kauffmann et al. 2003a), indicative of a more dominant bulge component, our are likely to represent larger underestimates at lower near-IR luminosities than at higher luminosities. Thus, the disparity between the probed by a given X-ray luminosity at lower and higher near-IR luminosities is even larger than that suggested by Figure 7.
There are two implication of this selection bias. First, this bias makes it essential that comparisons of AGN fractions make the same assumptions in both their X-ray luminosity and optical magnitude cuts, and that host galaxy morphology (spheroid mass) may also be important. More importantly, is a more physical measure of AGN activity than the X-ray luminosity. The true fraction of galaxies that host X-ray AGN with will be larger than the we measure.
4.5. Radial Distribution of AGN
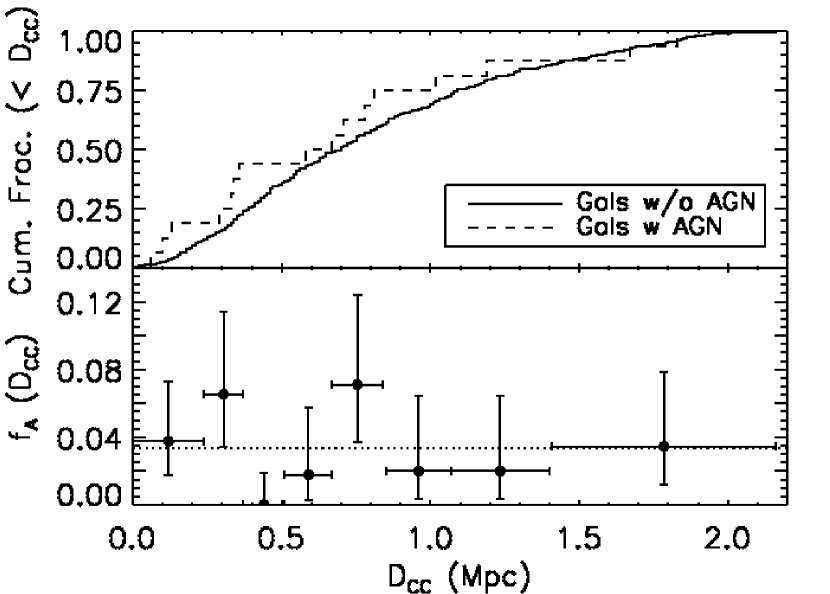
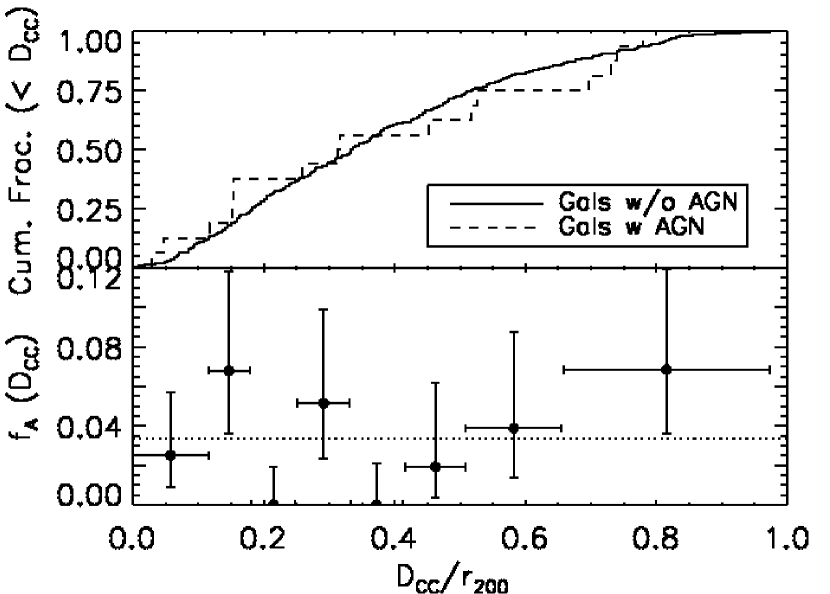
One of the goals of the new observations of Abell 85 and Abell 754 was to measure the spatial distribution of X-ray detected AGN. Along with Abell 89B, these three clusters have partial coverage out to . Although the radial coverage of the other three clusters is smaller, we include them in our measurement of the radial distribution. The Chandra observations of Abell 644 and Abell 3128 have coverage out to , while the one of Abell 3125 extends farther to . Since we never include galaxies outside of the Chandra FOVs, including all six clusters will improve the statistical determination of the AGN fraction with radius, particularly for smaller radii.
In the top panels of Figure 8, we compare the (projected) spatial distributions of galaxies with AGN (dashed) and without AGN (solid). We consider the distributions as a function of physical distance (left) and distance scaled to (right). In the bottom panels of Figure 8, we display in spatial bins, correcting for membership completeness. For this sample of galaxies, the spatial distributions of galaxies with X-ray AGN are the same as galaxies without X-ray AGN.
As X-ray incompleteness is only a minor issue at the edges of the flanking field observations of Abell 85 and Abell 754 and the single observation of Abell 3125, we do not believe it is masking an increased contribution of AGN at the outskirts of clusters. The upper error bars presented in any single bin in the bottom panels of Figure 8 correspond to missing –3 sources in a given bin. Since the edges of the flanking fields cover a wide range of cluster-centric distances, any missing sources should be spread over multiple bins. Thus, the effect from missing only one or two sources over the entire sample is well within our current noise level. In addition, we do not find any radial dependence in the smaller samples of AGN where we are complete; in the entire sample or when removing all A89B galaxies from consideration.
In M07, the spatial distribution of X-ray AGN was also consistent with the other cluster members. We do note that our and their distribution are not independent as they share Abell 644, Abell 3125, and 3128. There are too few X-ray AGN with in our sample to test their result that the more X-ray luminous AGN are more centrally concentrated.
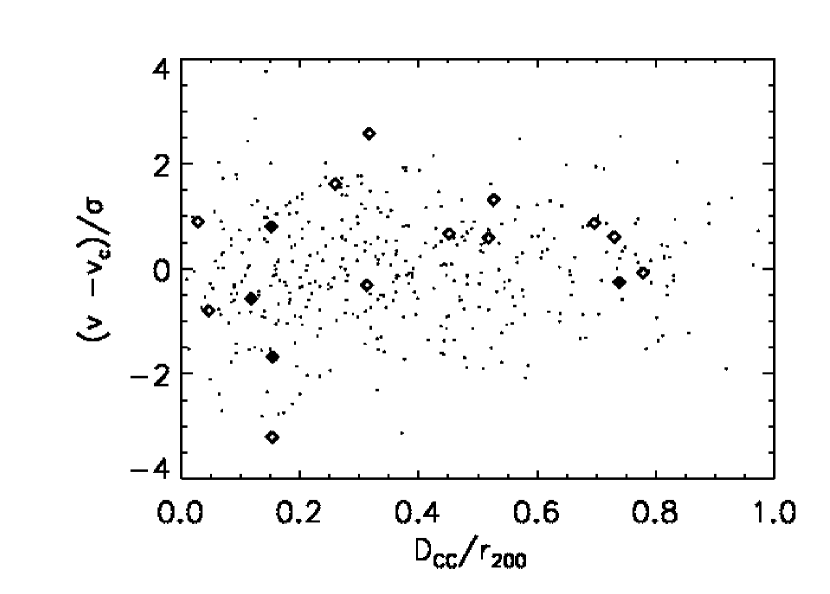
One concern is that galaxies with a small projected distance may actually be infalling galaxies at large physical distances close to the line-of-sight to the cluster. In Figure 9, we plot the infall velocity relative to the mean cluster velocity scaled by the cluster velocity dispersion against the projected distance scaled to for galaxies with AGN (circles) and without AGN (diamonds). Although there are two AGN with large infall velocities at small projected distances, A85-1 and A644-2, a two-dimensional KS test (Press et al. 1992) indicates that the galaxies with and without AGN are not likely to be drawn from samples with different two dimensional distributions.
If AGN are fueled by galaxy-galaxy interactions, one expects AGN should be more prevalent in the outskirts of clusters. However, a significant fraction of early type galaxies, which tend to lie in the centers of richest clusters, are known to harbor low-luminosity AGN and LINERs. A relation between AGN and early-type galaxies could dilute or even reverse the trends predicted by gas-rich mergers or galaxy harassment. In addition, our detected X-ray AGN are detected more often in more luminous host galaxies. Since more massive galaxies tend to be early-type galaxies, any observed radial trend due to low-luminosity AGN and LINERs should be larger than it is intrinsically. The combination of all three effects could explain why the radial distribution of X-ray AGN is not markedly different from that of all galaxies in our sample. Another potential explanation is that radial-averaging over the substructure in the cluster masks any underlying signal. Finally, there could actually be no preferred radial distribution for X-ray AGN.
5. AGN Fraction and Cluster Properties
M07 found some evidence that the AGN fraction varies with the properties of the host cluster. When summing over galaxies, their is 2.2%; however their cluster-averaged is 4.9%. Compared to the cluster-by-cluster , a for 7 degrees of freedom (dof) indicates that cluster variations of the AGN fraction are significant. They find weak evidence that the AGN fraction is higher at lower redshift, in lower velocity-dispersion clusters, in clusters with substantial substructure, and in clusters with a smaller fraction of Butcher-Oemler galaxies. However, they caution that correlations between several of these parameters preclude identification of which cluster property or properties most strongly influence the AGN fraction.
In Table 6 we summarize the AGN fractions for each cluster in our sample. We first list the number of X-ray AGN more luminous than (column 2) and (column 3). We then list the number of spectroscopically confirmed, members in each cluster (column 4). Since some of the galaxies within M06 clusters were preferentially targeted for spectroscopy based on X-ray detections, and completeness for membership of two of the clusters (Abell 644 and Abell 3125) is not 100%, we also list a corrected number of galaxies members in each cluster (column 5). We use these numbers to calculate the X-ray AGN fraction above (column 6) and (column 7). As in M07, we also calculate the cluster-by-cluster average AGN fractions, and the AGN fraction assuming it is independent of cluster properties. We find that the AGN fractions summing over galaxies, and , are consistent with the cluster-averaged AGN fractions and . Comparing of each cluster to the cluster-averaged AGN fraction, the for 5 dof. We note that these numbers have not been corrected for the one or two sources that may be missed due to X-ray incompleteness. This change is minimal as the upper error bars due to the small number of X-ray AGN correspond to missing –3 sources for any given cluster, and sources for the entire sample.
With our current data for Abell 85, Abell 89, and Abell 754, we choose to concentrate on the relation between AGN fraction and two cluster properties, redshift and velocity dispersion, in the paragraphs below. With the narrow redshift range, but wide velocity dispersion range, we have a greater ability to break the degeneracy between the two that was present in M07.
5.1. AGN Fraction and Redshift
Since our sample spans a narrow redshift range, we consider other samples to test whether there is any redshift evolution of the X-ray AGN fraction. To compare the AGN fractions we determine to those in M07, the overlapping clusters, Abell 644, Abell 3125, and Abell 3128 must be removed from M07. The remaining five clusters form a sample. In this sample, the AGN fractions summing over galaxies, and , are consistent with the cluster-averaged AGN fraction and . One might then conclude that the AGN fraction at lower redshifts is indeed higher based on , as suggested in M07; however, M07 also note that most of the higher redshift sample is not X-ray complete down to . At , where the sample should be complete, there is no evidence for redshift evolution in . We also compare our AGN fraction to that of the sample of Sun et al. (2007). We measure , while Sun et al. (2007) find . Thus, we believe that there is no measurable redshift evolution in the X-ray AGN fraction for in the current samples. As the Sun et al. (2007) sample is of more nearby clusters, it samples a more centrally concentrated population of galaxies than the sample in this paper. Due to the combination of our errors being limited by small numbers of AGN and our result that there is no preferred radial distribution of AGN, this mismatch is not likely to play a large role in this conclusion.
Recently, a large fraction of luminous X-ray AGN in clusters was measured (Eastman et al. 2007). Due to the redshift of these clusters and the sensitivity of the observations, fractions were measured for hard (–) band X-ray luminosities, above . They find , and that these fractions were times that of clusters, which is much larger than the expected increases, factors of 1.5 and 3.3, from the measured evolution of the field AGN space density (Ueda et al. 2003). The largest statistical uncertainty came from the lower redshift sample. Although we note that there are issues left to explore regarding the evolution of the AGN fraction in clusters (e.g., the clusters are not necessarily the progenitors of the clusters; is brighter at than at ), we can add the results of Abell 85, Abell 89B, and Abell 754 to Martini et al. (2007) to refine the estimate for clusters. In the hard-band, A754-1 is before pileup corrections. These corrections are likely to make it more luminous than . No other AGN in these clusters has . Thus for clusters, we find and . These fractions are consistent with the fractions reported in Eastman et al. (2007), but with smaller confidence intervals. We note that the increased spatial coverage provided by the clusters in this paper also provides a better match to the more distant clusters, which are sampled out to their projected .
5.2. AGN Fraction and Velocity Dispersion
The lack of a radial dependence of X-ray AGN fraction in our sample may be due to the true absence of a trend or the masking of the expected increasing trend with radius by several other factors, including our increased sensitivity to AGN in massive galaxies, which tend to lie in cluster cores, and the significant population of known low-luminosity AGN/LINERs in early-type galaxies, which are also more numerous in cluster cores. Any trend might also have been diluted by our averaging over any substructures at a given radius. With better AGN statistics, it may be possible to consider whether the AGN fraction increases in group-like substructures in the cluster relative to the cluster core, a truer test of the hypothesis that mergers drive AGN today. For now, we employ another test of the effect of environment on AGN fraction and thus of the merger scenario: is there a change in X-ray AGN fraction as the velocity dispersions of clusters increase?
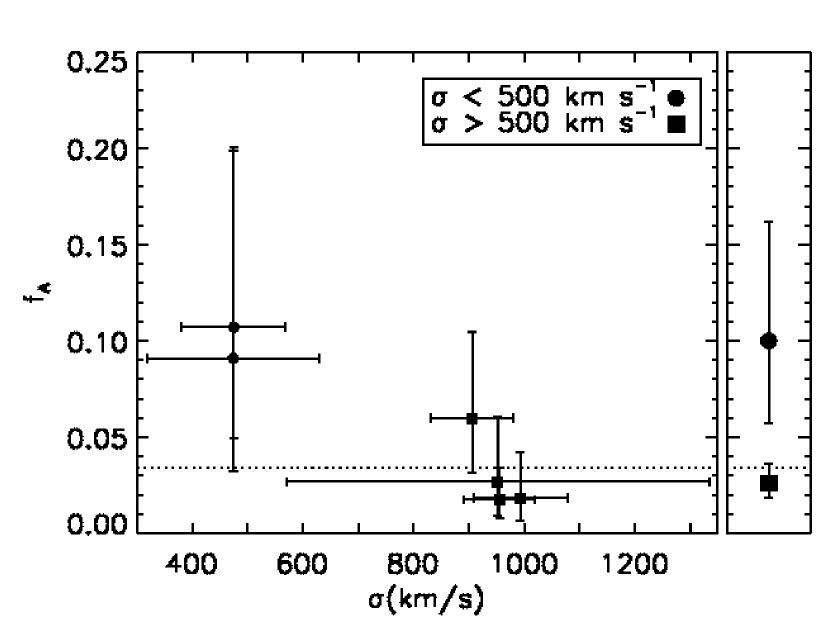
We display as a function of cluster velocity-dispersion for our cluster sample in Figure 10. In our sample, comparing the AGN fraction of each cluster to the cluster-averaged AGN fraction does not indicate a strong variation. However, we find a correlation between AGN fraction and velocity dispersion. Clusters with lower velocity dispersion have larger in our data. In particular, the two clusters with the highest AGN fraction, Abell 89B and Abell 3125 have velocity dispersions of , more typical of rich groups. In the right panel of Figure 10, we compare the combined fractions of the two low velocity dispersion clusters, , to the four higher velocity dispersion clusters, . Using the binomial theorem to calculate the confidence intervals on the fractions (e.g., Gehrels 1986), we find that the probability the two above fractions overlap is very small, . However, this could overestimate the significance of the result as there are fifteen different combinations of two cluster groups we could make from our cluster sample. Therefore, we conservatively estimate that the AGN fraction is higher in lower velocity dispersion clusters at the confidence level. A similar trend appears in the Abell 901/902 supercluster Gilmour et al. (2007). There, X-ray AGN prefer to be in regions with group-like environments (mainly based on galaxy density), as compared to field-like or cluster-like environments. An anticorrelation between optical AGN fraction and velocity dispersion (Popesso & Biviano 2006) and a correlation between radio AGN fraction and larger environmental densities (Best et al. 2005) have also been observed. We do not expect that this result is sensitive to the varying radial coverage between individual clusters. First, we found no radial dependence in the AGN fraction at these luminosities. Second, the discrepancy between the fractions is even more significant if we exclude Abell 644 and Abell 3128, the two clusters with the least complete radial coverage.
Smaller X-ray AGN fractions than that found in our low velocity dispersion clusters are measured in less dense environments. Shen et al. (2007) only found one X-ray AGN (out of 50 galaxies) in a sample of eight poor groups (), , where the majority of these groups had smaller velocity dispersion than Abell 89B and Abell 3125. The X-ray AGN fraction of early-type field galaxies in the Extended Chandra Deep Field-South has also been measured (Lehmer et al. 2007). They find (B. Lehmer 2006, private communication). We note that the X-ray AGN fraction for all galaxies drops by a factor of compared to the fraction for just early-type galaxies in nearby clusters (T. Arnold et al., in preparation). Since late-type galaxies are more prevalent in the field than in clusters, one expects the field X-ray AGN fraction for all galaxies to drop more rapidly compared to the measured for early-type galaxies.
We note that any additional obscuration associated with gas-rich galaxies will be more prevalent where the fraction of late-type galaxies is higher. The effect of missing AGN due to obscuration will be strongest in the field and weakest in the highest velocity dispersion clusters. Thus, obscuration is unlikely to explain the apparent prevalence of X-ray AGN in rich groups and poor clusters.
The likelihood of galaxy mergers increases with increasing galaxy density and decreasing relative velocity. Compared to poor groups and the field, the galaxy densities of rich groups are higher. Compared to galaxies in clusters, the relative velocities of galaxies in rich groups are lower. Thus, it is not surprising that AGN may form preferentially in group-like environments. A larger sample of groups and clusters, particularly those with velocity dispersions of poor clusters or rich groups at , are needed to determine the preferred environment for AGN and use this information to determine how they are fueled. Larger datasets of comparably selected X-ray AGN in the field would also be valuable.
6. Conclusions
To better understand the factors that may drive the evolution of AGN today, we measure the AGN fraction in a new sample of nearby rich clusters, compare it to more distant samples, and examine how it varies with environment. We present new wide-field Chandra Observations of AGN in Abell 85 and Abell 754. Seventeen X-ray sources associated with galaxies in Abell 85, Abell 89B, and Abell 754 are detected. Using relations we classify seven of these galaxies as X-ray AGN with . Only two of these X-ray AGN are classified as AGN based on their optical spectra. Two of the X-ray galaxies not classified as X-ray AGN have been previously spectroscopically identified as AGN. These sources are examples of the additional AGN we expect are present in these clusters below our luminosity threshold.
We add detections of X-ray AGN in three other clusters, Abell 644, Abell 3125, and Abell 3128 to create a sample of sixteen X-ray AGN. We find that of galaxies host X-ray AGN with . These results are consistent with the fractions from \al@MKK+2006,MMK2007; \al@MKK+2006,MMK2007. When compared to other samples (e.g., M07, Sun et al. 2007) at the same rest-frame X-ray luminosity and absolute magnitude limits, there is no evidence for an evolving X-ray AGN fraction for .
Our three most important results are as follows:
-
•
X-ray AGN are detected more often in more luminous host galaxies. This observed trend of X-ray AGN fraction highlights the importance of using the same X-ray luminosity and absolute magnitude cuts when comparing fractions. This trend is due at least partially to a physical selection effect. Two galaxies can have the same accretion rate relative to the Eddington limit, but the galaxy with the more massive black hole will have a higher X-ray luminosity. More luminous host galaxies tend to have more massive black holes for a combination of two reasons. First, the mass of a black hole scales with the mass of a bulge component, and at a given bulge-to-disk ratio, a more luminous galaxy will have a more massive bulge. Second, more luminous host galaxies are more likely to be dominated by their spheroid. Thus, it is not surprising that at a given X-ray luminosity one can detect less efficient X-ray AGN in more luminous galaxies. We require an understanding of the distribution of accretion rates relative to the Eddington limit in X-ray AGN to determine whether X-ray AGN are more likely to reside in more luminous host galaxies for reasons beyond this physical selection effect.
-
•
We do not find an excess fraction of X-ray AGN in the outskirts of clusters. The radial distribution of X-ray AGN appears to follow the same distribution as cluster members without X-ray AGN. Ruderman & Ebeling (2005) also found a relatively flat distribution of X-ray sources around massive, disturbed clusters. The expectation from the major-merger or galaxy harassment pictures for AGN fueling is that more AGN should be found in the outskirts of clusters. Acting against this expectation is our increased sensitivity to AGN in the most luminous spheroids, as well as the significant fraction of early type galaxies known to harbor low-luminosity AGN and LINERs. Thus, the tendency of the most massive and early-type galaxies to lie in the centers of richest clusters could dilute or even reverse AGN trends due to galaxy interactions. For instance, Ruderman & Ebeling (2005) also found that massive, relaxed clusters had an excess number of X-ray AGN in their central and near their virial radius. The lack of any trend in our results could arise from the combination of effects listed above, radial-averaging over the substructure in the cluster, or that there is actually no preferred radial distribution for X-ray AGN.
-
•
There is increasing evidence for higher AGN fractions in low velocity dispersion clusters. We find that the fraction of X-ray AGN is larger (at the confidence level) in lower velocity dispersion clusters or large groups () than in richer clusters (). Combined with results for the Abell 901/902 supercluster (Gilmour et al. 2007), poor groups (Shen et al. 2007), and the field (Lehmer et al. 2007), one can form a picture where X-ray AGN in the local Universe are preferentially found in rich group environments. If gas-rich mergers between galaxies are the principal driver of AGN, then there should be more AGN in groups, where the galaxies tend to have higher gas fractions and smaller relative velocities than in richer clusters, but galaxy densities are higher than in the field. Because the most massive and early type galaxies tend to lie in the richest clusters, and these galaxies often harbor detectable LINERs that may be low-luminosity AGN, any increase in AGN fraction due to galaxy-galaxy interactions could be even larger than what we measure. Finally, we note that obscuration of X-ray AGN in gas-rich galaxies is not likely to be responsible for this trend, as more gas-rich galaxies are expected in lower density environments.
These issues can be addressed through larger samples of X-ray AGN for clusters, groups, and the field. For clusters, there are a couple of key properties that need to be better sampled: an increased number of lower velocity dispersion clusters and a larger number of disturbed and relaxed clusters observed out to their virial radius. Such samples would directly address the radial distribution of X-ray AGN and whether there is a preferred host environment. Specifically, such data would be valuable to resolve the potential inconsistency between our second and third highlighted results, which may be due to small number statistics in the outskirts of clusters or our averaging over the substructure in clusters. In addition, larger numbers of X-ray AGN will constrain the underlying Eddington accretion efficiency distribution and (host luminosity dependent?) AGN fraction by convolving these properties with the galaxy luminosity function and comparing to the observed AGN fractions. These constraints in turn can be tested against AGN fueling mechanisms.
References
- Adelman-McCarthy et al. (2007) Adelman-McCarthy, J. K., et al. 2007, ApJS, 172, 634
- Barbaro & Poggianti (1997) Barbaro, G., & Poggianti, B. M. 1997, A&A, 324, 490
- Barnes & Hernquist (1992) Barnes, J. E., & Hernquist, L. 1992, ARA&A, 30, 705
- Beers et al. (1990) Beers, T. C., Flynn, K., & Gebhardt, K. 1990, AJ, 100, 32
- Best et al. (2005) Best, P. N., Kauffmann, G., Heckman, T. M., Brinchmann, J., Charlot, S., Ivezić, Ž., & White, S. D. M. 2005, MNRAS, 362, 25
- Bruzual & Charlot (2003) Bruzual, G., & Charlot, S. 2003, MNRAS, 344, 1000
- Caldwell & Rose (1997) Caldwell, N., & Rose, J. A. 1997, AJ, 113, 492
- Calzetti et al. (2000) Calzetti, D., Armus, L., Bohlin, R. C., Kinney, A. L., Koornneef, J., & Storchi-Bergmann, T. 2000, ApJ, 533, 682
- Chabrier (2003) Chabrier, G. 2003, ApJ, 586, L133
- Christlein & Zabludoff (2003) Christlein, D., & Zabludoff, A. I. 2003, ApJ, 591, 764
- Christlein & Zabludoff (2005) —. 2005, ApJ, 621, 201
- Condon (1992) Condon, J. J. 1992, ARA&A, 30, 575
- Condon et al. (1991) Condon, J. J., Anderson, M. L., & Helou, G. 1991, ApJ, 376, 95
- Condon et al. (1998) Condon, J. J., Cotton, W. D., Greisen, E. W., Yin, Q. F., Perley, R. A., Taylor, G. B., & Broderick, J. J. 1998, AJ, 115, 1693
- Davis (2001) Davis, J. E. 2001, ApJ, 562, 575
- Dressler (1980) Dressler, A. 1980, ApJ, 236, 351
- Dressler et al. (1985) Dressler, A., Thompson, I. B., & Shectman, S. A. 1985, ApJ, 288, 481
- Durret et al. (1998) Durret, F., Forman, W., Gerbal, D., Jones, C., & Vikhlinin, A. 1998, A&A, 335, 41
- Durret et al. (2005) Durret, F., Lima Neto, G. B., & Forman, W. 2005, A&A, 432, 809
- Eastman et al. (2007) Eastman, J., Martini, P., Sivakoff, G., Kelson, D. D., Mulchaey, J. S., & Tran, K.-V. 2007, ApJ, 664, L9
- Fisher et al. (1998) Fisher, D., Fabricant, D., Franx, M., & van Dokkum, P. 1998, ApJ, 498, 195
- Gehrels (1986) Gehrels, N. 1986, ApJ, 303, 336
- Gilmour et al. (2007) Gilmour, R., Gray, M. E., Almaini, O., Best, P., Wolf, C., Meisenheimer, K., Papovich, C., & Bell, E. 2007, MNRAS, 752
- Giovanelli & Haynes (1985) Giovanelli, R., & Haynes, M. P. 1985, ApJ, 292, 404
- Gisler (1978) Gisler, G. R. 1978, MNRAS, 183, 633
- Grimm et al. (2003) Grimm, H.-J., Gilfanov, M., & Sunyaev, R. 2003, MNRAS, 339, 793
- Hewitt & Burbidge (1991) Hewitt, A., & Burbidge, G. 1991, ApJS, 75, 297
- Ho et al. (1993) Ho, L. C., Filippenko, A. V., & Sargent, W. L. W. 1993, ApJ, 417, 63
- Ho et al. (1997) —. 1997, ApJ, 487, 568
- Hornschemeier et al. (2005) Hornschemeier, A. E., Heckman, T. M., Ptak, A. F., Tremonti, C. A., & Colbert, E. J. M. 2005, AJ, 129, 86
- Katgert et al. (1998) Katgert, P., Mazure, A., den Hartog, R., Adami, C., Biviano, A., & Perea, J. 1998, A&AS, 129, 399
- Kauffmann et al. (2003a) Kauffmann, G., et al. 2003a, MNRAS, 341, 54
- Kauffmann et al. (2003b) —. 2003b, MNRAS, 346, 1055
- Kempner et al. (2002) Kempner, J. C., Sarazin, C. L., & Ricker, P. M. 2002, ApJ, 579, 236
- Kennicutt (1992) Kennicutt, Jr., R. C. 1992, ApJ, 388, 310
- Kennicutt (1998) —. 1998, ARA&A, 36, 189
- Kim & Fabbiano (2003) Kim, D., & Fabbiano, G. 2003, ApJ, 586, 826
- Kim & Fabbiano (2004) Kim, D.-W., & Fabbiano, G. 2004, ApJ, 611, 846
- Kim et al. (2007) Kim, M., et al. 2007, ApJS, 169, 401
- Lake et al. (1998) Lake, G., Katz, N., & Moore, B. 1998, ApJ, 495, 152
- Lamareille et al. (2004) Lamareille, F., Mouhcine, M., Contini, T., Lewis, I., & Maddox, S. 2004, MNRAS, 350, 396
- Lauberts & Valentijn (1989) Lauberts, A., & Valentijn, E. A. 1989, The surface photometry catalogue of the ESO-Uppsala galaxies (Garching: European Southern Observatory, —c1989)
- Lehmer et al. (2007) Lehmer, B. D., et al. 2007, ApJ, 657, 681
- Majewski et al. (2003) Majewski, S. R., Skrutskie, M. F., Weinberg, M. D., & Ostheimer, J. C. 2003, ApJ, 599, 1082
- Marconi & Hunt (2003) Marconi, A., & Hunt, L. K. 2003, ApJ, 589, L21
- Markevitch et al. (2003) Markevitch, M., et al. 2003, ApJ, 586, L19
- Marshall et al. (2002) Marshall, H. L., Miller, B. P., Davis, D. S., Perlman, E. S., Wise, M., Canizares, C. R., & Harris, D. E. 2002, ApJ, 564, 683
- Martini et al. (2006) Martini, P., Kelson, D. D., Kim, E., Mulchaey, J. S., & Athey, A. A. 2006, ApJ, 644, 116
- Martini et al. (2002) Martini, P., Kelson, D. D., Mulchaey, J. S., & Trager, S. C. 2002, ApJ, 576, L109
- Martini et al. (2007) Martini, P., Mulchaey, J. S., & Kelson, D. D. 2007, ApJ, 664, 761
- Matt (2002) Matt, G. 2002, Royal Society of London Philosophical Transactions Series A, 360, 2045
- McLure & Dunlop (2002) McLure, R. J., & Dunlop, J. S. 2002, MNRAS, 331, 795
- Moore et al. (1996) Moore, B., Katz, N., Lake, G., Dressler, A., & Oemler, A. 1996, Nature, 379, 613
- Moran et al. (2002) Moran, E. C., Filippenko, A. V., & Chornock, R. 2002, ApJ, 579, L71
- Moshir et al. (1990) Moshir, M., et al. 1990, in IRAS Faint Source Catalogue, version 2.0 (1990), 0–+
- Paturel et al. (2003) Paturel, G., Petit, C., Prugniel, P., Theureau, G., Rousseau, J., Brouty, M., Dubois, P., & Cambrésy, L. 2003, A&A, 412, 45
- Popesso & Biviano (2006) Popesso, P., & Biviano, A. 2006, A&A, 460, L23
- Press et al. (1992) Press, W. H., Teukolsky, S. A., Vetterling, W. T., & Flannery, B. P. 1992, Numerical recipes in C. The art of scientific computing (Cambridge: University Press, —c1992, 2nd ed.)
- Puchnarewicz et al. (1992) Puchnarewicz, E. M., et al. 1992, MNRAS, 256, 589
- Rola et al. (1997) Rola, C. S., Terlevich, E., & Terlevich, R. J. 1997, MNRAS, 289, 419
- Ruderman & Ebeling (2005) Ruderman, J. T., & Ebeling, H. 2005, ApJ, 623, L81
- Schlegel et al. (1998) Schlegel, D. J., Finkbeiner, D. P., & Davis, M. 1998, ApJ, 500, 525
- Shen et al. (2007) Shen, Y., Mulchaey, J. S., Raychaudhury, S., Rasmussen, J., & Ponman, T. J. 2007, ApJ, 654, L115
- Sivakoff et al. (2004) Sivakoff, G. R., Sarazin, C. L., & Carlin, J. L. 2004, ApJ, 617, 262
- Sivakoff et al. (2003) Sivakoff, G. R., Sarazin, C. L., & Irwin, J. A. 2003, ApJ, 599, 218
- Skrutskie et al. (2006) Skrutskie, M. F., et al. 2006, AJ, 131, 1163
- Sun et al. (2007) Sun, M., Jones, C., Forman, W., Vikhlinin, A., Donahue, M., & Voit, M. 2007, ApJ, 657, 197
- Thomas & Katgert (2006) Thomas, T., & Katgert, P. 2006, A&A, 446, 31
- Treu et al. (2003) Treu, T., Ellis, R. S., Kneib, J.-P., Dressler, A., Smail, I., Czoske, O., Oemler, A., & Natarajan, P. 2003, ApJ, 591, 53
- Ueda et al. (2003) Ueda, Y., Akiyama, M., Ohta, K., & Miyaji, T. 2003, ApJ, 598, 886
- Vasudevan & Fabian (2007) Vasudevan, R. V., & Fabian, A. C. 2007, MNRAS, 381, 1235
- White et al. (1997) White, R. L., Becker, R. H., Helfand, D. J., & Gregg, M. D. 1997, ApJ, 475, 479
- Yuan & Narayan (2004) Yuan, F., & Narayan, R. 2004, ApJ, 612, 724
- Yun et al. (2001) Yun, M. S., Reddy, N. A., & Condon, J. J. 2001, ApJ, 554, 803
- Zabludoff & Zaritsky (1995) Zabludoff, A. I., & Zaritsky, D. 1995, ApJ, 447, L21+
- Zhao et al. (1989) Zhao, J.-H., Burns, J. O., & Owen, F. N. 1989, AJ, 98, 64