(33email: tkerr@jach.hawaii.edu) 44institutetext: Department of Astronomy, 116 Church St. SE, University of Minnesota, Minneapolis, MN 55455, USA (44email: chelsea@astro.umn.edu) 55institutetext: The Aerospace Corporation, Mail Stop M2-266, PO Box 92957, Los Angeles, CA 90009-29957, USA (55email: David.K.Lynch@aero.org, Richard.J.Rudy@aero.org, Richard.L.Pearson@aero.org,
Ray.W.Russell@aero.org) 66institutetext: Department of Astronomy, Brigham Young University, N283 ESC Provo, UT 84602, USA
Metallicity and effective temperature of the secondary of RS Oph
Abstract
Context. The recurrent nova RS Ophiuchi undergoes nova eruptions every years as a result of thermonuclear runaway on the surface of a white dwarf close to the Chandrasekhar limit. Both the progress of the eruption, and its aftermath, depend on the (poorly known) composition of the red giant in the RS Oph system.
Aims. Our aim is to understand better the effect of the giant secondary on the recurrent nova eruption.
Methods. Synthetic spectra were computed for a grid of M-giant model atmospheres having a range of effective temperatures K, gravities 0 log g 1 and abundances -4 [Fe/H] 0.5, and fit to infrared spectra of RS Oph as it returned to quiescence after its 2006 eruption. We have modelled the infrared spectrum in the range m to determine metallicity and effective temperature of the red giant.
Results. We find K, , , , in the atmosphere of the secondary, and demonstrate that that inclusion of some dust ‘veiling’ in the spectra cannot improve our fits.
Key Words.:
stars: individual: RS Ophiuchi – infrared: stars – binaries: symbiotic – novae, cataclysmic variables1 Introduction
The recurrent nova (RN) RS Ophiuchi is a binary system consisting of a red giant (RG) star and a white dwarf (WD) with mass near the Chandrasekhar limit (see Shore et al. 1996; Fekel et al. 2000, and references therein). RS Oph is the best studied of RNe, and is known to have undergone at least five eruptions, in 1898, 1933, 1958, 1967 and 1985. Each eruption displays very similar visual light curves (e.g., Rosino 1987). The most recent outburst of RS Oph was discovered in 2006 February 12.829 UT (Narumi et al. 2006, this defines our time origin), and was the subject of an intensive, multi-wavelength observational campaign, from the radio to x-rays (Evans et al. 2008).
It is likely that, unlike classical novae, in which some of the WD is stripped away in the nova eruption, resulting in a secular decline in the WD mass, the mass of the WD in RS Oph may be increasing. If this is the case, the mass of the WD in RS Oph may eventually reach the Chandrasekhar limit and explode as a Type Ia supernova (Starrfield et al. 2004; Wood-Vasey & Sokoloski 2006). However this remains a matter of considerable debate (e.g., Ness et al. 2008).
Despite a long history of observations of RS Oph, our knowledge of the secondary star is surprisingly sparse. The secondary known to be a RG, (SIMBAD111http://simbad.u-strasbg.fr/Simbad spectral type M2IIIpe+) yet little is known about photospheric abundances. Scott et al. (1994) claimed some evidence of a deficit of carbon in the secondary, while Wallerstein et al. (2006) found a “rather small excess” of metals.
A knowledge of abundances in the atmosphere of the RG in the RS Oph system is of crucial importance for two reasons. First, in contrast to classical novae, it seems that only material accreted by the WD from the RG takes part in the thermonuclear runaway (TNR) that leads to the RN eruption. A complete understanding of the TNR requires knowledge of the composition of material deposited on the WD; moreover, knowing the composition of the material accreted by the WD will make it possible to predict, with some confidence, the composition of the ejected material, without the complication of knowing (or guessing) the amount of material dredged up from the WD. Second, the material ejected in the RN eruption runs into the RG wind (Bode & Kahn 1985), which is shocked, causing the gas to emit strongly at x-ray (Bode et al. 2006; Ness et al. 2007), infrared (IR; Das et al. 2006; Evans et al. 2007a, b) and radio wavelengths (O’Brien et al. 2006). Indeed x-ray observations of the 2006 eruption (Ness et al. 2008) show complex, evolving line emission, the interpretation of which requires knowledge of the composition of the RG wind, which is poorly characterised.
Here we report the results of a preliminary attempt to rigorously determine some of the parameters of the RG in the RS Oph system by modelling its IR spectrum after the 2006 eruption had subsided. Special attention is paid to the abundances of carbon and nitrogen, and to the isotopic ratio 12C/13C, which are primary indicators of the state of stellar evolution.
From the known orbit (Fekel et al. 2000) we find that the RS Oph system was close to quadrature during our observation, so that the WD was illuminating half of the observed photospheric hemisphere of the RG. Further papers will augment the results presented here, and will address the issue of the irradiation of the RG by the WD.
2 Observational data
RS Oph was observed in the bands with the UIST instrument () on the United Kingdom Infrared Telescope (UKIRT) on 2006 August 25 (day 193.71) and on September 18 (day 212.9). While the data cover the wavelength range 0.87–2.51m only data in the 1.4–2.5m range are considered here. First order sky subtraction was achieved by nodding along the slit; HR6493 was used to remove telluric features and for flux calibration. Wavelength calibration used an argon arc, and is accurate to m in the bands; further observational details may be found in Evans et al. (2007a). The data were dereddened using (Snijders 1987).
We note that data at the edge of the atmospheric window may be less reliable than elsewhere due to inadequate atmospheric cancellation. While this has minimal effect on the most pertinent diagnostic (molecular) features this may impact on our fit at the window edges.
3 Procedure
3.1 Origin of CO bands
We are confident that the CO and CN bands originate in the atmosphere of the RG and may be used as a diagnostic of photospheric conditions. Some classical novae are known to display CO emission (e.g., Evans et al. 2005) which may cause ‘veiling’ of the photospheric CO but the environment of RS Oph during its eruption would never have been conducive to molecule formation. Furthermore there is little or no change in the molecular bands between the August and September observations, so we are proceed on the assumption that these features arise in the RG atmosphere.
3.2 Model atmospheres and synthetic spectra
We compute plane-parallel model atmospheres of evolved stars in LTE, with no energy divergence, using the SAM12 program (Pavlenko 2003), which is a modification of ATLAS12 (Kurucz 1999). Chemical equilibrium is computed for molecular species assuming LTE. The opacity sampling approach (Sneden et al. 1976) is used to account for absorption of atoms, ions and molecules (for more details see Pavlenko 2003). The 1-D convection mixing length theory modified by Kurucz (1999) in ATLAS12 was used to account for convection. The computed model atmospheres are available on the web222 ftp://ftp.mao.kiev.ua/pub/users/yp/RS.Oph.
Synthetic spectra are calculated with the WITA6 program (Pavlenko 2000), using the same approximations and opacities as SAM12. To compute synthetic spectra we use line lists from Plez (1998, TiO), Goorvitch (1994, CO), Kupka et al. (1999, VALD), Kurucz (1993, CN), and Barber et al. (2006, H2O). The shape of each molecular or atomic line is determined using the Voigt function. Damping constants are taken from line databases, or computed using Unsold’s (1955) approach. A wavelength step = 0.5 Å is employed in the synthetic spectra computations.
In our computations we adopt a microturbulent velocity = 3 km s-1. This value is somewhat higher than the km s-1 found in the atmospheres of RGs (see Foy 1978). However a higher value may be more realistic for the secondary of a RN. Unfortunately our spectra are not suitable for a more accurate determination of ; we will further investigate this in forthcoming papers.
3.3 Fits to observed spectra
To determine the best fit parameters, we compare the observed fluxes with the computed fluxes following the scheme of Pavlenko & Jones (2002). We adopt a Gaussian profile (FWHM = 0.002 m) to model line broadening. We then find the minima of the 3D function
where and are the observed and computed spectra respectively, and , , are the wavelength shift, the normalisation factor, and the profile broadening parameter, respectively. The model parameters are determined by minimising for every computed spectrum, and from the grid of the better solutions for a given set of abundances and/or other parameters (microturbulent velocity, effective temperature, isotopic ratios, etc.), we choose the best-fitting solution.
For many evolved stars, some of the flux, particularly at longer wavelengths, arises from dust in the circumstellar environment. On the other hand any inadequate atmospheric cancellation (see Section 2) can mimic the presence of circumstellar dust. Either of these effects provides a source of ‘veiling’ in the observed spectra, such that , where is the flux formed outside the stellar photosphere. In this case we should minimise , whilst considering as an additional parameter (see Pavlenko & Geballe 2002 and Pavlenko et al. 2004 for more details). In the present paper we refer to both of these effects as ‘veiling’.
3.4 Algorithm to determine best fit
We carry out the process in several steps, as follows:
-
1.
we compute a small grid of model atmospheres in the range of metallicities , effective temperatures K and ;
-
2.
the main absorption features in the observed spectrum were identified (excluding the emission lines arising in the shocked wind and ejecta);
-
3.
for these models we compute synthetic spectra;
-
4.
after determining the basic parameters of RS Oph we compute further grids of synthetic spectra, but incorporate at this stage a range of possible non-solar abundances for carbon and nitrogen;
-
5.
the best fits were found following the schemes described in Section 3.3, i.e. we obtained solutions with and without veiling;
-
6.
the best fit was determined from the both non-veiled and veiled solutions.
4 Results


4.1 Fits to the SED of RS Oph: models with different metallicities
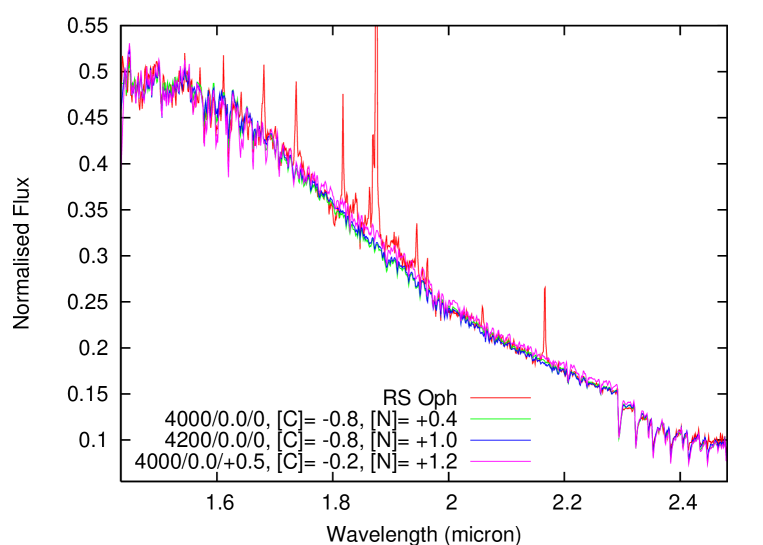
The main features in the photospheric spectrum of RS Oph are absorption by 12CO and 13CO around 1.6 and 2.3m respectively, where the first and second overtone ( and 3 respectively) bands of CO are located (see Fig. 1). Some features at 1.6m are due to absorption by CN bands.
The slopes of the spectral energy distribution (SED) and the intensity of molecular bands in the modelled spectra depend on both and [Fe/H]. This allows us to refine both parameters from analysis of the best fits of the synthetic spectra to the observed spectrum of RS Oph. In Fig. 2 we show the dependence of the best fit parameter on and on [Fe/H]. Here the range of metallicities is restricted to the range [–2…+0.5]; for lower metallicities the minimisation does not produce any meaningful fits because the features in the computed spectra become too shallow. The computations in Fig. 2 were carried out for the veiling-free case, and the abundances of carbon and nitrogen were scaled by the factor [Fe/H].
The best fit over the wavelength range 1.506–2.490m has for K, and We note that our best solution is consistent with normal (solar) metallicities (see Anders & Grevesse 1989). However over the wavelength range 1.491–2.490m (which includes the CN bands at the blue end of the spectral range), we obtain a better solution, with = 0.2066 0.0006 for a model atmosphere with the same = 3400 100 K, and [Fe/H] = 0.0 0.5, but with 0.5 (note that the value of depends on the wavelength range over which the comparison between observed and computed spectra is made). However, further analysis (Section 4.2) shows that the CO and CN bands in our theoretical spectra do not have the proper intensities for these parameters if simultaneous fits are attempted over a broad wavelength range.
4.2 Fits to the SED of RS Oph: models with different abundances of carbon and nitrogen
Numerical experiments showed that, in order to get acceptable fits of both CO and CN bands, the carbon abundance must be reduced, while the nitrogen abundance must be increased. To determine the appropriate abundances of carbon and nitrogen we compute the second set of synthetic spectra varying abundances of carbon log N(C) and nitrogen log N(N) over a wide range.
Computations were carried out for the case of (i) “normal metallicities”, i.e. all abundances other than N and O were taken to be solar, [Fe/H] = 0.0, and (ii) slightly enhanced metallicities, [Fe/H] = +0.5. For model atmospheres having solar abundances we performed computations for and . Sets of variable carbon and nitrogen abundances were adopted with a step of 0.2 dex. We note that the adopted variations of the C and N abundances have minimal effect on the temperature structure of the RG model atmosphere for in the range 3600–4400 K. With these refined abundances of carbon and nitrogen we carried out the entire set of computations and comparison.
Better fits to the observed SEDs were obtained for model atmospheres with //[Fe/H] = 4000/0.0/0.0, 4000/1.0/+0.5, 4200/0.0/0.0 with = 5.176 0.031, 5.110 0.031, 5.130 0.031, Figs. 3, 4, 5, respectively. Formally the best solution we obtain is for the 4000/1.0/+0.5 set of parameters. However, as illustrated in Fig. 5:
-
•
the fit to the observed slope at m is better with model spectra computed with the 4000/0.0/0.0 and 4200/0.0/0.0 model atmospheres;
-
•
a few of the sufficiently strong atomic lines computed for the metal-rich model atmosphere are too strong by comparison with observations.
Both these factors provide good constrains for choosing the best solution, which is provided by two model atmospheres 4000/0.0/0.0 or 4200/0.0/0.0, and with , .
Emission measure distribution analysis and APEC modelling of line fluxes derived Chandra and XMM-Newton spectra obtained over a period 240 days post-outburst (Ness et al. 2008) indicates that the metallicity of the ejecta is solar, with N to be overabundant and Fe to be underabundant relative to O. The N overabundance derived by Ness et al. (2008) suggests that the material accreted by the WD from the RG secondary is N-enhanced, in qualitative agreement with our models.
| Dusty-free case | ||||||||
| (K) | 3800 | 4000 | 4200 | 4400 | ||||
| [Fe/H] | 0.0 | 0.5 | 0.0 | 0.5 | 0.0 | 0.5 | 0.0 | 0.5 |
| *100 | 6.403 | 5.667 | 5.176 | 5.110 | 5.130 | 6.019 | 5.393 | 9.355 |
| log g | 0.0 | 0.5 | 0.0 | 1.0 | 0.0 | 0.5 | 1.0 | 1.0 |
| [C/H]/[N/H] | -1./0 | -0.5/+0.4 | -0.8/+0.4 | -0.2/+1.2 | -0.8/+0.9 | -0.2/+0.2 | -0.2/+0.8 | -0.2/+1.2 |
| “Veiled” model | ||||||||
| (K) | 3800 | 4000 | 4200 | 4400 | ||||
| [Fe/H] | 0.0 | 0.5 | 0.0 | 0.5 | 0.0 | 0.5 | 0.0 | 0.5 |
| *100 | 9.176 | 6.929 | 5.738 | 6.149 | 5.374 | 5.900 | 5.574 | 7.653 |
| log g | 0.0 | 0.0 | 0.0 | 1.0 | 0.5 | 1.0 | 1.0 | 0.5 |
| [C/H]/[N/H] | -0.8/0 | -0.8/+0.2 | -0.6/+0.8 | -0.4/+1.0 | -0.4/+0.4 | -0.3/+1.2 | -0.2/+0.6 | -0.2/+1.2 |
| a0 | 0.02 | 0.02 | 0.12 | 0.02 | 0.02 | 0.02 | 0.02 | 0.02 |
The deduced effective temperature (4000-4200 K) of RS Oph corresponds well with the upper limit of the conventional mean values for spectral classes M0–M2 (see http://www.astro.umd.edu/~roger/pubs/mtemps.ps). Perhaps, this is a consequence of irradiating of the photosphere of RS Oph by WD. In general this range of corroborates our expectation that the effect of irradiation of atmosphere of RS Oph should not significantly affect the IR spectra. The effect of irradiation should be more critical for the optical part of the spectrum, especially its blue and UV regions.
The inclusion of even a small amount “veiling” (see Section 3.3) reduces the quality of the fits (see Table 1). This result implies that at the time of our IR observations the contribution of any dust envelope (Evans et al. 2007b) around RS Oph was negligible.
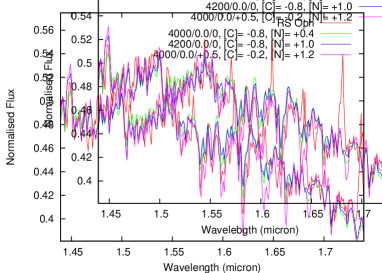
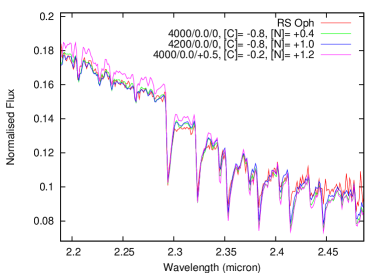
4.3 Fits to the CN and CO bands
We obtain good fits to the CN bands around 1.6m, and to the CO bands around 1.6 (Fig. 4) and 2.3m (Fig. 5). In the 2.3m range both 12CO and 13CO bands are observed and in principle, we can use these to determine the isotopic ratio 12C/13C. However, due to the low spectral resolution of our data, we can only infer a lower limit on the 12C/13C ratio in the RG photosphere, . The model spectra shown in Figs. 4, 5 were computed for 12C/13C, and the general picture is not changed for a somewhat lower value, . We will report better estimates of 12C/13C in forthcoming papers.
5 Discussion and conclusion
Our results are obtained in the ‘classical’ approach, using plane-parallel model atmospheres with no sinks or sources of energy. However, at the time of our observation, the IR spectrum displayed strong H and He lines from the shocked wind and ejecta (Evans et al. 2007b). RS Oph is (following outburst) known to be a strong source of x-radiation and in principle, the flux of high energy photons could change the outermost layers of RG atmosphere. However, the IR flux originates deep in the atmosphere of the RG, so that a thick slab of cool material lies above the IR photosphere: high energy photons cannot penetrate these layers and are not likely to affect our general conclusions. We will be assessing the effects of irradiation as the RG is observed with the WD in different orbital configurations.
There is evidence for a modest deficit of carbon, and overabundance of nitrogen, in the atmosphere of the RG. It may be that carbon was converted to nitrogen in the CN cycle (see Sneden et al. 2000) during the previous evolution of the secondary. Alternatively, there may have been some pollution of the RG surface by products of former eruptions. Nevertheless, the C and N abundance, together with the 12C/13C ratio when it becomes available, will provide new constraints for theoretical models of the TNR and its aftermath.
Furthermore, determination of the oxygen abundance in the atmosphere of the RG will be of crucial importance for two reasons: first, oxygen cannot be formed in the interiors of low and intermediate mass stars and second, oxygen may have been produced in past RN eruptions. In any case, the determination of the oxygen abundance should clarify the origin of the carbon and nitrogen abundances.
Our UKIRT RS Oph programme is ongoing and in future papers we will address the effects of irradiation, the 12C/13C ratio.
Acknowledgements.
The United Kingdom Infrared Telescope is operated by the Joint Astronomy Centre on behalf of the U.K. Science and Technology Facilities Council (STFC). This work used the research computing facilities at the Centre for Astrophysics Research, University of Hertfordshire. This work was supported by an International Joint Project Grant from the UK Royal Society and the “Microcosmophysics” program of the National Academy of Sciences and Space Agency of Ukraine.References
- Anders & Grevesse (1989) Anders, E., Grevesse, N., 1989, GeGoAA, 53, 197.
- Barber et al. (2006) Barber, R. J., Tennyson, J., Harris, G. J., Tolchenov, R. N., 2006, MNRAS,368, 1087.
- Bode & Kahn (1985) Bode, M. F., & Kahn, F., 1985, MNRAS, 217, 205
- Bode et al. (2006) Bode, M. F., O’Brien, T. J., Osborne, J. P., Page, K. L., Senziani, F., Skinner, G. K. et al., 2006, ApJ, 652, 629
- Das et al. (2006) Das, R., Banerjee, D. P. K., Ashok, N. M., 2006, ApJ, 653, L141
- Evans et al. (2005) Evans A., Tyne, V. H., Smith, O., Geballe, T. R., Rawlings, J. M. C., Eyres, S. P. S. 2005, MNRAS, 360, 1483
- Evans et al. (2007a) Evans A. Kerr, T., Yang, Bin, Matsuoka, Y., Tsuzuki, Y., Bode, M. F., Eyres, S. P. S., Geballe, T. R. et al., 2007a, MNRAS, 374, L1
- Evans et al. (2007b) Evans A., Woodward, C. E., Helton, L. A., Gehrz, R. D., Lynch, D. K., Rudy, R. J., Russell, R. W., Kerr, T. et al., 2007b, ApJ, 663, L29
- Evans et al. (2008) Evans, A., Bode M. F., O’Brien, T. J. 2008, eds, RS Ophiuchi (2006) and the Recurrent Nova Phenomenon,, ASP Conference Series, in press
- Fekel et al. (2000) Fekel F. C., Joyce R. R., Hinkle K. H., Skrutsie M. F., 2000, AJ, 119, 1375
- Foy (1978) Foy, R., 1978, A&A, 67, 311
- Goorvitch (1994) Goorvitch, D., 1994, ApJS, 95, 535
- Kupka et al. (1999) Kupka, F., Piskunov, N., Ryabchikova, T.A., Stempels, H. C., Weiss, W. W., 1999, A&AS, 138, 119
- Kurucz (1993) Kurucz., 1993, CD ROM 9, 18. Harvard-Smisthonian Observatory
- Kurucz (1999) Kurucz, R. L., 1999, http://kurucz.harvard.edu
- Narumi et al. (2006) Narumi, H. et al., 2006, IAUC8671
- Ness et al. (2008) Ness, J.-U., Starrfield, s., Drake, J. J., Bode, M. F., O’Brien, T. J., Evans, A., Eyres, S. P. S., Helton, L. A., Osborne, J. P., Page, K. L., Schneider, C., Woodward, C. E. 2008, ApJ, submitted
- Ness et al. (2007) Ness, J.-U., Starrfield, S., Beardmore, A. P., Bode, M. F., Drake, J. J., Evans, A., Gehrz, R. D. et al. 2007, ApJ, 665, 1334.
- O’Brien et al. (2006) O’Brien, T. J. et al., 2006, Nature, 442, 279.
- Pavlenko (1997) Pavlenko, Ya.V. 1997, Ap&SS, 253, 43.
- Pavlenko (2000) Pavlenko Ya.V. 2000, Astron. Rept, 44, 219.
- Pavlenko & Geballe (2002) Pavlenko, Ya. V., Geballe, T. R., 2002, A&A, 390, 621
- Pavlenko & Jones (2002) Pavlenko, Ya. V., Jones, H. R. A., 2002, A&A, 396, 967
- Pavlenko (2003) Pavlenko, Ya. V., 2003, Astron. Rept., 47, 59
- Pavlenko et al. (2004) Pavlenko, Ya. V., Geballe, T. R, Evans, A., Smalley, B., Eyres, S. P. S., Tyne, V. H., Yakovina, L. A. 2004, A&A, 417, L39
- Plez (1998) Plez, B., 1998, A&A, 337, 495
- Rosino (1987) Rosino, L., 1987, in RS Ophiuchi (1985) and the recurrent nova phenomenon, ed Bode M. F., VNU Science press, Utrecht (in press)
- Scott et al. (1994) Scott, A. D., Rawlings, J. M. C., Krautter, J., Evans, A., MNRAS, 268, 749.
- Shore et al. (1996) Shore S. N., Kenyon S. J., Starrfield S., Sonneborn, G., 1996, ApJ, 456, 717
- Sneden et al. (1976) Sneden, C., Johnson, H. R., Krupp, B. M.,1976, ApJ, 204, 218
- Sneden et al. (2000) Sneden, C., Ivans, I. I., Kraft, R. P. 2000, MmSAI, 71, 657.
- Snijders (1987) Snijders, M. A. J., 1987, in RS Ophiuchi (1985) and the recurrent nova phenomenon, p. 51 ed Bode M. F., VNU Science press, Utrecht
- Starrfield et al. (2004) Starrfield, S., Timmes, F. X., Hix, W. R., Sion, E. M., Sparks, W. M., Dwyer, S. J., 2004, ApJ, 612, L53
- Unsold (1955) Unsold, A. 1955, Physics der Sternatmospharen, Springer, Berlin
- Wallerstein et al. (2006) Wallerstein, G., Harrison, T., Munari, U., 2006, BAAS, 38, 1160.
- Wood-Vasey & Sokoloski (2006) Wood-Vasey, W. M., Sokoloski, J. L., 2006, ApJ, 645, L53
- Woodward et al. (2008) Woodward, C. E., Helton, L. A., Evans, A., van Loon, J. Th., et al. 2008 in RS Ophiuchi (2006), eds. A. Evans, M. F. Bode, & T. J. O’Brien, ASP Conf. Ser., in press