Phonon and crystal field excitations in geometrically frustrated rare earth titanates
Abstract
The phonon and crystal field excitations in several rare earth titanate pyrochlores are investigated. Magnetic measurements on single crystals of Gd2Ti2O7, Tb2Ti2O7, Dy2Ti2O7 and Ho2Ti2O7 are used for characterization, while Raman spectroscopy and terahertz time domain spectroscopy are employed to probe the excitations of the materials. The lattice excitations are found to be analogous across the compounds over the whole temperature range investigated (295-4 K). The resulting full phononic characterization of the R2Ti2O7 pyrochlore structure is then used to identify crystal field excitations observed in the materials. Several crystal field excitations have been observed in Tb2Ti2O7 in Raman spectroscopy for the first time, among which all of the previously reported excitations. The presence of additional crystal field excitations, however, suggests the presence of two inequivalent Tb3+ sites in the low temperature structure. Furthermore, the crystal field level at approximately 13 cm-1 is found to be both Raman and dipole active, indicating broken inversion symmetry in the system and thus undermining its current symmetry interpretation. In addition, evidence is found for a significant crystal field-phonon coupling in Tb2Ti2O7. These findings call for a careful reassessment of the low temperature structure of Tb2Ti2O7, which may serve to improve its theoretical understanding.
pacs:
63.20.dd, 71.70.Ch, 75.50.Lk, 75.30.CrI Introduction
The term ’geometrical frustration’Ramirez (1994); Schiffer and Ramirez (1996); Diep (1994) applies to a system, when it is unable to simultaneously minimize all of its magnetic exchange interactions, solely due to its geometry. Magnetically interacting spins residing on such lattices are unable to order into a unique magnetic ground state due to the competing magnetic interactions between different lattice sites. Instead of selecting a single, unique magnetic ground state at low temperatures, a pure magnetically frustrated system has a macroscopically degenerate ground state. In real systems however, any secondary, smaller term (arising from single-ion or exchange anisotropy, further neighbor interactions, dipolar interactions, small lattice distortions or a magnetic field, for example) in the system’s Hamiltonian can favor certain magnetic ground states at very low temperatures, thereby (partially) lifting this peculiar degeneracy. In this fact lies the origin of the vast richness and diversity of the low temperature magnetic behavior of different frustrated systems in natureGreedan (2006, 2001); Collins and Petrenko (1997); Ramirez (1994); Moessner (2001).
Geometries suitable to exhibit frustration typically consist of infinite networks of triangles or tetrahedra, which share one or more lattice sites. One of the most common structures known to be able to induce magnetic frustration is that of the pyrochlores, A2B2O7, where both the A3+ ions (rare earth element, coordinated to 8 O atoms) and the B4+ ions (transition metal element, coordinated to 6 O atoms) reside on a lattice of corner-sharing tetrahedra, known as the pyrochlore lattice. Thus, if either A3+ or B4+ is a magnetic species, frustration may occur due to competing interactions. A subclass of the pyrochlores is formed by the rare earth titanate family, R2Ti2O7, where the R3+ ion is the only (para-)magnetic species, since Ti4+ is diamagnetic (). For the pyrochlore lattice, both theoryVillain (1979); Reimers et al. (1991); Moessner and Chalker (1998) and Monte Carlo simulationsMoessner and Chalker (1998); Reimers (1992) predict a ’collective paramagnetic’ ground state, or the lack of long range magnetic ordering, for classical Heisenberg spins at finite temperature. The quantum Heisenberg spin (S = 1/2) model for the pyrochlore lattice also predicts a quantum disordered system at finite temperatures, a state often referred to as a ’spin liquid’Canals and Lacroix (1998). However, in reality the different perturbative terms in the corresponding Hamiltonian result in quite diverse low temperature magnetic behavior among the different rare earth titanatesGreedan (2006), of which the Gd, Tb, Ho and Dy variants are studied here.
The supposedly least complex case is that of gadolinium titanate, Gd2Ti2O7. The Gd3+ ion has, in contrast to the Tb3+, Ho3+ and Dy3+ ions, a spin only () ground state, rendering the influence of crystal field levels and possible induced Ising-like anisotropy insignificant in Gd2Ti2O7. The experimentally determined Curie-Weiss temperature of Gd2Ti2O7 is KRaju et al. (1999); Cashion et al. (1968); Ramirez et al. (2002), indicating antiferromagnetic nearest neighbor interactions. Thus, Gd2Ti2O7 could be considered as an ideal realization of the frustrated Heisenberg antiferromagnet with dipolar interactions. Experimentally, Gd2Ti2O7 has been found to undergo a magnetic ordering transition at 1 KRaju et al. (1999). However, this transition corresponds to only partial ordering of the magnetic structure, as only 3 spins per tetrahedron orderChampion et al. (2001). In this partially ordered state the spins residing on the [111] planes of the crystal (which can be viewed as Kagomé planes) are ordered in a configuration, parallel to the Kagomé plane, while the spins residing on the interstitial sites remain either statically or dynamically disordered Stewart et al. (2004). Subsequent experimental investigations revealed a second ordering transition at 0.7 K, corresponding to the partial ordering of the interstitial disordered spinsStewart et al. (2004); Ramirez et al. (2002) which, however, do remain (partially) dynamic down to 20mK.Yaouanc et al. (2005); Dunsiger et al. (2006) Despite of Gd2Ti2O7 supposedly being well approximated by the Heisenberg antiferromagnet with dipolar interactions, theoretical justification for this complex magnetic behavior remains difficultRaju et al. (1999); Palmer and Chalker (2000); Yaouanc et al. (2005).
In Tb2Ti2O7, the dominant interactions are antiferromagnetic, as indicated by the experimentally determined Curie-Weiss temperature, KGardner et al. (1999). A study of the diluted compound (Tb0.02Y0.98)2Ti2O7 revealed that the contribution to due to exchange and dipolar interactions is K, comparable to the -value found in Gd2Ti2O7Gingras et al. (2000). Despite the energy scale of these interactions, the Tb3+ moments do not show long range magnetic order down to as low as 50 mK, making it the system closest to a real 3D spin liquid to dateGardner et al. (1999, 2003). However, crystal field (CF) calculations indicate a ground state doublet and Ising-like easy axis anisotropy for the () Tb3+ magnetic moments along their local directions (the direction towards the center of the tetrahedron the particular atom is in), which would dramatically reduce the degree of frustration in the systemGingras et al. (2000); Rosenkranz et al. (2000a); Mirebeau et al. (2007); Malkin et al. (2004); Gardner et al. (2001). Theoretical models taking this anisotropy into account predict magnetic ordering temperatures of about 1 KGingras et al. (2000); den Hertog and Gingras (2000). Subsequent theoretical work suggests that the magnetic moment anisotropy is more isotropic than Ising-like, which could suppress magnetic orderingKao et al. (2003). Recently, Tb2Ti2O7 was argued to be in a quantum mechanically fluctuating ’spin ice’ stateice ; Molavian et al. (2007). Virtual quantum mechanical CF excitations (the first excited CF doublet is separated by only cm-1 from the ground state doubletGingras et al. (2000); Mirebeau et al. (2007); Gardner et al. (2001)) are proposed to rescale the effective theoretical model from the unfrustrated Ising antiferromagnet to a frustrated resonating spin ice model. Nevertheless, the experimentally observed lack of magnetic ordering down to the millikelvin range and the true magnetic ground state in Tb2Ti2O7 remain as of yet enigmaticEnjalran et al. (2004); Molavian et al. (2007); Ehlers et al. (2004); Curnoe (2007).
Illustrating the diversity in magnetic behavior due to the subtle differences in the rare earth species of the titanates, the situation in both Dy2Ti2O7Ramirez et al. (1999); Snyder et al. (2004); Ramirez et al. (2000) and Ho2Ti2O7Harris et al. (1997); Bramwell et al. (2001); Cornelius and Gardner (2001); Petrenko et al. (2003) is again different. The R3+ ions in these compounds have a (Dy3+) and a (Ho3+) ground state, respectively, with corresponding free ion magnetic moments (Dy3+) and (Ho3+). These systems were first thought to have weak ferromagnetic nearest neighbor exchange interactions, as indicated by the small positive values of , K and K for Dy2Ti2O7 and Ho2Ti2O7, respectively Bramwell et al. (2000). More recently, however, the nearest neighbor exchange interactions in Dy2Ti2O7 and Ho2Ti2O7 were argued to be antiferromagnetic Melko and Gingras (2004). The effective ferromagnetic interaction between the spins in fact is shown to be due to the dominant ferromagnetic long-range magnetic dipole-dipole interactionsden Hertog and Gingras (2000); Bramwell and Gingras (2001). The R3+-ions in both Dy2Ti2O7 and Ho2Ti2O7 are well described by a well separated Ising doublet (first excited states are at and cm-1 ,respectivelyRosenkranz et al. (2000a)) with a strong single ion anisotropy along the local directions. Unlike for antiferromagnetically interacting spins with local Ising anisotropy, ferromagnetically interacting Ising spins on a pyrochlore lattice should be highly frustratedHarris et al. (1997); Bramwell and Harris (1998). As Anderson already pointed out half a century agoAnderson (1956), the resulting model is analogous to Pauling’s ice modelPauling (1935), which earned both Dy2Ti2O7 and Ho2Ti2O7 the title of ’spin ice’ compoundHarris et al. (1997); Bramwell and Harris (1998); Bramwell and Gingras (2001); Isakov et al. (2005). Although numerical simulations predict long range order at low temperatures for this modelMelko and Gingras (2004), experimental studies report no transition to a long range ordered state for either Dy2Ti2O7den Hertog and Gingras (2000); Ramirez et al. (1999); Fukazawa et al. (2002); Fennell et al. (2002) or Ho2Ti2O7Harris et al. (1997, 1998); Mirebeau et al. (2006), down to as low as 50 mK.
As is apparent from above considerations, the low temperature magnetic behavior of the rare earth titanates is dictated by the smallest of details in the structure and interactions of the material. Therefore, a comprehensive experimental study of the structural, crystal field and magnetic properties of these systems may serve to clarify unanswered questions in their understanding. In this paper, dc magnetic susceptibility measurements, polarized Raman scattering experiments and terahertz time domain spectroscopy on aforementioned members of the rare earth titanates family are employed to gain more insight into the details that drive them towards such diverse behavior. Raman scattering allows for simultaneous investigation of structural and crystal field (CF) properties through the observation of both phononic and CF excitations, while the comparison between the various members helps identify the nature of the different excitations observed.
II Experimental
II.1 Sample Preparation
Polycrystalline samples of R2Ti2O7 (where R = Gd, Tb, Dy, Ho) were synthesized by firing stoichiometric amounts of high purity () TiO2 and the appropriate rare earth oxide (Gd2O3, Tb4O7, Dy2O3 or Ho2O3, respectively), in air, for several days with intermittent grindings. The resulting polycrystalline powder was subsequently prepared for single crystal growth, using the method described by Gardner, Gaulin and PaulGardner et al. (1998). The following single crystal growth (also done as described in ref. 49) using the floating zone technique yielded large, high quality single crystals of all of the R2Ti2O7 variants. Discs ( 1 mm thickness) with a,b-plane surfaces were cut from oriented single crystals and subsequently polished, in order to optimize scattering experiments. The Tb2Ti2O7 sample used in Raman experiments was subsequently polished down to 250 m thickness to facilitate THz transmission measurements.
II.2 Instrumentation
X-ray Laue diffraction, using a Philips PW 1710 diffractometer equipped with a Polariod XR-7 system, was employed to orient the single crystal samples of Gd2Ti2O7 and Tb2Ti2O7 for the polarized Raman spectroscopy experiments, while simultaneously confirming the single crystallinity of the samples. The Dy2Ti2O7 and Ho2Ti2O7 single crystals were oriented using an Enraf Nonius CAD4 diffractometer.
The magnetic susceptibilities of the obtained rare earth titanates were measured using the Quantum Design MPMS-5 SQUID magnetometer of the ’Laboratoire de Physico-Chimie de l’Etat Solide’ (LPCES), CNRS, UMR8182 at the ’Université Paris-Sud in Orsay, France. The R2Ti2O7 samples, about 100 mg of single crystal (in the form of discs of approximately 4 mm diameter and 1 mm thickness), were placed in cylindrical plastic tubes and locked in position. Next, the samples were zero-field-cooled down to 1.7 K, after which the magnetization of the sample was measured as a function of the temperature in an applied magnetic field of 100 Oe, while warming the sample.
Polarization controlled, inelastic light scattering experiments were performed on all oriented R2Ti2O7 samples. The experiments were performed in a backscattering configuration, using a triple grating micro-Raman spectrometer (T64000 Jobin-Yvon), consisting of a double grating monochromator (acting as a spectral filter) and a polychromator which disperses the scattered light onto a liquid nitrogen cooled CCD detector. The frequency resolution was better than 2 cm-1 for the frequency region considered. The samples were placed in a liquid helium cooled optical flow-cryostat (Oxford Instruments). The temperature was stabilized with an accuracy of 0.1 K in the whole range of measured temperatures (from 2.5 to 295 K). The 532.6 nm (frequency doubled) output of a Nd:YVO4 laser was focused on the Gd2Ti2O7, Tb2Ti2O7 and Dy2Ti2O7 samples using a 50x microscope objective and used as excitation source in the scattering experiments. A Krypton laser (676.4 nm) was used as the excitation source for the scattering experiments on the Ho2Ti2O7 sample, since 532.6 nm excitation (resonant at low temperatures in case of Ho2Ti2O7) results in fluorescence dominating the inelastic scattering spectrum in the 5-800 cm-1 spectral range. The power density on the samples was of the order of 50 W/m2 in all cases. The polarization was controlled both on the incoming and outgoing beam. Parallel () and perpendicular () measurements on Gd2Ti2O7 and Tb2Ti2O7 were performed along crystallographic axes of the a,b surface of the samples, Porto notations c(aa)c and c(ab)c, respectively. Unfortunately, the orientation of the a and b axes in the (a,b) plane of the Dy2Ti2O7 and Ho2Ti2O7 surfaces with respect to the light polarizations was not known. Analogous Porto notations are c(xx)c () and c(xy)c (), respectively, where x is a direction in the (a,b) plane of the sample making an undetermined angle with the a axis, while y, in the same a,b plane of the crystal, is perpendicular to the x direction. Raman spectra were fitted with lorentzian lineshapes to extract mode parameters.
Terahertz time domain spectroscopy (THz TDS)Schmuttenmaer (2004) was performed on Tb2Ti2O7 using a home made setup similar to those described elsewhereBeard et al. (2000); Schmuttenmaer (2004). THz pulses (pulse duration of several ps, frequency range 0.3-2.5 THz) were generated through a difference frequency generation process in a ZnTe single crystal upon pulsed excitation (120 fs, 800 nm) by an amplified Ti:sapphire system. The magnitude of the time dependent electric field transmitted through the sample (w.r.t. that transmitted through vacuum) was measured at various temperatures, through electro-optic sampling in a second ZnTe single crystal, using 800 nm pulses of approximately 120 fs. The sample used was a thin slice of single crystalline Tb2Ti2O7 (the same sample as used in the Raman experiments), which was mounted on a copper plate with an aperture ( 2 mm) and placed in a liquid helium cooled optical flow-cryostat (Oxford Instruments). The polarization of the THz radiation was parallel to the crystallographic a-axis.
III Results and Discussion
III.1 Magnetic Measurements
The magnetic susceptibility , defined as the ratio of the magnetization of the sample to the applied magnetic field, of all the rare earth titanate samples was measured in a 100 Oe applied magnetic field. Since the samples used were plate-like discs, the data have been corrected by a demagnetization factor as calculated for flat, cylindrical platesSato and Ishii (1989). Fig. 1 shows the inverse molar susceptibilities of all samples in the low temperature regime. For each sample, the data was fitted to a Curie-Weiss form for the molar magnetic susceptibility of an antiferromagnet:
| (1) |
where C is the Curie constant in CGS units (, in [emuKmol-1]), is the expected transition temperature (giving an indication of the sign of the magnetic interactions) and is a temperature independent Van Vleck contribution to the susceptibility. The model was fitted to high temperature experimental data (100 K and up, where the demagnetization correction is of the order of 1 %) and linear regression analysis of yielded the experimental values for , and . These are tabulated below in table 1, together with several values reported in literature.

| Compound i | |||
|---|---|---|---|
| Gd2Ti2O7 (exp.) | -11(2) | 0111When fitting with a nonzero B term, it becomes negligibly small. The best fit is obtained with B=0. | |
| Gd2Ti2O7 (lit.)Raju et al. (1999) | -9,6 | - | |
| Gd2Ti2O7 (lit.)Cashion et al. (1968) | -11,7 | - | |
| Gd2Ti2O7 (lit.)Bramwell et al. (2000) | -8,95(6) | ||
| Tb2Ti2O7 (exp.) | -18(2) | ||
| Tb2Ti2O7 (lit.)Gardner et al. (1999); Gingras et al. (2000) | -19 | - | |
| Dy2Ti2O7 (exp.) | 2(2) | -222Since dipolar interactions are dominant in this case, no reliable values were extracted (see text). | -222Since dipolar interactions are dominant in this case, no reliable values were extracted (see text). |
| Dy2Ti2O7 (lit.)Bramwell et al. (2000) | 1,0 | ||
| Ho2Ti2O7 (exp.) | 6(2) | -222Since dipolar interactions are dominant in this case, no reliable values were extracted (see text). | -222Since dipolar interactions are dominant in this case, no reliable values were extracted (see text). |
| Ho2Ti2O7 (lit.)Bramwell et al. (2000) | 2,0 |
In general, the experimentally obtained data compare (where possible) favorable to the various values reported in literature (table 1). The extracted parameters for Dy2Ti2O7 and Ho2Ti2O7 do slightly deviate from literature values, presumably due to the estimation of the demagnetization factor (fits to the present uncorrected data yield values of approximately 1 and 2 K, respectively). The experimentally determined paramagnetic moments obtained for Gd2Ti2O7 and Tb2Ti2O7 are also in excellent agreement with the corresponding free ion values, which are = 7.94 and = 9.72 for the Gd3+ () and Tb3+ () free ions, respectively. The large negative Curie-Weiss temperatures for Gd2Ti2O7 and Tb2Ti2O7 indicate antiferromagnetic exchange coupling. In contrast, the small, positive values for Ho2Ti2O7 and Dy2Ti2O7 initially led to the assumption of weak ferromagnetic exchange interactions between nearest neighbor Dy3+ and Ho3+ ionsBramwell et al. (2000). As stated above, however, since the Ho3+ and Dy3+ ions have a large magnetic moment (free ion values are = 10.607 ( ground state) and = 10.646 ( ground state), respectively), the dipolar interactions between neighboring R3+ ions are dominating the effective nearest neighbor (n.n.) interactions. The n.n. exchange interactions are in fact antiferromagneticMelko and Gingras (2004), while the dominant dipolar n.n. interactions are of ferromagnetic natureden Hertog and Gingras (2000); Bramwell and Gingras (2001). Consequently, the effective n.n. interactions are slightly ferromagnetic, resulting in the positive values. Another consequence of the dipolar interactions and being dominant is the fact that extracting the real values of and from the inverse susceptibility curves becomes non-trivial, since more elaborate models taking the dipolar interaction into account are needed.
III.2 Raman Spectroscopy
III.2.1 Room temperature spectra
To determine the Raman active vibrations of the single crystals, group theory analysis was employed. This predicts that, for the cubic rare earth titanate structure (R2Ti2O7) of space group Fd3̄m (Oh7), the sublattices of the unit cell span the following irreducible representations:
This makes the following decomposition into zone center normal modes (excluding the F1u acoustic mode):
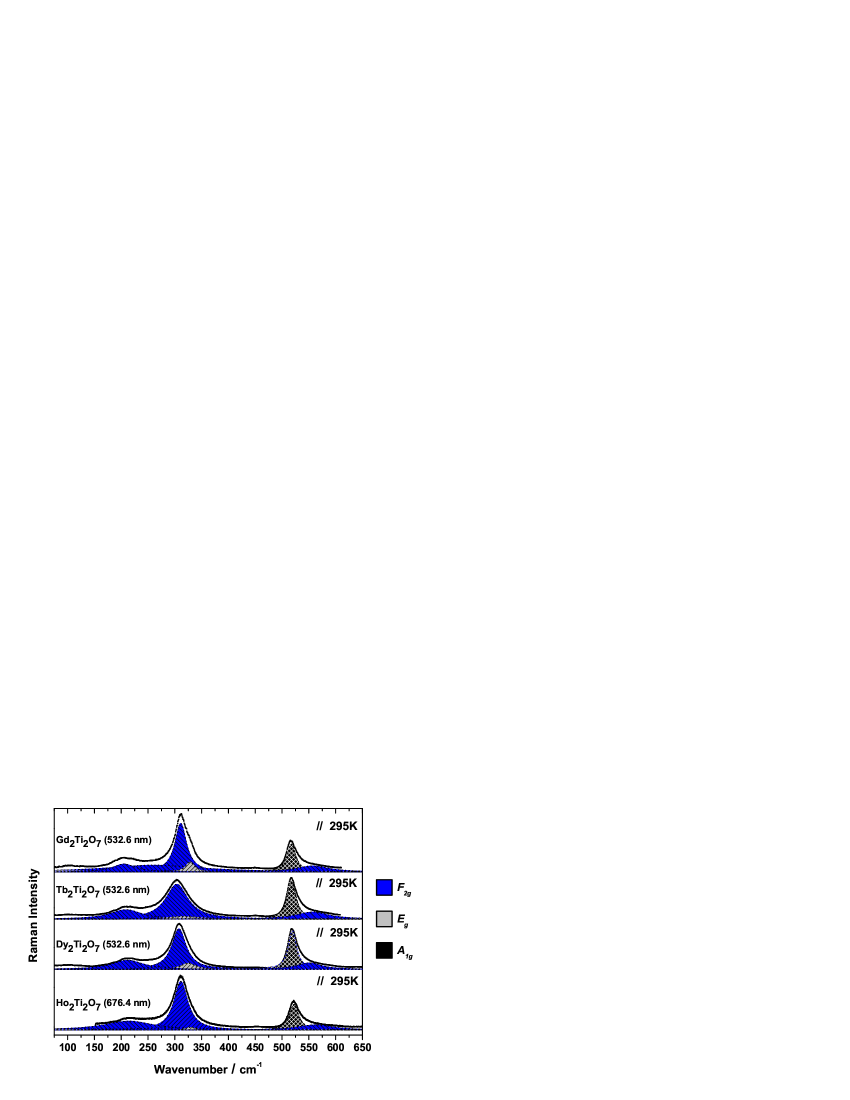
Of these normal modes, only the , and the 4 modes are Raman active. The 7 modes are infrared active and the remaining modes are optically inactive. The symmetry coordinates for the optically active normal modes are given by Gupta et al.Gupta et al. (2001a). Based on the symmetries of the Raman active modes, the A1g and Eg modes are expected to be observed in parallel polarization () spectra, while the F2g modes are expected in the perpendicular polarization () spectra. Surprisingly, the room temperature spectra of R2Ti2O7 show all the Raman active modes in both polarizations. Angle dependent Raman measurements (varying the angle between the incoming light polarization and the b-axis from to ) reveal no orientation in which the theoretical selection rules are fully obeyed. Polycrystallinity and/or crystalline disorder is however, not believed to be the cause, since other techniques (X-ray Laue diffraction, magnetic measurements) reveal no such signs. Also, to our best knowledge, no Raman spectrum of any of these rare earth titanates fulfilling their phononic selection rules has been published. Although no full compliance of phononic selection rules was observed, the nature of the Raman active modes was clearly identified, through their angular dependence. Their assignment is indicated in fig. 2 as well as in table 2. The figure depicts the room temperature (RT), parallel polarization spectra of the rare earth titanates and the corresponding modes. The assignment of the mode symmetries is based on comparison with assignments in previous works on theseSaha et al. (2006); Zhang and Saxena (2005); Mori et al. (2003); Hess et al. (2002); Gupta et al. (2001a); Vandenborre and Husson (1983) and relatedBrown et al. (2003); Glerup et al. (2001); Gupta et al. (2001b, 2002); Vandenborre and Husson (1983); Vandenborre et al. (1983) compounds (see table 2), on aforementioned measurements (not shown) of the angular dependence of mode intensities and on the temperature dependence of the modes (vide infra).
| This work | Saha et al.Saha et al. (2006) | Zhang et al.Zhang and Saxena (2005) | Mori et al.Mori et al. (2003) | Hess et al.Hess et al. (2002) | Gupta et al.Gupta et al. (2001a) | Vandenborre et al.Vandenborre and Husson (1983) | ||||
| R = Gd | Tb | Dy | Ho | Gd | Gd | Gd | Gd | Gd (calcd.) | Gd (obs.) | Gd |
| 104111These modes are very weak and barely resolved, therefore their exact position is estimated. | 102111These modes are very weak and barely resolved, therefore their exact position is estimated. | 103111These modes are very weak and barely resolved, therefore their exact position is estimated. | 105111These modes are very weak and barely resolved, therefore their exact position is estimated. (-) | - (-) | - (-) | 105 (F2g) | - (-) | - (-) | - (-) | 110 (-) |
| 128111These modes are very weak and barely resolved, therefore their exact position is estimated. | - | 124111These modes are very weak and barely resolved, therefore their exact position is estimated. | 122111These modes are very weak and barely resolved, therefore their exact position is estimated. (-) | - (-) | - (-) | 125 (222Mori et al. ascribe this band to trace amounts of Gd2O3.) | - (-) | - (-) | - (-) | 215 (-) |
| 205 | 209 | 212 | 214 (F2g) | 215 (F2g) | 210 (F2g) | 222 (F2g) | 219 (F2g) | 230.6 (F2g) | 225 (F2g) | 225 (F2g) |
| 260 | 256 | 269 | 297 (F2g) | - (-) | - (-) | - (-) | - (-) | - (-) | - (-) | - (-) |
| 310 | 303 | 308 | 311 (F2g) | 312 (F2g) | 310444Zhang et al. indicate the lower and higher wavenumber components of this band as the Eg and F2g modes, respectively. (Eg) | 311 (Eg) | 312 (Eg) | 318.0 (Eg) | - (-) | 317 (F2g) |
| 325 | 313 | 328 | 329 (Eg) | 330 (Eg) | 310444Zhang et al. indicate the lower and higher wavenumber components of this band as the Eg and F2g modes, respectively. (F2g) | - (-) | - (-) | 328.2 (F2g) | 317 (F2g) | 347555This band has been calculated, rather than observed by Vandenborre et al. (Eg) |
| 450333This is a very weak mode, barely resolved above the noise. Mori et al. ascribe this mode to trace amounts of TiO2. | 450333This is a very weak mode, barely resolved above the noise. Mori et al. ascribe this mode to trace amounts of TiO2. | 451333This is a very weak mode, barely resolved above the noise. Mori et al. ascribe this mode to trace amounts of TiO2. | 452333This is a very weak mode, barely resolved above the noise. Mori et al. ascribe this mode to trace amounts of TiO2. (-) | - (-) | 470 (F2g) | 452 (-) | 455 (F2g) | - (-) | - (-) | - (-) |
| - | - | - | - (-) | - (-) | - (-) | - (-) | - (-) | 522.2 (F2g) | - (-) | - (-) |
| 517 | 518 | 519 | 522 (A1g) | 518 (A1g/F2g) | 520 (A1g) | 518 (F2g) | 519 (A1g) | 526.8 (A1g) | 515 (A1g) | 515 (A1g+F2g) |
| 554 | 557 | 550 | 562 (F2g) | 547 (F2g) | 570 (F2g) | 585 (F2g) | 549 (F2g) | 594.0 (F2g) | 580 (F2g) | 580 (F2g) |
| 677666These overlapping modes comprise a weak band, in which the two modes cannot be separately resolved. | 689666These overlapping modes comprise a weak band, in which the two modes cannot be separately resolved. | 693666These overlapping modes comprise a weak band, in which the two modes cannot be separately resolved. | 701666These overlapping modes comprise a weak band, in which the two modes cannot be separately resolved. (-) | 684 (-) | - (-) | - (-) | 680 (F2g) | - (-) | - (-) | - (-) |
| 703666These overlapping modes comprise a weak band, in which the two modes cannot be separately resolved. | 706666These overlapping modes comprise a weak band, in which the two modes cannot be separately resolved. | 720666These overlapping modes comprise a weak band, in which the two modes cannot be separately resolved. | 724666These overlapping modes comprise a weak band, in which the two modes cannot be separately resolved. (-) | 701 (-) | - (-) | - (-) | - (-) | - (-) | - (-) | 705 (-) |
Comparison between the RT Raman spectra yields the conclusion that the nature of the R3+ ion has only slight influence on the Raman active vibrational modes. This is not surprising, since in all the Raman active modes only the oxygen atoms are displacedSaha et al. (2006); Gupta et al. (2001a). Consequently, there is no obvious systematic variation of the phonon frequencies with the mass of the respective rare earth ions, as has been noted before for the rare earth titanatesGupta et al. (2001a), hafnatesGupta et al. (2002), manganatesBrown et al. (2003) and stannatesGupta et al. (2001b). The assignment of the R2Ti2O7 modes in literature has been mostly consistent (see Table 2), yet there are a few debated details. There is general agreement on the nature of the modes at 210 cm-1 (F2g, O(2)-sublattice modeSaha et al. (2006)), 519 cm-1 (A1g, R-O stretching modeMori et al. (2003); Zhang and Saxena (2005)) and 556 cm-1 (F2g, O(1)-sublattice modeSaha et al. (2006)). Temperature and angle dependent Raman measurements show the band around 315 cm-1 to consist of two modes, a F2g mode around 310 cm-1 (O-R-O bending modeMori et al. (2003); Zhang and Saxena (2005)) and an Eg mode around 327 cm-1 (O(1)-sublattice modeSaha et al. (2006)), as recognized by Saha et al.Saha et al. (2006) and Vandenborre et al.Vandenborre et al. (1983). Earlier works either interchanged the mode assignment within this bandZhang and Saxena (2005); Gupta et al. (2001a) or ascribed the whole band to only one of these modesMori et al. (2003); Hess et al. (2002). However, our temperature and angle dependent measurements confirm the assignment made by Saha et al. The last expected phonon, an F2g mode, has been either not accounted for Gupta et al. (2001a), combined with the A1g mode in one bandSaha et al. (2006); Vandenborre and Husson (1983) or ascribed to low intensity peaks around 105Mori et al. (2003), 450 Zhang and Saxena (2005) or 680Hess et al. (2002) cm-1 in previous works. Here, it is ascribed to a broad, low intensity mode around 260 cm-1. This mode is not clearly resolved in the RT spectra due to the fact that it overlaps largely with the neighboring, strong F2g modes at 210 cm-1 and 309 cm-1. Fitting with those two peaks only, however, does not adequately reproduce the experimental spectral shape in the the 200-300 cm-1 window. Additionally, as the temperature is lowered, the phonon modes sharpen and the existence of this excitation becomes obvious in the spectra. Worth noting are also the two anomalous modes in Tb2Ti2O7 at 303 (F2g) and 313 cm-1 (Eg), which have lower frequencies and wider lineshapes compared to their counterparts in the other, isostructural rare earth titanates.
Next to the expected Raman active vibrations, the spectra in this work show some very weak scattering intensity at low wavenumbers (first two rows in table 2), which has been reported beforeVandenborre and Husson (1983); Mori et al. (2003). Vandenborre et al.Vandenborre and Husson (1983) were unable to account for this intensity in their calculations, while Mori et al.Mori et al. (2003) offer the plausible assignment to trace R2O3 in the system. The latter assignment is also tentatively adopted here. Mori et al. also suggested the ’missing’ mode may be responsible for some of this low wavenumber intensity. Additionally, a weak mode is observed at 450 cm-1 in most R2Ti2O7 compounds, as was also seen before. Zhang et al.Zhang and Saxena (2005) and Hess et al.Hess et al. (2002) ascribed the ’missing’ mode to this feature. Alternatively, Mori et al.Mori et al. (2003) interpreted it as being due to trace amounts of starting compound TiO2, which is knownPorto et al. (1967) to have a phonon at 447 cm-1. The true origin of this mode is at present unclear. Finally, there is some low intensity scattering intensity at higher wavenumbers, around 700 cm-1 (last two rows of table 2). This intensity has been observed beforeMori et al. (2003); Vandenborre and Husson (1983); Saha et al. (2006); Hess et al. (2002); Zhang and Saxena (2005) and is ascribed to forbidden IR modes made active by slight, local non-stoichiometry in the system.Mori et al. (2003); Saha et al. (2006)
III.2.2 Temperature dependence

Raman spectra of the R2Ti2O7 crystals were recorded at temperatures ranging from RT to 4 K. Figure 3 depicts the evolution of both the parallel () and perpendicular () polarization Raman spectra of the R2Ti2O7 crystals with decreasing temperature.
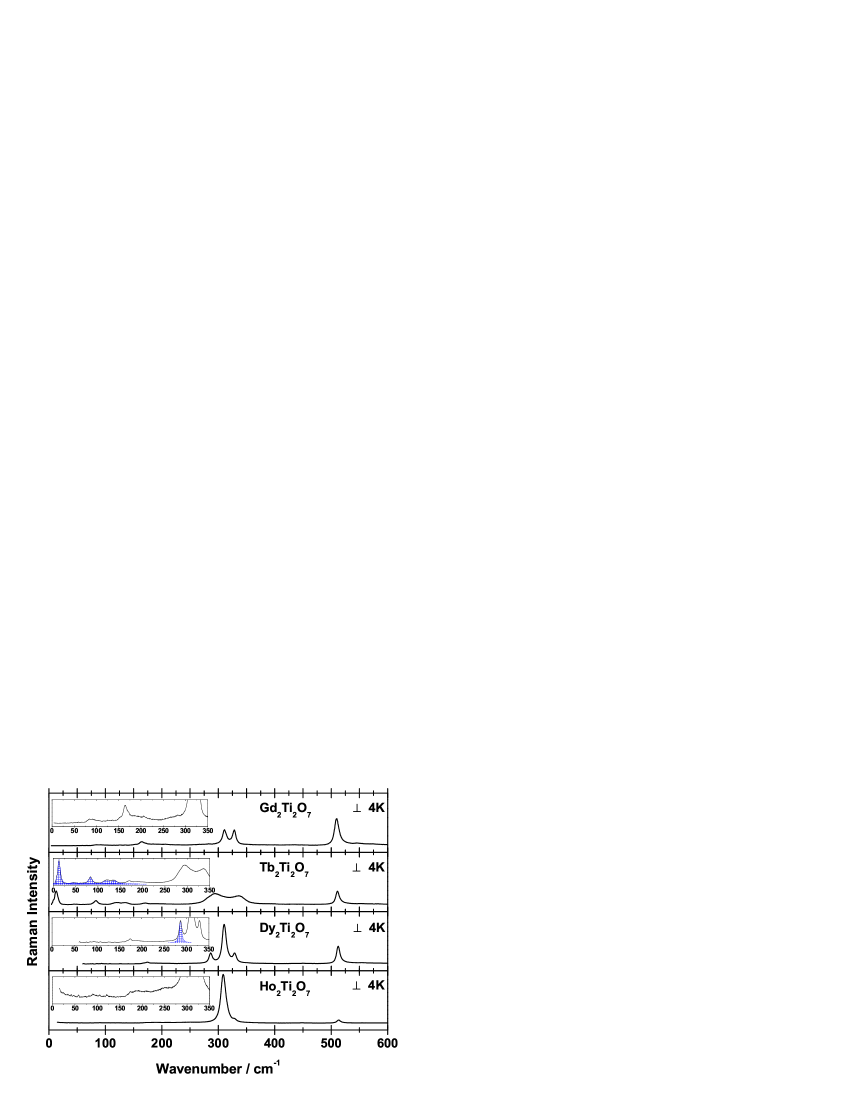
Going down in temperature several spectral changes occur in the Raman spectra. The evolution of the phononic excitations with temperature are very similar in the different R2Ti2O7 lattices. Again, this is not surprising, since only oxygen atoms are displaced in the Raman active phononsSaha et al. (2006); Gupta et al. (2001a). Firstly, the lowest frequency phonon (, 210 cm-1 at RT) shows a strong softening ( 170 cm-1 at 4 K) and sharpening with decreasing temperature, revealing the previously unresolved mode ( 260 cm-1), which also softens ( 190 cm-1), but doesn’t show a strong narrowing. Secondly, the sharpening of both the 309 cm-1 F2g and the 324 cm-1 Eg mode decreases their spectral overlap, clearly justifying the two-mode interpretation of the 315 cm-1 band at RT. Additionally, both modes show a slight softening upon cooldown. Also the A1g phonon ( 519 cm-1) shows the familiar softening ( 511 cm-1) and sharpening trend on cooling. Finally, due to its large width and low intensity, describing the temperature evolution of the highest frequency F2g phonon proves rather difficult, though it seems to soften slightly. Comparison of the R2Ti2O7 spectra in fig. 3 yields the observation that the anomalous phonons (at 303 (F2g) and 313 cm-1 (Eg)) in Tb2Ti2O7 remain wide throughout the temperature range, in contrast to the corresponding modes in the other titanates. Additionally, these modes are shifting in opposite directions in Tb2Ti2O7 only: the F2g mode softens ( 295 cm-1) while the Eg mode considerably hardens ( 335 cm-1). An explanation for this anomalous behavior could be coupling of these phonons to low frequency crystal field excitations of the Tb3+-ions (vide infra).
III.2.3 Crystal field excitations
Aside from the phonons in the Raman spectra of R2Ti2O7, several spectra also show crystal field (CF) excitations of the R3+ ions at low temperatures, as shown in fig. 4. The CF level splitting in the different rare earth ions depends on their electronic configuration and their local surroundings. In the R2Ti2O7 family, the simplest case is that of the Gd3+ ion (4), which has a spin only () ground state, resulting in the absence of a level splitting due to the local crystal field. Consequently, the Raman spectrum of Gd2Ti2O7 shows no CF excitations, making it a suitable ’template’ of the R2Ti2O7 Raman spectrum with lattice excitations only. Combined with the strong correspondence of the phononic excitations in the R2Ti2O7 spectra, it allows for quick identification of CF modes in the other compounds.
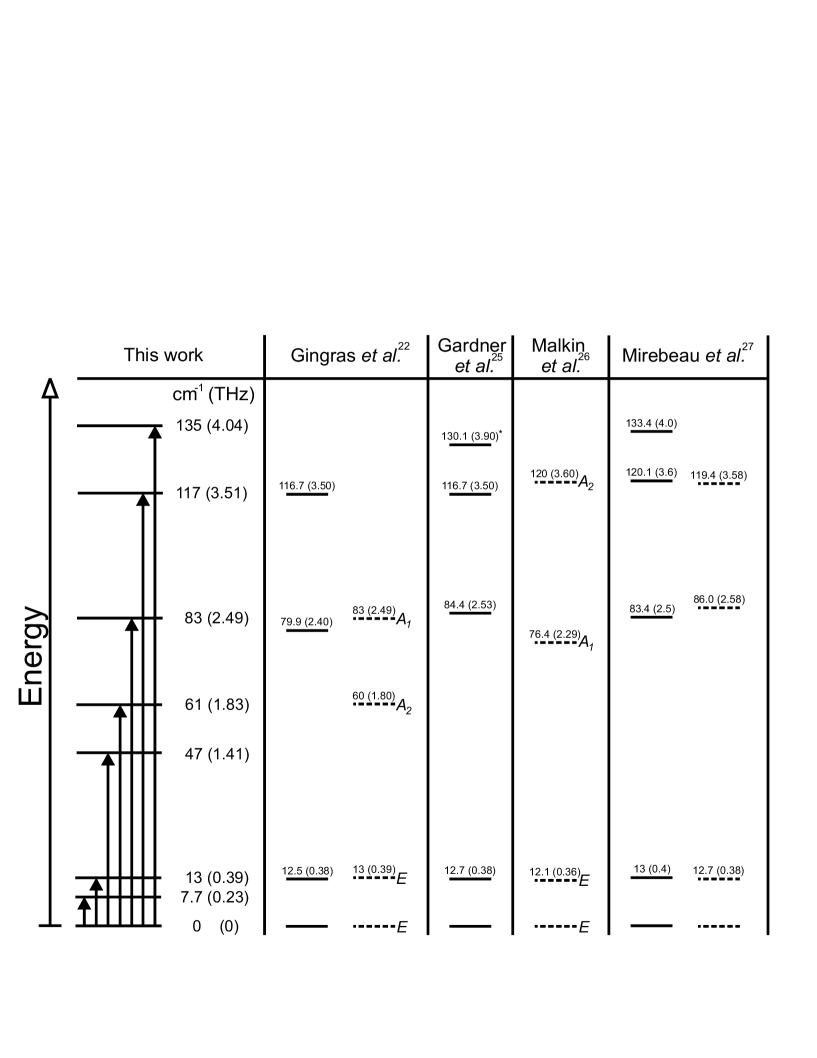
More complicated is the CF level splitting in the Tb3+ ion (4), which has a ground state. Several studies calculating the crystal field for the Tb3+-ion in Tb2Ti2O7Gingras et al. (2000); Mirebeau et al. (2007); Gardner et al. (2001); Malkin et al. (2004), based on inelastic neutron scattering resultsGingras et al. (2000); Gardner et al. (2001); Gaulin et al. (1998); Kanada et al. (1999); Gardner et al. (1999); Mirebeau et al. (2007), yielded slightly differing energy level schemes for the lowest crystal field levels of Tb3+ in Tb2Ti2O7 as is schematically depicted in fig. 5. Here, solid lines depict CF levels observed experimentally, while dotted lines indicate CF levels obtained through CF calculations. Shown in fig. 6, which is a zoom-in on the low-wavenumber region of the 4 K perpendicular polarization spectrum of Tb2Ti2O7, are the CF excitations that are observed using inelastic light scattering. As is also clear from fig. 5, all CF excitations previously observed using inelastic neutron scattering are also observed here. Furthermore, additional low-lying excitations can be seen, which are easily identified as CF levels, by comparison with the ’lattice-only template’ spectrum of Gd2Ti2O7.
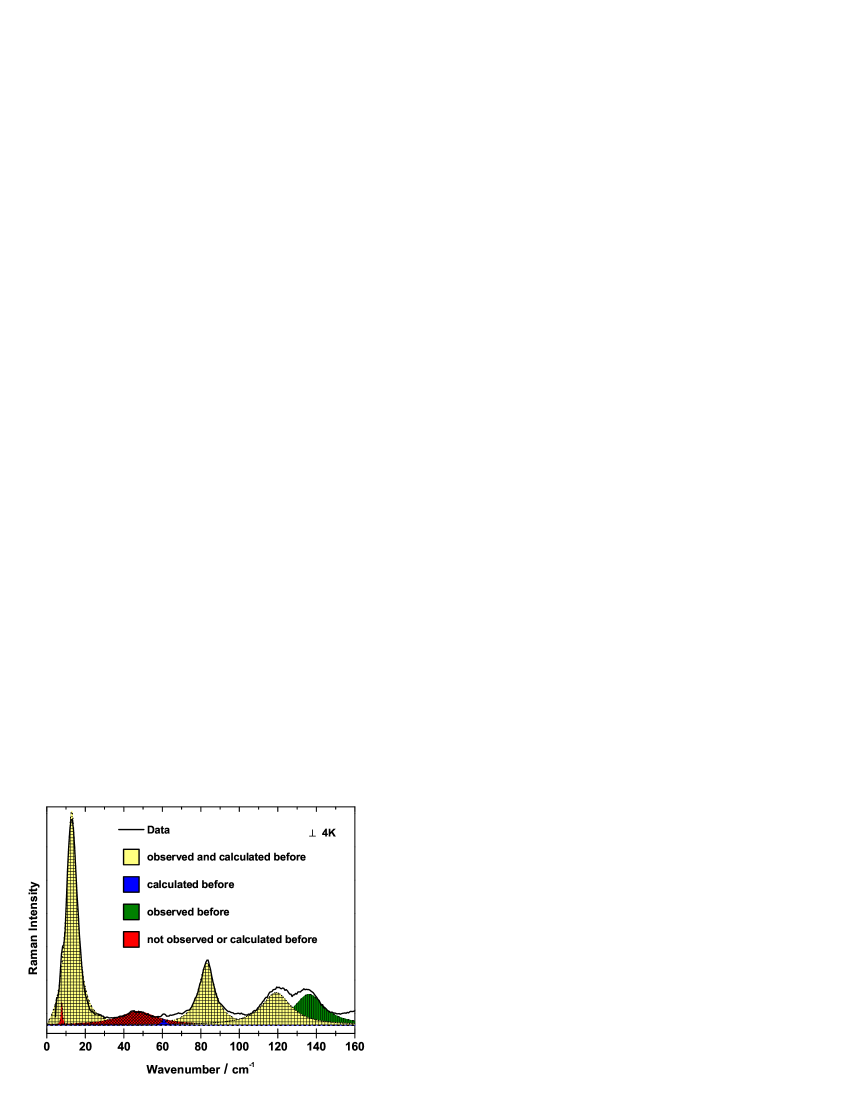
The excitations from the crystal field ground state to the higher crystal field levels, of approximate calculated values 13, 60, 83 and 118 cm-1 (see fig. 5), are all observed at very similar frequencies, at 12.9, 60.8, 83.1 and 119.2 cm-1, respectively. The 60.8 cm-1 level has not been observed experimentally before, though it did follow from the CF calculation made by Gingras et al.Gingras et al. (2000). Conversely, the 135.2 cm-1 mode has been observed through inelastic neutron scattering, yet has not been accounted for in CF calculations. Although Gardner et al.Gardner et al. (2001) interpreted it as an optical phonon, this excitation is clearly identified as a CF excitation here, through the isostructural comparison with the other titanates. The latter assignment is also made by Mirebeau et al.Mirebeau et al. (2007). Additionally, new CF excitations are observed at 7.7 and 47.2 cm-1. While the former is recognized as a CF excitation from the CF ground state to a new CF energy level, the 47.2 cm-1 could also be interpreted as an excitation from the excited CF level at 12.9 cm-1 to the higher excited CF level at 60.8 cm-1. While such an excitation is Raman active (see below), its occurrence at 4 K seems unlikely, since at this temperature the excited CF level (12.9 cm-1 19 K) is not expected to be populated enough to give rise to a measurable Raman signal. Additionally, were it an excitation from an excited state, its intensity would decrease upon cooling. Instead, the intensity of this mode steadily increases with decreasing temperature.
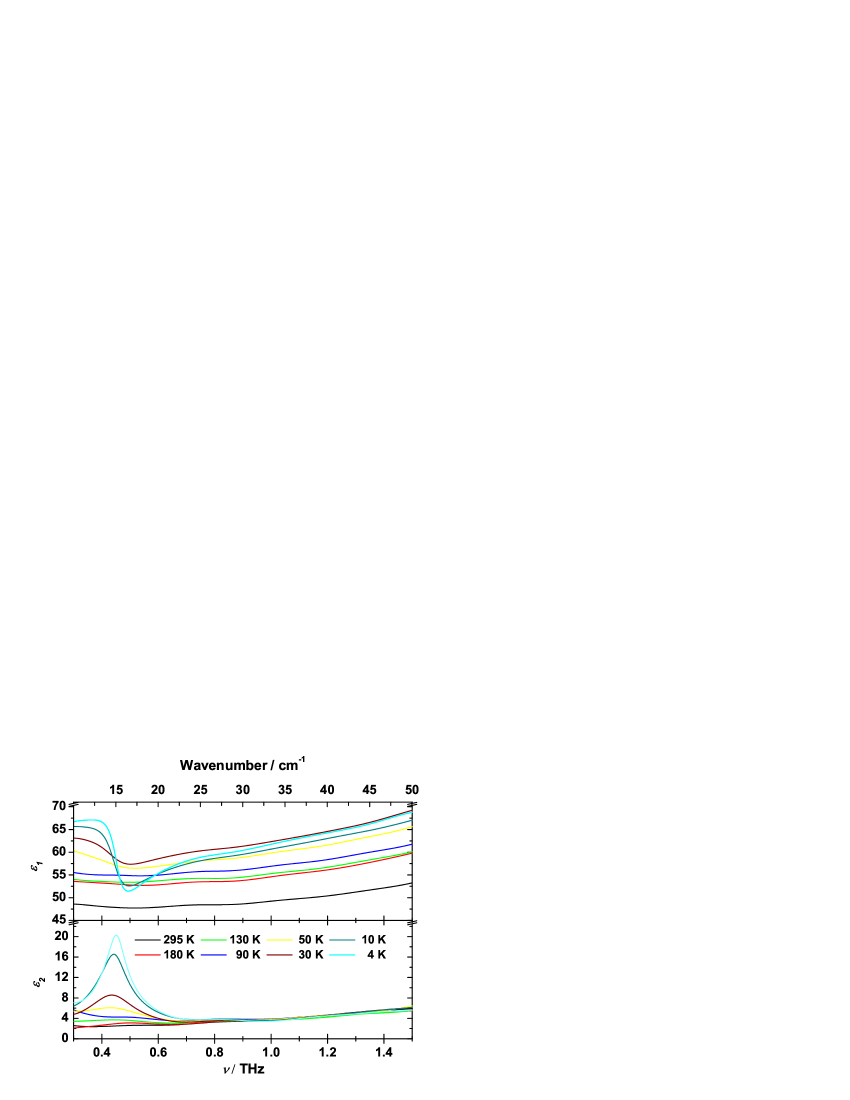
Using and , and irreducible representationsGingras et al. (2000); Malkin et al. (2004) for the ground state and excited CF levels, respectively, it can be confirmed that indeed all these ground state to excited state transitions are expected to be Raman active. Through analogous considerations, the lowest excitation ( , 13 cm-1) is found to be symmetry forbidden in a direct dipole transition. In this respect, terahertz time domain spectroscopy (THz TDS) in the range of 10 to 50 cm-1 (0.3 to 1.5 THz) was employed to probe the absorption of Tb2Ti2O7 at various temperatures. Using this technique it is possible to extract complex optical quantities in the THz range through the direct measurement of the time trace of the transmitted THz pulse. The obtained curves for the real () and imaginary () parts of the dielectric constant at various temperatures are plotted in fig. 7. The plots clearly show an absorption around 0.45 THz (15 cm-1) at low temperatures, corresponding to the 13 cm-1 CF level also observed in the Raman spectra of Tb2Ti2O7. This is corroborated by the identical temperature dependence of the mode in both methods: its spectral signature decreases with increasing temperature, vanishing around 90 K. The fact that the 13 cm-1 CF level is observed in a direct dipole transition indicates that this level is not a true transition, since such a dipole transition would be symmetry forbidden.
Overall, the existence of the additional CF levels in Tb2Ti2O7 unaccounted for by CF calculations, suggests the presence of a second Tb3+ site in the structure, with an energy level scheme different from those reported previously. Three additional CF levels are observed experimentally, while four would naively be expected for a slightly differing Tb site in this low wavenumber region. A fourth new CF level might be unresolved due to the strong CF level at 83 cm-1 or might simply be symmetry forbidden in a Raman transition. Moreover, the fact that the 13 cm-1 CF level is simultaneously Raman and dipole active indicates the breaking of inversion symmetry in the system, which questions the validity of its current symmetry interpretation. Recently, the exact symmetry of the Tb2Ti2O7 lattice has been extensively studied. Han et al.Han et al. (2004) performed neutron powder diffraction and x-ray absorption fine-structure experiments down to 4.5 K, revealing a perfect pyrochlore lattice, within experimental error. Ofer et al.Ofer et al. (2007) find no static lattice distortions on the timescale of 0.1 s, down to 70 mK. Most recently, however, Ruff et al.Ruff et al. (2007) found finite structural correlations at temperatures below 20 K, indicative of fluctuations above a very low temperature structural transition. The present experimental results suggest these fluctuations may even induce a minute static disorder, resulting in the observed CF level diagram.
In Dy2Ti2O7 the Dy3+ ions (4) have a ground state. Crystal field calculations have been performed by Jana et al.Jana et al. (2002), who deduced an energy level scheme consisting of eight Kramers’ doublets, with a separation of 100 cm-1 of the first excited state. Malkin et al.Malkin et al. (2004) and Rosenkranz et al.Rosenkranz et al. (2000b) estimated the first excited state gap to be 200 cm-1 and 266 cm-1, respectively. The Raman spectrum of Dy2Ti2O7 shows only one extra excitation compared to the ’lattice template’ spectrum of Gd2Ti2O7, at an energy of cm-1. This excitation is tentatively ascribed to the first excited CF level, comparing most favorably to the estimation of Rosenkranz et al..
For Ho2Ti2O7, ground state (Ho3+,4), several CF energy level schemes have been calculatedRosenkranz et al. (2000b); Malkin et al. (2004); Siddharthan et al. (1999); Jana and Ghosh (2000), all with first excited state separations around 150 cm-1. However, the Raman spectrum of Ho2Ti2O7 does not show any clear inelastic light scattering from CF levels to compare these calculations to. Although there is some weak intensity around 150 cm-1, which compares favorably with all of the calculated level schemes, the intensity of this scattering is insufficient to definitively ascribe it to a CF level.
IV Conclusions
To summarize, several members of the rare earth titanates family R2Ti2O7 were studied using magnetic susceptibility measurements and polarized inelastic light scattering experiments. Lattice excitations were found to vary only slightly between crystals with different rare earth ions. Temperature dependent measurements also revealed completely analogous behavior of the phononic excitations, except for two anomalous phonons in Tb2Ti2O7, which seem to be coupled to the low energy crystal field excitations in that compound. Such crystal field excitations were observed in Tb2Ti2O7 and possibly also in Dy2Ti2O7. Only one non-phononic excitation is clearly observed in Dy2Ti2O7, its energy consistent with estimates of the first excited crystal field level. For Tb2Ti2O7, all of the the previously determined crystal field energy levels were confirmed. Moreover, the resulting energy level diagram was expanded by three newly observed CF levels, only one of which has been calculated before. Also, one previously reported level was found to be both Raman and dipole active, contradicting its current presumed symmetry. These findings may reflect the existence of two inequivalent Tb sites in the low temperature structure or a static symmetry reduction of another nature, suggesting the recently found structural correlations to induce a minute static disorder in Tb2Ti2O7 at very low temperatures. The new crystal field information may serve to help elucidate the complex theoretical enigma of Tb2Ti2O7.
Acknowledgements.
The authors would like to thank F. van der Horst for his help using the PW 1710 diffractometer. We also acknowledge fruitful discussions with M. Mostovoi, D. Khomskii and S. Singh. This work is part of the research programme of the ’Stichting voor Fundamenteel Onderzoek der Materie (FOM)’, which is financially supported by the ’Nederlandse Organisatie voor Wetenschappelijk Onderzoek (NWO)’References
- Ramirez (1994) A. P. Ramirez, Annu. Rev. Mater. Sci 24, 453 (1994).
- Schiffer and Ramirez (1996) P. Schiffer and A. P. Ramirez, Comments Condens. Matter Phys. 18, 21 (1996).
- Diep (1994) H. T. Diep, ed., Magnetic Systems with Competing Interactions (World Scientific, Singapore, 1994).
- Greedan (2006) J. E. Greedan, J. Alloys Compd. 408-412, 444 (2006).
- Greedan (2001) J. E. Greedan, J. Mater. Chem. 11, 37 (2001).
- Collins and Petrenko (1997) M. F. Collins and O. A. Petrenko, Can. J. Phys. 75, 605 (1997).
- Moessner (2001) R. Moessner, Can. J. Phys. 79, 1283 (2001).
- Villain (1979) J. Villain, Z. Phys. B 33, 31 (1979).
- Reimers et al. (1991) J. N. Reimers, A. J. Berlinsky, and A. C. Shi, Phys. Rev. B 43, 865 (1991).
- Moessner and Chalker (1998) R. Moessner and J. T. Chalker, Phys. Rev. Lett. 80, 2929 (1998).
- Reimers (1992) J. N. Reimers, Phys. Rev. B 45, 7287 (1992).
- Canals and Lacroix (1998) B. Canals and C. Lacroix, Phys. Rev. Lett. 80, 2933 (1998).
- Raju et al. (1999) N. P. Raju, M. Dion, M. J. P. Gingras, T. E. Mason, and J. E. Greedan, Phys. Rev. B 59, 14489 (1999).
- Cashion et al. (1968) J. D. Cashion, A. H. Cooke, M. J. M. Leask, T. L. Thorp, and M. R. Wells, J. Mater. Sci. 3, 402 (1968).
- Ramirez et al. (2002) A. P. Ramirez, B. S. Shastry, A. Hayashi, J. J. Krajewski, D. A. Huse, and R. J. Cava, Phys. Rev. Lett. 89, 067202 (2002).
- Champion et al. (2001) J. D. M. Champion, A. S. Wills, T. Fennell, S. T. Bramwell, J. S. Gardner, and M. A. Green, Phys. Rev. B 64, 140407(R) (2001).
- Stewart et al. (2004) J. R. Stewart, G. Ehlers, A. S. Wills, S. T. Bramwell, and J. S. Gardner, J. Phys.: Condens. Matter 16, L321 (2004).
- Yaouanc et al. (2005) A. Yaouanc, P. Dalmas de Réotier, V. Glazkov, C. Marin, P. Bonville, J. A. Hodges, P. C. M. Gubbens, S. Sakarya, and C. Baines, Phys. Rev. Lett. 95, 047203 (2005).
- Dunsiger et al. (2006) S. R. Dunsiger, R. F. Kiefl, J. A. Chakhalian, J. E. Greedan, W. A. MacFarlane, R. I. Miller, G. D. Morris, A. N. Price, N. P. Raju, and J. E. Sonier, Phys. Rev. B 73, 172418 (2006).
- Palmer and Chalker (2000) S. E. Palmer and J. T. Chalker, Phys. Rev. B 62, 488 (2000).
- Gardner et al. (1999) J. S. Gardner, S. R. Dunsiger, B. D. Gaulin, M. J. P. Gingras, J. E. Greedan, R. F. Kiefl, M. D. Lumsden, W. A. MacFarlane, N. P. Raju, J. E. Sonier, et al., Phys. Rev. Lett. 82, 1012 (1999).
- Gingras et al. (2000) M. J. P. Gingras, B. C. den Hertog, M. Faucher, J. S. Gardner, S. R. Dunsiger, L. J. Chang, B. D. Gaulin, N. P. Raju, and J. E. Greedan, Phys. Rev. B 62, 6496 (2000).
- Gardner et al. (2003) J. S. Gardner, A. Keren, G. Ehlers, C. Stock, E. Segal, J. M. Roper, B. Fåk, M. B. Stone, P. R. Hammar, D. H. Reich, et al., Phys. Rev. B 68, 180401(R) (2003).
- Rosenkranz et al. (2000a) S. Rosenkranz, A. P. Ramirez, A. Hayashi, R. J. Cava, R. Siddharthan, and B. S. Shastry, J. Appl. Phys. 87, 5914 (2000a).
- Mirebeau et al. (2007) I. Mirebeau, P. Bonville, and M. Hennion, Phys. Rev. B 76, 184436 (2007).
- Malkin et al. (2004) B. Z. Malkin, A. R. Zakirov, M. N. Popova, S. A. Klimin, E. P. Chukalina, E. Antic-Fidancev, P. Goldner, P. Aschehoug, and G. Dhalenne, Phys. Rev. B 70, 075112 (2004).
- Gardner et al. (2001) J. S. Gardner, B. D. Gaulin, A. J. Berlinsky, P. Waldron, S. R. Dunsiger, N. P. Raju, and J. E. Greedan, Phys. Rev. B 64, 224416 (2001).
- den Hertog and Gingras (2000) B. C. den Hertog and M. J. P. Gingras, Phys. Rev. Lett. 84, 3430 (2000).
- Kao et al. (2003) Y. J. Kao, M. Enjalran, A. Del Maestro, H. R. Molavian, and M. J. P. Gingras, Phys. Rev. B 68, 172407 (2003).
- (30) The ground state configuration of the spin ice model is formed by satisfying conditions analogous to Pauling’s ’ice rules’: every tetrahedron has both two spins pointing into and two spins pointing out of the tetrahedron. This (under)constraint on the system again results in a macroscopically large number of degenerate ground states.
- Molavian et al. (2007) H. R. Molavian, M. J. P. Gingras, and B. Canals, Phys. Rev. Lett. 98, 157204 (2007).
- Enjalran et al. (2004) M. Enjalran, M. J. P. Gingras, Y. J. Kao, A. del Maestro, and H. R. Molavian, J. Phys.: Condens. Matter 16, S673 (2004).
- Ehlers et al. (2004) G. Ehlers, A. L. Cornelius, T. Fennell, M. Koza, S. T. Bramwell, and J. S. Gardner, Physica B 385-386, 307 (2004).
- Curnoe (2007) S. H. Curnoe, Phys. Rev. B 75, 212404 (2007).
- Ramirez et al. (1999) A. P. Ramirez, A. Hayashi, R. J. Cava, R. Siddharthan, and B. S. Shastry, Nature 399, 333 (1999).
- Snyder et al. (2004) J. Snyder, B. G. Ueland, J. S. Slusky, H. Karunadasa, R. J. Cava, and P. Schiffer, Phys. Rev. B 69, 064414 (2004).
- Ramirez et al. (2000) A. P. Ramirez, C. L. Broholm, R. J. Cava, and G. R. Kowach, Physica B 280, 290 (2000).
- Harris et al. (1997) M. J. Harris, S. T. Bramwell, D. F. McMorrow, T. Zeiske, and K. W. Godfrey, Phys. Rev. Lett. 79, 2554 (1997).
- Bramwell et al. (2001) S. T. Bramwell, M. J. Harris, B. C. den Hertog, M. J. P. Gingras, J. S. Gardner, D. F. McMorrow, A. R. Wildes, A. L. Cornelius, J. D. M. Champion, R. G. Melko, et al., Phys. Rev. Lett. 87, 047205 (2001).
- Cornelius and Gardner (2001) A. L. Cornelius and J. S. Gardner, Phys. Rev. B 64, 060406(R) (2001).
- Petrenko et al. (2003) O. A. Petrenko, M. R. Lees, and G. Balakrishnan, Phys. Rev. B 68, 012406 (2003).
- Bramwell et al. (2000) S. T. Bramwell, M. N. Field, M. J. Harris, and I. P. Parkin, J. Phys.: Condens. Matter 12, 483 (2000).
- Melko and Gingras (2004) R. G. Melko and M. J. P. Gingras, J. Phys.: Condens. Matter 16, R1277 (2004).
- Bramwell and Gingras (2001) S. T. Bramwell and M. J. P. Gingras, Science 294, 1495 (2001).
- Bramwell and Harris (1998) S. T. Bramwell and M. J. Harris, J. Phys.: Condens. Matter 10, L215 (1998).
- Anderson (1956) P. W. Anderson, Phys. Rev. 102, 1008 (1956).
- Pauling (1935) L. Pauling, J. Am. Chem. Soc. 57, 2680 (1935).
- Isakov et al. (2005) S. V. Isakov, R. Moessner, and S. L. Sondhi, Phys. Rev. Lett. 95, 217201 (2005).
- Fukazawa et al. (2002) H. Fukazawa, R. G. Melko, R. Higashinaka, Y. Maeno, and M. J. P. Gingras, Phys. Rev. B 65, 054410 (2002).
- Fennell et al. (2002) T. Fennell, O. A. Petrenko, G. Balakrishnan, S. T. Bramwell, J. D. M. Champion, B. Fak, M. J. Harris, and D. M. Paul, Appl. Phys. A 74, S889 (2002).
- Harris et al. (1998) M. J. Harris, S. T. Bramwell, T. Zeiske, D. F. McMorrow, and P. J. C. King, J. of Mag. and Magn. Mater. 177, 757 (1998).
- Mirebeau et al. (2006) I. Mirebeau, A. Apetrei, I. N. Goncharenko, and R. Moessner, J. Phys.: Condens. Matter 16, S635 (2006).
- Gardner et al. (1998) J. S. Gardner, B. D. Gaulin, and D. M. Paul, J. Crystal Growth 191, 740 (1998), and references therein.
- Schmuttenmaer (2004) C. A. Schmuttenmaer, Chem. Rev. 62, 1759 (2004).
- Beard et al. (2000) M. C. Beard, G. M. Turner, and C. A. Schmuttenmaer, Phys. Rev. B 62, 15764 (2000).
- Sato and Ishii (1989) M. Sato and Y. Ishii, J. Appl. Phys. 66, 983 (1989).
- Gupta et al. (2001a) H. C. Gupta, S. Brown, N. Rani, and V. B. Gohel, J. Raman Spectrosc. 32, 41 (2001a).
- Saha et al. (2006) S. Saha, D. V. S. Muthu, C. Pascanut, N. Dragoe, R. Suryanarayanan, G. Dhalenne, A. Revcolevschi, S. Karmakar, S. M. Sharma, and A. K. Sood, Phys. Rev. B 74, 064109 (2006).
- Zhang and Saxena (2005) F. X. Zhang and S. K. Saxena, Chem. Phys. Lett. 413, 248 (2005).
- Mori et al. (2003) M. Mori, G. M. Tompsett, N. M. Sammes, E. Suda, and Y. Takeda, Solid State Ionics 158, 79 (2003), and references therein.
- Hess et al. (2002) N. J. Hess, B. D. Begg, S. D. Conradson, D. E. McCready, P. L. Gassman, and W. J. Weber, J. Phys Chem. B 106, 4663 (2002).
- Vandenborre and Husson (1983) M. T. Vandenborre and E. Husson, J. Solid State Chem. 50, 362 (1983).
- Brown et al. (2003) S. Brown, H. C. Gupta, J. A. Alonso, and M. J. Martinez-Lope, J. Raman Spectrosc. 34, 240 (2003).
- Glerup et al. (2001) M. Glerup, O. F. Nielsen, and W. F. Poulsen, J. Solid State Chem. 160, 25 (2001).
- Gupta et al. (2001b) H. C. Gupta, S. Brown, N. Rani, and V. B. Gohel, Int. J. Inorg. Mater. 3, 983 (2001b).
- Gupta et al. (2002) H. C. Gupta, S. Brown, N. Rani, and V. B. Gohel, J. Phys. Chem. Solids 63, 535 (2002).
- Vandenborre et al. (1983) M. T. Vandenborre, E. Husson, J. P. Chatry, and D. Michel, J. Raman Spectrosc. 14, 63 (1983).
- Porto et al. (1967) S. P. S. Porto, P. A. Fleury, and T. C. Damen, Phys. Rev. 154, 522 (1967).
- Gaulin et al. (1998) B. D. Gaulin, J. S. Gardner, S. R. Dunsiger, Z. Tun, M. D. Lumsden, R. F. Kiefl, N. P. Raju, J. N. Reimers, and J. E. Greedan, Physica B 241-243, 511 (1998).
- Kanada et al. (1999) M. Kanada, Y. Yasui, M. Ito, H. Harashina, M. Sato, H. Okumura, and K. Kakurai, J. Phys. Soc. Japan 68, 3802 (1999).
- Han et al. (2004) S. W. Han, J. S. Gardner, and C. H. Booth, Phys. Rev. B 69, 024416 (2004).
- Ofer et al. (2007) O. Ofer, A. Keren, and C. Baines, J. Phys.: Condens. Matter 19, 145270 (2007).
- Ruff et al. (2007) J. P. C. Ruff, B. D. Gaulin, J. P. Castellan, K. C. Rule, J. P. Clancy, J. Rodriguez, and H. A. Dabkowska, Phys. Rev. Lett. 99, 237202 (2007).
- Jana et al. (2002) Y. M. Jana, A. Sengupta, and D. Ghosh, J. Magn. Magn. Mater. 248, 7 (2002).
- Rosenkranz et al. (2000b) S. Rosenkranz, A. P. Ramirez, A. Hayashi, R. J. Cava, R. Siddharthan, and B. S. Shastry, J. Appl. Phys 87, 5914 (2000b).
- Siddharthan et al. (1999) R. Siddharthan, B. S. Shastry, A. P. Ramirez, A. Hayashi, R. J. Cava, and S. Rosenkranz, Phys. Rev. Lett. 83, 1854 (1999).
- Jana and Ghosh (2000) Y. M. Jana and D. Ghosh, Phys. Rev. B 61, 9657 (2000).