Y. Horii
Tohoku University, Sendai
K. Trabelsi
High Energy Accelerator Research Organization (KEK), Tsukuba
H. Yamamoto
Tohoku University, Sendai
I. Adachi
High Energy Accelerator Research Organization (KEK), Tsukuba
H. Aihara
Department of Physics, University of Tokyo, Tokyo
K. Arinstein
Budker Institute of Nuclear Physics, Novosibirsk
V. Aulchenko
Budker Institute of Nuclear Physics, Novosibirsk
V. Balagura
Institute for Theoretical and Experimental Physics, Moscow
E. Barberio
University of Melbourne, School of Physics, Victoria 3010
I. Bedny
Budker Institute of Nuclear Physics, Novosibirsk
K. Belous
Institute of High Energy Physics, Protvino
V. Bhardwaj
Panjab University, Chandigarh
U. Bitenc
J. Stefan Institute, Ljubljana
S. Blyth
National United University, Miao Li
A. Bozek
H. Niewodniczanski Institute of Nuclear Physics, Krakow
M. Bračko
University of Maribor, Maribor
J. Stefan Institute, Ljubljana
T. E. Browder
University of Hawaii, Honolulu, Hawaii 96822
Y. Chao
Department of Physics, National Taiwan University, Taipei
A. Chen
National Central University, Chung-li
W. T. Chen
National Central University, Chung-li
B. G. Cheon
Hanyang University, Seoul
R. Chistov
Institute for Theoretical and Experimental Physics, Moscow
I.-S. Cho
Yonsei University, Seoul
S.-K. Choi
Gyeongsang National University, Chinju
Y. Choi
Sungkyunkwan University, Suwon
J. Dalseno
High Energy Accelerator Research Organization (KEK), Tsukuba
M. Dash
Virginia Polytechnic Institute and State University, Blacksburg, Virginia 24061
S. Eidelman
Budker Institute of Nuclear Physics, Novosibirsk
N. Gabyshev
Budker Institute of Nuclear Physics, Novosibirsk
H. Ha
Korea University, Seoul
J. Haba
High Energy Accelerator Research Organization (KEK), Tsukuba
T. Hara
Osaka University, Osaka
K. Hayasaka
Nagoya University, Nagoya
M. Hazumi
High Energy Accelerator Research Organization (KEK), Tsukuba
D. Heffernan
Osaka University, Osaka
Y. Hoshi
Tohoku Gakuin University, Tagajo
W.-S. Hou
Department of Physics, National Taiwan University, Taipei
H. J. Hyun
Kyungpook National University, Taegu
K. Inami
Nagoya University, Nagoya
A. Ishikawa
Saga University, Saga
H. Ishino
Tokyo Institute of Technology, Tokyo
R. Itoh
High Energy Accelerator Research Organization (KEK), Tsukuba
M. Iwabuchi
The Graduate University for Advanced Studies, Hayama
M. Iwasaki
Department of Physics, University of Tokyo, Tokyo
Y. Iwasaki
High Energy Accelerator Research Organization (KEK), Tsukuba
D. H. Kah
Kyungpook National University, Taegu
H. Kaji
Nagoya University, Nagoya
J. H. Kang
Yonsei University, Seoul
N. Katayama
High Energy Accelerator Research Organization (KEK), Tsukuba
H. Kawai
Chiba University, Chiba
T. Kawasaki
Niigata University, Niigata
H. Kichimi
High Energy Accelerator Research Organization (KEK), Tsukuba
H. J. Kim
Kyungpook National University, Taegu
S. K. Kim
Seoul National University, Seoul
Y. J. Kim
The Graduate University for Advanced Studies, Hayama
K. Kinoshita
University of Cincinnati, Cincinnati, Ohio 45221
S. Korpar
University of Maribor, Maribor
J. Stefan Institute, Ljubljana
P. Križan
Faculty of Mathematics and Physics, University of Ljubljana, Ljubljana
J. Stefan Institute, Ljubljana
P. Krokovny
High Energy Accelerator Research Organization (KEK), Tsukuba
C. C. Kuo
National Central University, Chung-li
Y. Kuroki
Osaka University, Osaka
A. Kuzmin
Budker Institute of Nuclear Physics, Novosibirsk
Y.-J. Kwon
Yonsei University, Seoul
J. S. Lee
Sungkyunkwan University, Suwon
M. J. Lee
Seoul National University, Seoul
S. E. Lee
Seoul National University, Seoul
T. Lesiak
H. Niewodniczanski Institute of Nuclear Physics, Krakow
J. Li
University of Hawaii, Honolulu, Hawaii 96822
S.-W. Lin
Department of Physics, National Taiwan University, Taipei
C. Liu
University of Science and Technology of China, Hefei
D. Liventsev
Institute for Theoretical and Experimental Physics, Moscow
F. Mandl
Institute of High Energy Physics, Vienna
S. McOnie
University of Sydney, Sydney, New South Wales
T. Medvedeva
Institute for Theoretical and Experimental Physics, Moscow
W. Mitaroff
Institute of High Energy Physics, Vienna
K. Miyabayashi
Nara Women’s University, Nara
H. Miyake
Osaka University, Osaka
H. Miyata
Niigata University, Niigata
Y. Miyazaki
Nagoya University, Nagoya
R. Mizuk
Institute for Theoretical and Experimental Physics, Moscow
G. R. Moloney
University of Melbourne, School of Physics, Victoria 3010
T. Nagamine
Tohoku University, Sendai
Y. Nagasaka
Hiroshima Institute of Technology, Hiroshima
M. Nakao
High Energy Accelerator Research Organization (KEK), Tsukuba
H. Nakazawa
National Central University, Chung-li
Z. Natkaniec
H. Niewodniczanski Institute of Nuclear Physics, Krakow
S. Nishida
High Energy Accelerator Research Organization (KEK), Tsukuba
O. Nitoh
Tokyo University of Agriculture and Technology, Tokyo
S. Ogawa
Toho University, Funabashi
T. Ohshima
Nagoya University, Nagoya
S. Okuno
Kanagawa University, Yokohama
H. Ozaki
High Energy Accelerator Research Organization (KEK), Tsukuba
G. Pakhlova
Institute for Theoretical and Experimental Physics, Moscow
C. W. Park
Sungkyunkwan University, Suwon
H. Park
Kyungpook National University, Taegu
H. K. Park
Kyungpook National University, Taegu
L. S. Peak
University of Sydney, Sydney, New South Wales
R. Pestotnik
J. Stefan Institute, Ljubljana
L. E. Piilonen
Virginia Polytechnic Institute and State University, Blacksburg, Virginia 24061
H. Sahoo
University of Hawaii, Honolulu, Hawaii 96822
Y. Sakai
High Energy Accelerator Research Organization (KEK), Tsukuba
O. Schneider
École Polytechnique Fédérale de Lausanne (EPFL), Lausanne
C. Schwanda
Institute of High Energy Physics, Vienna
A. J. Schwartz
University of Cincinnati, Cincinnati, Ohio 45221
K. Senyo
Nagoya University, Nagoya
M. E. Sevior
University of Melbourne, School of Physics, Victoria 3010
M. Shapkin
Institute of High Energy Physics, Protvino
H. Shibuya
Toho University, Funabashi
J.-G. Shiu
Department of Physics, National Taiwan University, Taipei
A. Somov
University of Cincinnati, Cincinnati, Ohio 45221
S. Stanič
University of Nova Gorica, Nova Gorica
M. Starič
J. Stefan Institute, Ljubljana
T. Sumiyoshi
Tokyo Metropolitan University, Tokyo
S. Suzuki
Saga University, Saga
F. Takasaki
High Energy Accelerator Research Organization (KEK), Tsukuba
N. Tamura
Niigata University, Niigata
M. Tanaka
High Energy Accelerator Research Organization (KEK), Tsukuba
Y. Teramoto
Osaka City University, Osaka
T. Tsuboyama
High Energy Accelerator Research Organization (KEK), Tsukuba
S. Uehara
High Energy Accelerator Research Organization (KEK), Tsukuba
Y. Unno
Hanyang University, Seoul
S. Uno
High Energy Accelerator Research Organization (KEK), Tsukuba
P. Urquijo
University of Melbourne, School of Physics, Victoria 3010
Y. Usov
Budker Institute of Nuclear Physics, Novosibirsk
G. Varner
University of Hawaii, Honolulu, Hawaii 96822
K. E. Varvell
University of Sydney, Sydney, New South Wales
K. Vervink
École Polytechnique Fédérale de Lausanne (EPFL), Lausanne
C. H. Wang
National United University, Miao Li
M.-Z. Wang
Department of Physics, National Taiwan University, Taipei
P. Wang
Institute of High Energy Physics, Chinese Academy of Sciences, Beijing
X. L. Wang
Institute of High Energy Physics, Chinese Academy of Sciences, Beijing
Y. Watanabe
Kanagawa University, Yokohama
R. Wedd
University of Melbourne, School of Physics, Victoria 3010
E. Won
Korea University, Seoul
Y. Yamashita
Nippon Dental University, Niigata
M. Yamauchi
High Energy Accelerator Research Organization (KEK), Tsukuba
C. C. Zhang
Institute of High Energy Physics, Chinese Academy of Sciences, Beijing
Z. P. Zhang
University of Science and Technology of China, Hefei
V. Zhilich
Budker Institute of Nuclear Physics, Novosibirsk
V. Zhulanov
Budker Institute of Nuclear Physics, Novosibirsk
A. Zupanc
J. Stefan Institute, Ljubljana
O. Zyukova
Budker Institute of Nuclear Physics, Novosibirsk
Abstract
We report a study of the suppressed meson decay
followed by , where indicates a or state.
The two decay paths interfere and provide information on the -violating angle .
We use a data sample containing pairs recorded at the
resonance with the Belle detector at the KEKB asymmetric-energy
storage ring.
We do not find significant evidence for the mode ,
, and set an upper limit of
, where is the magnitude of the ratio of amplitudes
.
The decay , is also analyzed as a
reference, for which we observe a signal with 6.6 significance,
and measure the charge asymmetry to be .
In addition, the ratio is measured to be .
pacs:
11.30.Er, 12.15.Hh, 13.25.Hw, 14.40.Nd
Precise measurements of the parameters of the standard model
are fundamentally important and may reveal new physics. The
Cabibbo-Kobayashi-Maskawa matrix Cabibbo ; KM consists
of weak interaction parameters for the quark sector, one of which is
the -violating angle .
Several proposed methods for measuring exploit the interference between
and , where
and decay to common final states DK1 ; DK2 .
The effects of violation could be enhanced if the final state
is chosen so that the interfering amplitudes have comparable
magnitudes ADS .
The decay ,
() is a particularly useful mode, in which
the color-favored decay followed by the doubly Cabibbo-suppressed decay
interferes with the color-suppressed decay followed by the Cabibbo-favored
decay (Fig. 1). Previous studies of this decay mode have
not found a significant signal yield Saigo ; DK_BaBar .
The decay , has a similar event topology and is Cabibbo-enhanced relative to the corresponding mode.
Therefore this mode is an ideal control sample, while its asymmetry is expected to be negligible.
Figure 1: Diagrams for , and
, decays.
In this analysis, we measure the ratios of the above suppressed decays
relative to the favored decays , ,
where or . The same selection criteria are used for
the suppressed decays and the favored decays whenever possible in order
to cancel systematic uncertainties. In this paper, charge conjugate reactions
are implied except where otherwise mentioned; we denote the suppressed decays
, as ,
and the favored decays ,
as . Furthermore, a or that
originates directly from a is referred to as the ”prompt” particle.
The results are based on a data sample that contains
pairs, collected with the Belle detector
at the KEKB asymmetric-energy (3.5 GeV on 8 GeV)
collider KEKB operating at the resonance.
The Belle detector is a large-solid-angle magnetic
spectrometer that consists of a silicon vertex detector (SVD),
a 50-layer central drift chamber (CDC), an array of
aerogel threshold Cherenkov counters (ACC),
a barrel-like arrangement of time-of-flight
scintillation counters (TOF), and an electromagnetic calorimeter
comprised of CsI(Tl) crystals (ECL) located inside
a superconducting solenoid coil that provides a 1.5 T
magnetic field. An iron flux return located outside of
the coil is instrumented to detect mesons and to identify
muons (KLM). The detector
is described in detail elsewhere Belle .
Two inner detector configurations were used. A 2.0 cm beam pipe
and a 3-layer silicon vertex detector were used for the first sample
of pairs, while a 1.5 cm beam pipe, a 4-layer
silicon detector, and a small-cell inner drift chamber were used to record
the remaining pairs svd2 .
Neutral meson candidates are reconstructed from pairs of oppositely charged tracks.
For each track, we apply a particle identification requirement based on a
likelihood ratio , where and are kaon and pion
likelihoods, respectively.
The likelihoods are determined by the information from the ACC and TOF and
specific ionization measurements from the CDC. We use the requirements
and for the kaon and pion candidates, respectively.
The efficiency to identify a kaon (pion) is 94%, while the probability that
a pion (kaon) is misidentified as a kaon (pion) is about 10%.
The systematic error in the selection efficiency is less than 1% for both kaons and pions.
The invariant mass of the pair must be within of the nominal mass PDG : 1.850 GeV/ 1.880 GeV/.
To improve the momentum determinations, tracks from the candidate are refitted with
their invariant mass constrained to the nominal mass.
meson candidates are reconstructed by combining a candidate with a prompt charged hadron
candidate, for which the particle identification requirement
[] is used for ().
With this requirement, the efficiency to identify a kaon (pion) is 86% (81%), while
the probability that a pion (kaon) is misidentified as a kaon (pion) is about 5% (10%).
The signal is identified by two kinematic variables, the energy difference
and the beam-energy-constrained mass
,
where is the beam energy in the center-of-mass (c.m.) frame.
We require to be within of the nominal mass PDG ;
namely, 5.271 GeV/ 5.287 GeV/. We then fit the
distribution to extract the signal yield. In the rare cases where there is more
than one candidate in an event (0.3% for and
0.7% for ), we select the best candidate on
the basis of a determined from the difference between the measured and
nominal values of and .
The large background from the two jetlike
() continuum processes is suppressed using variables that characterize
the event topology. A Fisher discriminant Fisher made up of modified Fox-Wolfram
moments called the Super-Fox-Wolfram (SFW) KSFW and ,
where is the angle of the flight direction with respect to the beam
axis in the c.m. system, are employed. These two independent variables, SFW and
, are combined to form likelihoods for signal ()
and for continuum background (); we then construct a likelihood
ratio .
We optimize the requirement by maximizing , where and
denote the expected numbers of signal and background events in the signal region,
using Monte Carlo samples.
To estimate , we consider only the contribution from
followed by ,
where the value of of Eq. (6) is taken to be 0.1.
For
() we require (),
which retains 45% (70%) of the signal events and removes 99% (96%) of
the continuum background.
A similar requirement is obtained if the optimization uses
instead of .
For , a possible background comes
from , , which has the same final
state and the same position of the peak as the signal.
We veto events that satisfy 1.840 GeV/
1.890 GeV/. After this veto, the estimated number of events that
contribute to the signal yield is .
The favored decay can also produce a
peaking background for the suppressed decay modes if both the kaon and
the pion from the decay are misidentified and the particle
assignments are interchanged. In order to remove this background, we veto events
for which the invariant mass of the pair is inside the 1.865
GeV/ 0.020 GeV/ window when the mass assignments are
exchanged. After this requirement, we estimate that
() events contribute to the signal yield for
().
The signal yields are extracted using extended unbinned maximum likelihood fits to
the distributions.
For the signal, we use a sum of two Gaussians, where the parameters are determined
by a fit to .
The same probability density function (PDF) is used for the signal peaks in all other
modes; the validity of this assumption is verified by Monte Carlo studies.
Backgrounds from (), such as , can populate the negative region of the sample.
The PDF for these backgrounds is obtained from the Monte Carlo samples,
in which all known and meson decays are allowed.
Similarly, backgrounds from (), such as and , can populate the negative region of the sample, as well as the negative region of the sample if the prompt pion is misidentified as a kaon.
In the fit to the PDF of these backgrounds is obtained
from the Monte Carlo samples, while in the fit to
the PDF is obtained from data by assigning the kaon mass to the prompt pion track in the
sample.
The good quality of the fit of the data sample indicates
the validity of this technique.
The feed-across from the signal peak also appears
in the fit to , where the prompt pion is misidentified
as the kaon.
The PDF is fixed from the fit to the data sample where the kaon mass
is assigned to the prompt pion track.
The shift caused by the incorrect mass assignment makes the shape of the distribution asymmetric,
and thus we model the misidentification background as a sum of two asymmetric Gaussians,
for which the left and the right sides have different widths.
In the fit to , we fix the yields for the contributions
from the background and the feed-across from
the signal peak, using the measured yields in the
sample
scaled by the ratio of the yields obtained in the
and analyses.
The continuum background populates the entire region, for which we use a
linear function.
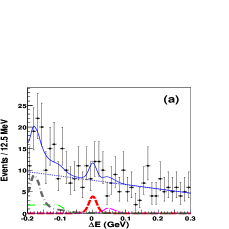
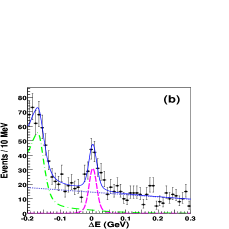
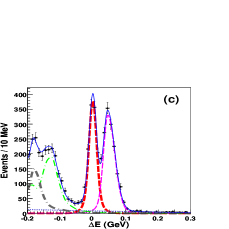
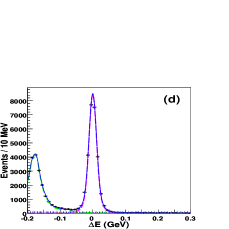
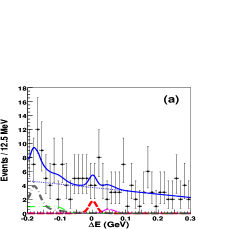
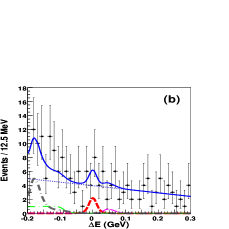
The fit results are shown in Fig. 2.
Figure 2: distributions for (a) ,
(b) , (c) , and
(d) . Charge conjugate decays are included.
In these plots, components are shown by thicker dashed curves, and components are shown by thinner dashed curves. Backgrounds are shown by thicker dash-dotted curves (for ), thinner dash-dotted curves (for ), and dotted curves (for the continuum). The sum of all components is shown by the solid curves.
The charmless decay
() can peak inside the signal region for
().
For this background, we fit the distribution of events in the
mass sideband, defined as 0.020 GeV/GeV/ 0.080
GeV/, and obtain an expected yield of () events.
We do not subtract this charmless contribution and instead include the uncertainties,
(), in the systematic error.
The signal yields () and the reconstruction efficiencies ()
for the decays and
are listed in Table 1.
From the results, we calculate ratios of branching fractions, defined as
(1)
We obtain
(2)
(3)
where the systematic errors (Table 2) are subdivided as follows.
(i)
Fit:
The uncertainties due to the PDFs of the decays and the background are obtained by varying the shape parameters by .
Those due to the PDFs and yields of the backgrounds from and are estimated by fitting the distribution in the region GeV GeV without including those contributions.
The total fit error is the quadratic sum and 26% (3.1%) for ().
(ii)
Peaking backgrounds:
The uncertainties due to the backgrounds which peak under the signal were described earlier, and the corresponding systematic error in () is estimated to be (%). This uncertainty is asymmetric because the uncertainty of the charmless background is taken only for the negative side.
(iii)
Efficiency:
Monte Carlo statistics and the uncertainties in the efficiencies of particle
identification requirements dominate the systematic error in detection efficiency, which
is estimated to be 2.7% (2.5%) for ().
The total systematic error is the sum in quadrature of the above uncertainties.
The possible fit bias is checked using a large number of pseudoexperiments
and found to be negligible.
Table 1: Summary of the fit results. For the signal
yield, the contribution of peaking backgrounds has been subtracted. The first two errors
on the measured branching fractions are statistical and systematic, respectively, and
the third is due to the uncertainty in the branching
fraction used for normalization. The last column shows the partial rate asymmetries as explained in the text.
Mode
Efficiency (%)
Signal yield
Significance
Branching fraction [90% C.L. upper limit]
15.40.3
9.7
1.3
[]
23.10.4
93.8
6.6
15.10.3
1220
22.80.4
27202
Table 2: Summary of the systematic uncertainties for and .
Source
Fit
%
%
Peaking backgrounds
%
%
Efficiency
%
%
Detector asymmetry
The significances are estimated as ,
where is the maximum likelihood and is the
likelihood when the signal yield is constrained to be zero.
The distribution of the likelihood is obtained by convoluting the likelihood in the fit and an asymmetric Gaussian whose widths are the negative and positive systematic errors.
The results are shown in Table 1.
Since the signal for is not
significant, we set an upper limit at the 90% confidence level (C.L.),
.
This limit, , is calculated according to
.
Using the values of obtained above and the
branching fractions from Ref. PDG ,
we determine the branching fractions for from
(4)
The results are summarized in Table 1.
For the branching fraction, we set an upper limit
at the 90% C.L., .
Our branching fraction for is consistent with
the value expected from measured branching fractions for and
decays PDG .
and and are the strong phase differences between the two and
decay amplitudes, respectively. Using the above result,
we obtain a conservative upper limit on as follows.
For a given and in the relevant parameter ranges,
is the largest when and is maximal.
Thus, we take and a shift in ,
and obtain which corresponds to the 90% upper limit on .
We also measure the partial rate asymmetry in
the decays,
(8)
by fitting the and candidates with the asymmetry as one of the fitting parameters.
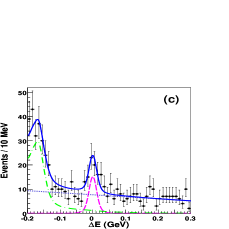
The fit results are shown in
Fig. 3 and included in Table 1. We obtain
(9)
and no significant constraint on .
The systematic errors (Table 2) are dominated
by the uncertainties due to the fits.
Possible bias due to charge asymmetry of the detector is estimated using
the control sample for which the expected asymmetry is small.
The peaking backgrounds are subtracted assuming no asymmetries.
An assumption of 30% asymmetry in the peaking background would lead to
a shift of 0.02 in .
Figure 3: distributions for (a) ,
(b) , (c) , and
(d) .
The curves show the component (thicker dashed curves), the component (thinner dashed curves), and the background components (thicker dash-dotted curves for , thinner dash-dotted curves for , and dotted curves for the continuum), as well as the overall fit (solid curves).
We also report the ratio
(10)
to be from the fit
to and ,
which is about lower than the current world average PDG .
The systematic error is due to the uncertainties in the yield extractions (3.1%)
and uncertainties in efficiency estimations (1.9%).
The latter is dominated by the uncertainty in particle identification efficiency for prompt
hadrons.
In summary, using pairs collected with the Belle detector,
we report studies of the suppressed decay ().
No significant signal is observed for and
we set a 90% C.L. upper limit on the ratio of decay amplitudes, .
This result is consistent
with the measurement of in the Dalitz plot analysis of the decay ,
DK_Dalitz ; DK_Dalitz_BaBar .
For , we observe a signal with 6.6 significance.
We also report the charge asymmetry for
and the ratio .
These results improve and supersede our previous results Saigo ; Swain .
We thank the KEKB group for excellent operation of the
accelerator, the KEK cryogenics group for efficient solenoid
operations, and the KEK computer group and
the NII for valuable computing and Super-SINET network
support. We acknowledge support from MEXT and JSPS (Japan);
ARC and DEST (Australia); NSFC (China);
DST (India); MOEHRD, KOSEF and KRF (Korea);
KBN (Poland); MES and RFAAE (Russia); ARRS (Slovenia); SNSF (Switzerland);
NSC and MOE (Taiwan); and DOE (USA).
References
(1)
N. Cabibbo, Phys. Rev. Lett. 10, 531 (1963).
(2)
M. Kobayashi and T. Maskawa, Prog. Theor. Phys. 49, 652 (1973).
(3)
I. I. Bigi and A. I. Sanda, Phys. Lett. B 211, 213 (1988).
(4)
M. Gronau and D. London, Phys. Lett. B 253, 483 (1991);
M. Gronau and D. Wyler, Phys. Lett. B 265, 172 (1991).
(5)
D. Atwood, I. Dunietz, and A. Soni, Phys. Rev. Lett. 78, 3257 (1997);
Phys. Rev. D 63, 036005 (2001).
(6)
Belle Collaboration, M. Saigo et al., Phys. Rev. Lett. 94, 091601 (2005).
(7)
BaBar Collaboration, B. Aubert et al., Phys. Rev. Lett. 93, 131804 (2004);
Phys. Rev. D 72, 032004 (2005).
(8)
S. Kurokawa and E. Kikutani, Nucl. Instr. and Meth. A 499, 1 (2003),
and other papers included in this volume.
(9)
Belle Collaboration, A. Abashian et al.,
Nucl. Instr. and Meth. A 479, 117 (2002).
(10)
Belle SVD2 Group, Z.Natkaniec et al., Nucl. Instr. and Meth. A 560, 1 (2006).
(11)
Particle Data Group, W.-M.Yao et al., 2007 partial update for the 2008 edition at
http://pdg.lbl.gov.
(12)
R. A. Fisher, Ann. Eugenics 7, 179 (1936).
(13)
The Fox-Wolfram moments were introduced in
G. C. Fox and S. Wolfram, Phys. Rev. Lett. 41, 1581 (1978).
The modified moments used in this paper are described in
Belle Collaboration, S. H. Lee et al., Phys. Rev. Lett. 91, 261801 (2003).
(14)
HFAG, online update for Charm 2007 at http://www.slac.stanford.edu/xorg/hfag/charm.
(15)
Belle Collaboration, A. Poluektov et al., Phys. Rev. D 73, 112009 (2006).
(16)
BaBar Collaboration, B. Aubert et al., Phys. Rev. Lett. 95, 121802 (2005).
(17)
Belle Collaboration, S. K. Swain et al., Phys. Rev. D 68, 051101 (2003).