Colloid-polymer mixtures in random porous media: Finite size scaling and connected versus disconnected susceptibilities
Abstract
As a generic model for liquid-vapor type transitions in random porous media, the Asakura-Oosawa model for colloid-polymer mixtures is studied in a matrix of quenched spheres using extensive Monte Carlo (MC) simulations. Since such systems at criticality, as well as in the two-phase region, exhibit lack of self-averaging, the analysis of MC data via finite size scaling requires special care. After presenting the necessary theoretical background and the resulting subtleties of finite size scaling in random-field Ising-type systems, we present data on the order parameter distribution (and its moments) as a function of colloid and polymer fugacities for a broad range of system sizes, and for many (thousands) realizations of the porous medium. Special attention is paid to the “connected” and “disconnected” susceptibilities, and their respective critical behavior. We show that both susceptibilities diverge at the critical point, and we demonstrate that this is compatible with the predicted scenario of random-field Ising universality.
pacs:
05.70.Jk, 64.70.F-, 02.70.-c, 82.70.Dd1 Introduction
Understanding the behavior of fluids that undergo a liquid-vapor phase transition in the bulk (or, equivalently, of binary mixtures undergoing bulk phase separation), is still rudimentary when one considers the confinement of such systems in mesoporous materials, such as porous glasses or silica gels [1]. Such amorphous materials form a highly irregular, interconnected, three-dimensionally percolating network, and liquid-vapor type transitions of fluids confined between the walls of such networks are widely observed and of practical importance [2]. However, the precise nature of the liquid-vapor critical point of such systems is still only partly understood [3, 4, 5, 6, 7, 8, 9, 10, 11, 12, 13, 14]. While de Gennes [7] has presented a simple argument that the critical behavior of fluids in such random media can be mapped onto the random-field Ising model (RFIM) [15, 16, 17], this prediction could be confirmed neither by experiments [3, 4, 5, 6], nor by numerical calculations (MC simulations [8, 9, 11], or density functional theories [12, 13, 14], respectively).
On the other hand, these studies could not point out any flaw in this more than twenty year old argument of de Gennes [7] either. In short, the argument of de Gennes starts from the well-known phenomenon of capillary condensation [1, 18, 19]. In an infinitely long slit-pore, the liquid-vapor transition is “shifted” relative to the bulk, due to the attractive forces between the fluid particles and the walls. The magnitude of the shift depends on the nature of the fluid and the type of walls. In addition, if “drying” rather than “wetting” would occur for very thick slits, also the opposite effect of “capillary evaporation” may take place [1, 18, 19]. In general, the chemical potential where liquid and vapor coexist inside a slit pore, differs from the bulk coexistence chemical potential , and this difference depends on the width of the slit pore. In an irregular interconnected pore network, the local pore diameter at position fluctuates randomly around some average value. As a result, the local chemical potential where phase coexistence would occur, will also exhibit (quenched) fluctuations around some average value (the fluctuations are quenched because the structure of the porous network does not change over time). The analogy to the RFIM is readily seen when the fluid is described as a lattice gas, since the latter is isomorphic to the Ising ferromagnet. In terms of the Ising ferromagnet, quenched random fluctuations in the local chemical potential, become isomorphic to quenched external field variables , with a random variable acting on the spin at the -th lattice site (which is precisely the random-field Ising model). This reasoning is also easily carried over to binary fluid mixtures [7].
In the present work, we contribute to the clarification of this problem, by presenting extensive MC data for a particularly simple model, namely the Asakura-Oosawa (AO) model [20, 21] of colloid-polymer mixtures, inside a quenched random porous medium. The AO model is known to capture bulk experimental observations very well (by bulk we mean in the absence of any porous medium), including phase separation [22, 23] and interfacial properties [24]. Computer simulations [25, 26, 27] have shown that bulk phase separation in the AO model, which occurs for sufficiently large polymers at sufficiently high polymer fugacity, belongs to the universality class of the Ising model [28, 29, 30, 31]. In addition, the standard predictions for capillary condensation in slit pores [18, 19, 32] have been well confirmed for this model [33, 34, 35, 36]. Following our previous work [37, 38], we now consider the more complex problem of the AO model inside a random porous medium. The porous medium is obtained using an “easy” recipe: we simply distribute a set of obstacles (spheres) at random positions in the simulation box. Once the spheres have been positioned, they remain “fixed”, to mimic the quenched nature of the medium. Next, the AO model is inserted into the medium, and its phase behavior is studied. In particular, we will focus on (appropriately constructed) “susceptibilities” of the form , with the conventional Gibbs-Boltzmann thermal average, and an average over many different realizations of the quenched obstacles. Of course, in the absence of the porous medium, any such “susceptibility” is trivially zero. However, in its presence, the analogy to the random-field Ising model implies that such quantities will actually diverge at the critical point, and will do so with a characteristic critical exponent .
The outline of our paper is as follows. In Section 2, we recall in detail the necessary background of finite size scaling in the Ising and the random-field Ising models, and we discuss how these techniques may be carried-over to fluids with quenched disorder. Next, in Section 3, we define the AO model, explain how this model may be extended to also capture quenched disorder, and we describe our simulation method. The results are presented in Section 4, and we end with a discussion, conclusion, and summary in the last section.
2 Finite size scaling in the Ising model, the random-field Ising model, and related models
2.1 Ising model
We first consider the pure Ising model, i.e. without any random field, and discuss how finite size scaling can be used to extract the critical properties of this model. To be specific, we consider a (nearest-neighbor) Ising ferromagnet on a hypercubic -dimensional lattice of linear dimension and periodic boundary conditions
| (1) |
with the exchange constant and an uniform external magnetic field. Defining the instantaneous magnetization per spin as
| (2) |
the object of interest is essentially the distribution
| (3) |
defined as the probability to observe a magnetization per spin , in a system of size , at temperature and field strength . Basic observables of interest follow from the moments of the distribution, where is a conventional Gibbs-Boltzmann thermal average. For instance, the average magnetization per spin can be written as
| (4a) | |||
| and for the susceptibility we obtain | |||
| (4b) | |||
where the factor has been absorbed in the definition of , with the Boltzmann constant. We emphasize that these expressions must be used with care when is bimodal. This happens, for example, at low temperature and , since then a spontaneous magnetization exists, which may be positive or negative. Consequently, has two peaks, one at positive and one at negative values. However, blindly applying Eq.(4a), one finds that irrespective of , which is not really desirable. Since the Ising model has spin reversal symmetry, we have , and so an easy fix is to introduce
| (4ea) | |||
| (4eb) | |||
which are to replace and in these cases. The absolute value has the same effect as using a modified distribution with the integration domain restricted to . Clearly, such a modification is reasonable when somewhat holds. For very asymmetric distributions, a safer approach is to define and in terms of peak positions and widths, respectively. This approach was successfully applied to the AO model in [27] and will also be used in this work later on. Of course, in the thermodynamic limit, all definitions become equivalent, see discussion in [39].
As is well known, for , the Ising model has a second order phase transition from the (disordered) high-temperature paramagnetic phase, to the (ordered) low-temperature ferromagnetic phase, at some critical temperature . In the vicinity of , we expect power law singularities [28]
| (4efa) | |||
| (4efb) | |||
| (4efc) | |||
with the reduced distance from the critical point, and the correlation length of the magnetization fluctuations. In the above, , , and are critical exponents, which characterize the universality class.
Of course, the divergence of the correlation length cannot be captured in a finite simulation box of size , and so the above power laws are never observed directly. The state-of-the-art is to perform several simulations, using a range of system sizes , and to extrapolate the simulation data to via finite size scaling. In its simplest form, finite size scaling is just the statement that, in a finite system at the critical point [28]. Eliminating from Eqs.(4efa) and (4efc), and using , one immediately derives the -dependence of the magnetization order parameter at the critical point
| (4efga) | |||
| Similarly, for the susceptibility, one obtains | |||
| (4efgb) | |||
These equations simply state that, if one performs a simulation at the critical point over a range of system sizes, the magnetization should vanish , and the susceptibility should increase .
The above scaling laws are quite general, and should hold near any critical point where the correlation length diverges as a power law, i.e. conform Eq.(4efc). If also the hyperscaling relation is obeyed
| (4efgh) |
with the spatial dimension, it follows that the entire distribution at scales with as [40]
| (4efgi) |
with the magnetization distribution of Eq.(3). Here, is a universal scaling function, which essentially depends on the universality class, and the scaling should hold in the limits , , with finite. Using Eq.(4efgi), one readily obtains the moments
| (4efgja) | |||||
| (4efgjb) | |||||
which also define the scaling functions . For , one recovers the average magnetization of Eq.(4a), and the expected scaling law Eq.(4efga) is correctly reproduced. For the susceptibility, however, these moments imply , consistent with Eq.(4efgb) only when hyperscaling holds. For the Ising model, hyperscaling indeed holds [28], and so the use of Eq.(4efgi) is justified here.
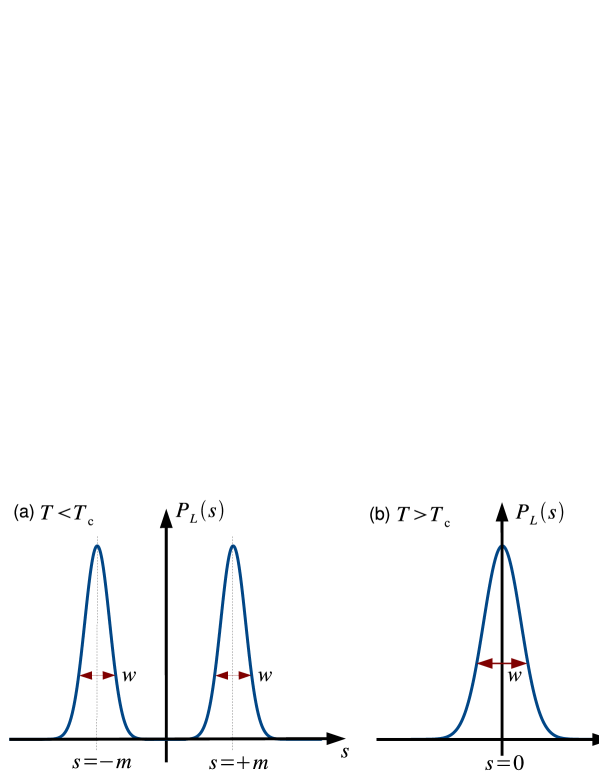
Hyperscaling also implies a remarkable property concerning the shape of at criticality. To see this, note first that, below , there exists a spontaneous magnetization. The magnetization may be positive () or negative (), and so features two peaks centered around , see Fig. 1(a). Each of the peaks may be approximated by a Gaussian [40]
| (4efgjk) |
leading to a squared peak width . In the thermodynamic limit, the peaks remain at their respective positions . At the same time, since the susceptibility away from is finite, the peaks also become increasingly narrow, eventually converging to a distribution consisting of two -peaks. The behavior in the disordered region follows analogously. In this case, a spontaneous magnetization is absent, and is just a single Gaussian, centered around , see Fig. 1(b). For , thus converges to a single -peak in the thermodynamic limit. Mathematically, the shape of the distribution in these two limiting cases can be expressed using the cumulant 111Of course, the cumulant is to be calculated for the full distribution. In particular, for , one should write .. After some algebra, one finds that
| (4efgjla) | |||
| (4efgjlb) | |||
Precisely at , the behavior of the cumulant is more subtle [40]. In a finite system at , the magnetization vanishes , see Eq.(4efga). Hence, still exhibits two peaks, at positions . For the root-mean-square peak width, we obtain , where now Eq.(4efgb) was used. Comparing the distance between the peaks to their widths, we find
| (4efgjlm) |
with . By virtue of hyperscaling one has , implying that the relative peak width does not vanish in the thermodynamic limit. Consequently, at criticality does not become a superposition of two -functions, but instead converges to a distribution of two overlapping peaks. The cumulant at differs therefore from the off-critical values [40]. By using Eqs.(4efgja) and (4efgjb), can be expressed in terms of the scaling functions as , which is a universal function of , and tends to a universal finite constant. In simulations, this result is useful since plots of versus for various system sizes will show a common intersection point, yielding an estimate of both and (cumulant intersection method [40]).
2.2 random-field Ising model: finite size scaling
The analysis of MC simulation [39, 41] data for systems belonging to the universality class of the random-field Ising model (RFIM) [17] has certain subtleties [42, 43], when one tries to apply finite size scaling methods [28, 40]. The source of the problem is that the standard hyperscaling relation [28] between critical exponents, which is required by Eq.(4efgi) [40], does not hold for the RFIM [17, 44, 45, 46, 47]. Since the presence of the random field breaks the spin reversal symmetry, it is necessary to consider also the “disconnected” susceptibility [45], in addition to the standard “connected” susceptibility .
The RFIM Hamiltonian reads as
| (4efgjlna) | |||
| with and defined as before. In addition, at each lattice site , there acts a quenched random field , which we take to be completely uncorrelated between neighboring sites, and with an average of zero | |||
| (4efgjlnb) | |||
The amplitude of the random field should be small but finite (), but we are not concerned with the crossover to the pure Ising model here, and hence disregard the limit . Basic observables are again the average magnetization per spin , the connected susceptibility , and the disconnected susceptibility
| (4efgjlnoa) | |||
| (4efgjlnob) | |||
| (4efgjlnoc) | |||
For the same reason as before, we also introduce
| (4efgjlnop) |
For the RFIM model, one has to perform the standard Gibbs-Boltzmann thermal average for one realization of the random field, followed by an average over different random field configurations , whereby should be large. Note that is simply the fluctuation of the average magnetization between different realizations of the random field. Due to random variations in these fields, will sometimes be negative, and sometimes be positive. In the limit , one has , of course, but the fluctuation will generally not be zero, which is essentially what corresponds to. We shall also be interested in the distributions
| (4efgjlnoq) |
defined as the probability to observe a magnetization per spin , in a system of size , at temperature and external field , for the -th random field realization. Note that we allow to vary between different random field realizations. Ideally, one would like to have , but since resources are limited, simulations always deal with finite .
Assuming that the RFIM, for small enough , has a second order phase transition at , we expect power law singularities for , , and as before, but with different critical exponents characteristic of the RFIM universality class [17, 45]. In addition, a power law is expected for the disconnected susceptibility
| (4efgjlnor) |
with a new critical exponent [17, 45]. It has been proved rigorously that the RFIM in dimensions, at low enough temperature, indeed exhibits a nonzero spontaneous magnetization [16]. It has not, however, been proved that the second order transition assumed above actually exists (also weak first order transitions [48], or spin-glass type phases [49] have been suggested). Recent MC simulations, however, favor a second order transition, albeit that the critical exponents are still not known very accurately [50, 51].
While for the pure Ising model we have the standard hyperscaling relation between critical exponents [28], for the RFIM, rather a different relation has been proposed [44]
| (4efgjlnos) |
Here, is an exponent which measures the deviation from the standard hyperscaling relation; when it is zero, standard hyperscaling is again recovered. Using the further result that [45], it follows that .
We now discuss finite size scaling in the RFIM, following Eichhorn and Binder [42, 43]. Note first that the “derivation” of Eqs.(4efga) and (4efgb) still holds. Hence, and scale with as before, albeit with different exponents. Similarly, for the scaling of the disconnected susceptibility at , we expect that
| (4efgjlnot) |
If we assume that each distribution scales conform Eq.(4efgi), it follows that and scale according to Eqs.(4efgja) and (4efgjb), respectively (the subscript denotes that the thermal average was taken in the -th random field realization). Of course, the scaling functions may depend on the particular random-field realization, but the leading dependence will be the same each time. Since by definition , it follows trivially that the -dependence implied by Eqs.(4efgja) and (4efgjb), appears in the quenched average also. We thus obtain
| (4efgjlnou) |
with redefined scaling functions , which can be expressed in terms of the functions , of course, but for our subsequent discussion the precise form does not matter. Using the definitions of , and the above equation implies
| (4efgjlnov) |
On the other hand, finite size scaling also demands that and . The solution of the paradox is to require that
| (4efgjlnow) |
which correctly sets the scaling of , and also that and . Note that Eq.(4efgjlnow) is just the standard hyperscaling relation, but with replaced by . Hence, even though normal hyperscaling in the RFIM does not hold, Eq.(4efgi) still gives a consistent description of finite size scaling, but one must accept that the connected susceptibility is not described by it, since the leading terms in and cancel. To also describe the scaling of and , one needs to include the leading correction to scaling. This correction can be derived by assuming that at and below is a superposition of two Gaussians. Expressing the peak at positive magnetization as , it follows that and . Performing the quenched average, we now obtain a non-zero expression for the connected susceptibility . This term, consequently, is the sought-for correction; finite size scaling then implies that at criticality.
Since , it also follows that the cumulant at criticality in the RFIM tends to unity [42, 43]. The shape of the quenched-averaged distribution at is therefore similar to that below : both distributions are characterized by in the thermodynamic limit. Hence, also at , we have a distribution featuring two -peaks 222Of course, whereas for the peak positions scale , they saturate at finite values when .. This is profoundly different from systems where hyperscaling holds, since here tends to a non-trivial value different from the off-critical values (as explained in the previous section). For the RFIM, plots of versus , for various system sizes , no longer intersect. In practice, however, the system sizes feasible in simulations are still quite small, and so one is plagued by “cross-over” effects [52] (in this case from Ising to RFIM universality). This means that an intersection point can typically still be identified, but it occurs at a value much closer to of the RFIM [50, 43, 37] 333Note in particular Figure 7 of [50] for the RFIM.. The fact that the quenched-averaged distribution in the RFIM remains sharp at criticality, in contrast to overlapping, is also obvious from Eq.(4efgjlnow). Considering again the ratio between peak-width and peak-to-peak distance, i.e. conform Eq.(4efgjlm), one finds that . Using the result of Schwartz that [45], it immediately follows that . In other words, for the RFIM at its critical point, the relative peak width vanishes, leading to a distribution featuring two -peaks.
2.3 random-field Ising model: sample-to-sample fluctuations
The result of Schwartz [45], namely that , can be made plausible when we consider one particular realization of the random field. In a volume , roughly half the lattice sites “feel” a negative random field (and the other half a positive random field, obviously) but with Poissonian fluctuations. Hence, there will typically be an excess Zeeman energy of order , which has the same physical effect as if an uniform external field of strength
| (4efgjlnox) |
acted on the spins in this volume (recall that is the strength of the random field). But then we expect a non-zero magnetization in this sample, with the connected susceptibility. Using near the standard finite size scaling relations for and , we obtain , or . Combining with Eq.(4efgjlnow) one finds that .
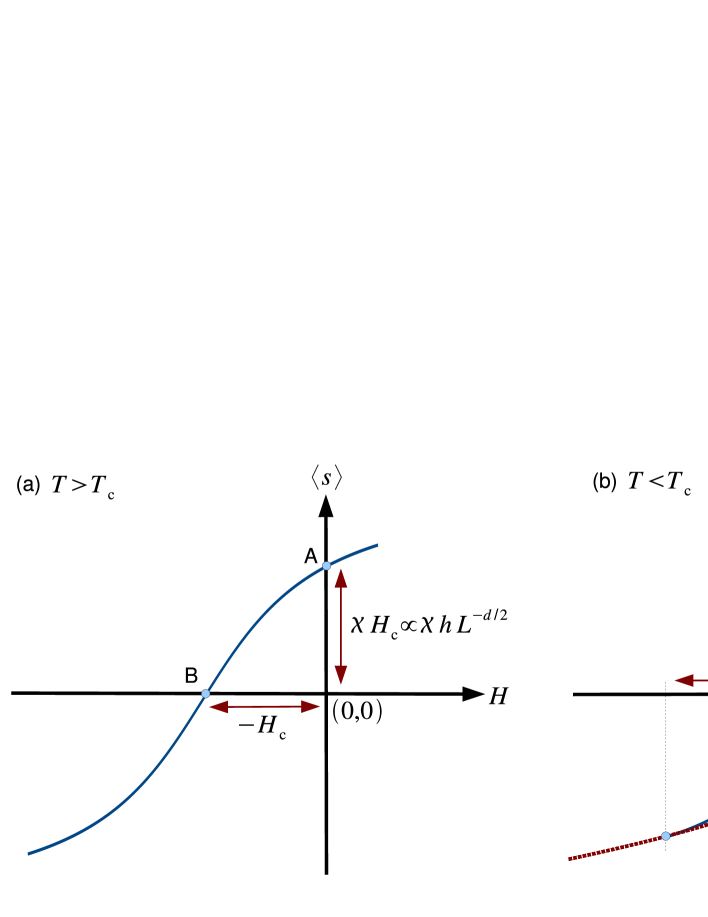
It is of some interest to explore the consequences of Eq.(4efgjlnox) further, and study the behavior of the magnetization for different realizations of the random field. If and , we have for a positive magnetization of order as argued above (recall that is the strength of the uniform external field). The field at which the susceptibility is maximized is therefore not , but rather , where the net effect of the random field is canceled. This is sketched in Fig. 2(a), where versus is plotted 444Of course, the graph of versus is anti-symmetric about the origin, since in the quenched average both signs of appear equally often.. Taking the limit , it follows that the slope of the curve at points A and B becomes the same, since, on the small scale of , the curve may be approximated by a straight line. Note that the slope approaches the zero-field susceptibility , and also that the slope is independent of . Plotting versus for different realizations of the random field, one thus obtains a set of parallel straight lines. In other words, is rather insensitive to the particular random field configuration, which just expresses the fact that the system is self-averaging for , as expected [53, 54]. This result is important since, in systems lacking spin reversal symmetry, the natural path in the -plane to follow is no longer the line , but rather the path along which assumes its maximum for each realization of the random field.
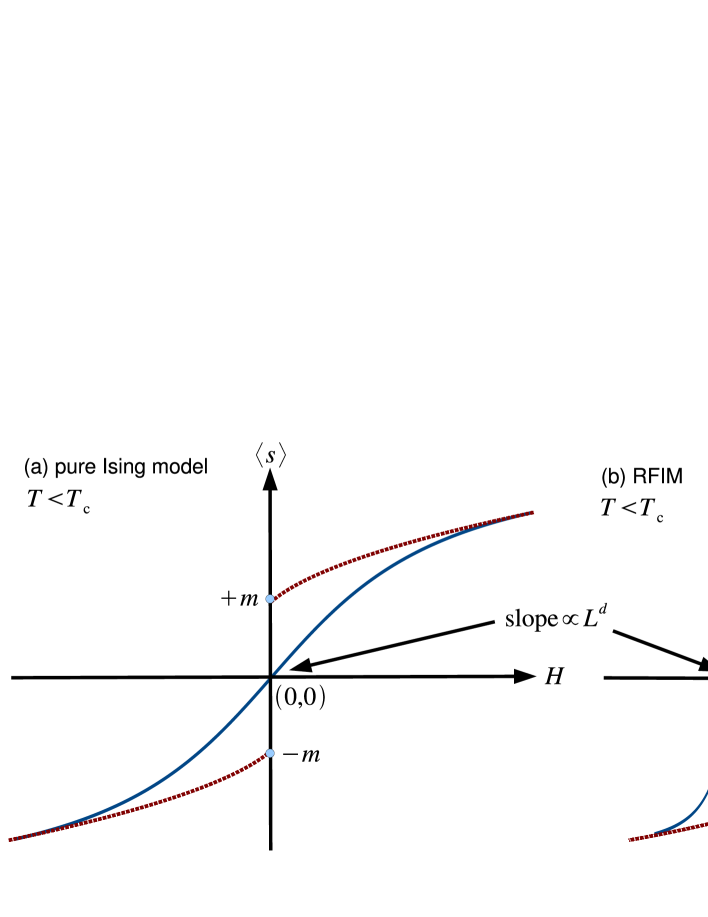
The situation is qualitatively different for , of course, since we now expect a first-order transition and, consequently, two-phase coexistence. In the pure Ising model, coexistence between two states (with positive and negative spontaneous magnetization ) occurs at , irrespective of the system size . In the thermodynamic limit, increases monotonically with , and jumps from to at ; see the dotted curve in Fig. 3(a). In a finite system, the transition is rounded, and a true jump does not appear. Instead, passes smoothly through the origin, but with slope [55, 56], consistent with the formation of a jump in the thermodynamic limit; see the full curve in Fig. 3(a). Consequently, phase coexistence in the pure Ising model may always be studied using . Provided is sufficiently below , double-peaked distributions are readily observed, i.e. conform Fig. 1(a), from which the coexistence properties follow.
For the RFIM below and finite system size , the behavior is more subtle, since the random field breaks the spin reversal symmetry. We still expect a (rounded) first-order transition, but centered around the shifted field , see Fig. 3(b). In the thermodynamic limit, , and so the magnetization jumps, as before, at (dotted curve). In a finite system increases smoothly with (solid curve), passing through zero at (point A), with slope . Since asymptotically exceeds the rounding, it follows that, in a finite system at , phase coexistence is unlikely. At , one either observes the phase with positive magnetization (as one would in Fig. 3(b)), or, if the random field happens to resemble , a negative magnetization. Only very rarely, when the inflection point A happens to coincide with , will both phases be observed simultaneously. Hence, at , the distribution will mostly feature just one peak, located at positive or negative values. In the quenched average, one recovers , of course, but the fluctuation is not zero, since this, apart from a factor , is precisely the disconnected susceptibility, see Eq.(4efgjlnoc). Clearly, to study phase coexistence in simulations, it does not make sense to use , since one would rarely see a double-peaked distribution. Instead, it is more meaningful to obtain these properties at the inflection point A, where attains its maximum. To be precise: one should apply an external field “tailored” for each random-field realization. In the limit , one has , and coexistence properties obtained at the inflection point, will agree with those obtained at . The advantage of the former method being that double-peaked distributions will now already appear in much smaller systems. Of course, for these double-peaked distributions, will be close to zero each time, and so it follows that a different definition for the disconnected susceptibility should be used, presumably of the form .
Considering now the behavior of versus below , we expect the scenario of Fig. 2(b). In the thermodynamic limit, a jump in at is anticipated. In finite systems, the jump is rounded, but on a more severe scale , as pointed out by Kierlik et al[14]. Note that graphs of versus for finite intersect the origin since, in the quenched average, both signs of are equally likely.
Unfortunately, these arguments cannot be easily extended to . As discussed in detail by Wiseman and Domany [53, 54], systems with quenched random disorder at criticality exhibit lack of self-averaging. For small enough fields , it still holds that versus for one realization of the random field, is a straight line, with slope . The same holds for versus , where the slope is also , but the prefactors differ. The ratio of these prefactors is a quantity characterizing the lack of self-averaging, in the sense of Wiseman and Domany [53, 54].
2.4 obtaining the quenched average using a sample dependent
For the Ising model, one knows beforehand that the inflection point of versus (or versus in case of the RFIM), occurs on the symmetry line . Hence, varying at fixed , one cannot miss the critical point. In less symmetric models, the field at the inflection point is not known beforehand. In these cases, it is clearly more convenient to follow the path in the -plane of each random-field realization. That is, for each realization of the random field , one numerically locates the field where in that sample is maximized. Properties of interest are then collected at , and the process is repeated over many different random field samples. Extrapolating the data to is demanding in practice, but does not present any principal objections. Only the prefactors of the finite size scaling laws at criticality
| (4efgjlnoy) |
will differ from those of the standard quenched-average obtained at fixed . Here, the overbar denotes averaging at the sample dependent . Since many typical fluids (including the AO model) are asymmetric, collecting the quenched average as simply becomes a necessity in these cases.
2.5 extension to fluids
We now consider a liquid-vapor transition of a fluid confined to a quenched porous medium. We use the grand canonical (GC) ensemble, i.e volume , temperature , and chemical potential are fixed, but the number of particles in the system fluctuates. Our analysis is based on the (normalized) distribution
| (4efgjlnoz) |
defined as the probability to observe a system containing particles, in the -th realization of the porous medium. Note the dependence on and , and also that we allow the chemical potential to vary between different realizations of the porous medium. For given and , is sampled from to , using a biased sampling scheme [57]. This process is repeated for different realizations of the porous medium. The sampling scheme is constructed to visit the full range irrespective of the imposed chemical potential. Hence, we set in the simulations, and use histogram reweighting [58] to extrapolate to different values afterward.
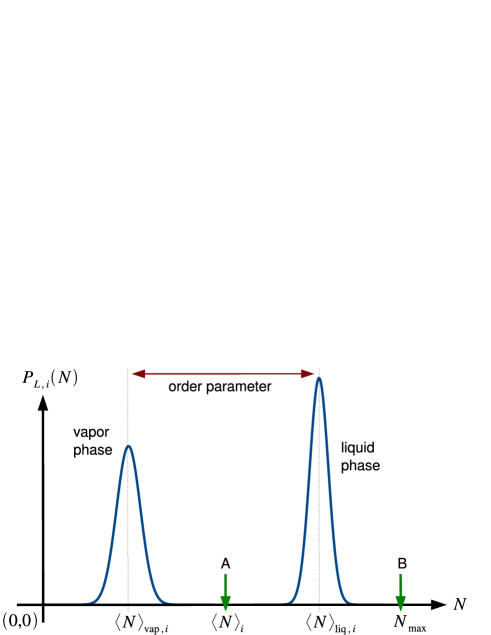
Assuming that the liquid-vapor transition in a porous medium belongs to the universality class of the RFIM, we expect, in the thermodynamic limit, a critical point at temperature and chemical potential . Below , we anticipate bimodal distributions , but only if is chosen reasonably. In finite systems, we actually expect the bimodal form to persist considerably above also, since, for the RFIM, remains sharp at criticality. In this work, is tuned for each realization of the porous medium such that for that realization is maximized, with 555Note that other choices are conceivable also, such as the “equal-area-rule” [56, 59], or the generalized -locus defined in [60]; all become identical in the limit , of course.. Loosely identifying , , our choice may be regarded as the analogue of the inflection point A in Fig. 3(b) for the magnetic case.
Fig. 4 shows a schematic of in bimodal form. The left peak represents the vapor, the right peak the liquid, with the average of the full distribution located in between (arrow A). Fig. 4 also shows that should be chosen well beyond the liquid peak (arrow B). If we shift by its average, we approximately recover the Ising symmetry of the magnetization distribution. Taking the quenched average, this requires a shift over . Therefore,
| (4efgjlnoaa) |
in a fluid with quenched disorder, is the analogue of in a magnetic system, where the factor is needed because is the magnetization per spin. Replacing in the definitions of and by Eq.(4efgjlnoaa), one obtains
| (4efgjlnoab) | |||
| (4efgjlnoac) |
as the analogues of the connected and disconnected susceptibility in a fluid with quenched disorder. As stated before, and are analyzed for the vapor and liquid phase separately, using as a “cut-off” separating the peaks in . In this way, we obtain for the vapor phase
| (4efgjlnoad) |
where the factor-of-two is a consequence of the normalization of . The moments of the liquid are obtained similarly, with the summation from to . The connected and disconnected susceptibilities of the vapor phase can now be written as
| (4efgjlnoae) |
with the quenched average conveniently expressed in terms of Eq.(4efgjlnoad) as . Similar expressions hold for and also. Note that, since the chemical potential is “fine-tuned” for each realization of the porous medium, the quenched average obtained above actually corresponds to of Eq.(4efgjlnoy), but this should be obvious from our discussion. For completeness, we remark that the quenched-averaged distance between the peaks in Fig. 4 may be used as order parameter , although in this work the emphasis is on the susceptibilities.
Of course, it needs to be verified in simulations if the expected bimodal form of really occurs in practice. In our previous work, this turned out to be the case [37]. However, GC simulations of the Lennard-Jones fluid with quenched disorder have revealed distributions with three peaks also [9]; the possibility of two fluid phase transitions occurring has also been suggested [10], although this probably does not survive in the quenched average [11].
3 Model and simulation method
3.1 AO model
We now proceed to test the concepts of the previous section in a colloid-polymer mixture with quenched disorder. Our primary aim is to measure the connected and disconnected susceptibilities, and to show that both diverge at criticality. To describe the mixture, we use the AO model [20, 21]. In this model, colloids (species c) and polymers (species p) are treated as spheres with respective diameters and . Hard sphere interactions are assumed between colloid-colloid and colloid-polymer pairs, while the polymer-polymer interaction is taken to be ideal. In this work, is the unit of length, the colloid-to-polymer size ratio , and the spatial dimension will be . The behavior of this model for without quenched disorder has been studied before [36], and bulk phase separation, whereby the mixture “splits” into a colloid-rich (polymer poor) and colloid-poor (polymer rich) domain, was readily observed. If one “identifies” the colloid-rich phase with a liquid, and the colloid-poor phase with a vapor, the phase separation can be treated in much the same way as a liquid-vapor transition. In the GC ensemble, one then introduces the colloid chemical potential , and, following convention, the polymer “chemical potential” 666Strictly speaking, is defined as the polymer reservoir packing fraction [22]. For the present case of ideal polymers , with the polymer chemical potential, and the thermal wavelength.. Phase separation occurs at the coexistence colloid chemical potential , for values of exceeding the critical value ( is therefore the analogue of inverse temperature; for , has been reported [36]). The discussion and definitions of Section 2.5 thus trivially “carry-over” to the AO model if one identifies , , and .
3.2 AO model with quenched disorder
To study the AO model with quenched disorder, we introduce a third species Q of immobile (quenched) particles. These particles are also spheres, with diameter , and they are distributed in the simulation box at the start of each simulation (the simulation box, incidentally, is a cube of volume with periodic boundary conditions). The quenched particles, of them in total, are located at random positions, irrespective of overlap. Consequently, the structure of the quenched system is just that of an ideal gas. The average packing fraction of the quenched system is fixed at , but, consistent with our GC approach, we allow for Poissonian fluctuations around the average. From a computational point of view, the quenched system is trivial to generate: one simply draws from a Poisson distribution, and generates a corresponding number of positions in the simulation box. Next, a GC simulation of the AO model is performed in the simulation box containing the quenched system, whereby the colloid and polymer positions are continuously updated, but not the positions of the quenched particles, of course. The colloids and polymers interact with the quenched particles in a simple way: colloids may not overlap with quenched particles, while the polymers may overlap freely with them. Of course, computational efficiency is the main motivation for using such simple interactions, although one could envision similar interactions in experiments also, using polymer quenched disorder. In any case, the simple approach adopted here is appealing, as previous work indicates [13, 37, 38]. An estimate has also already been reported [37], for the exact same parameters as considered here.
3.3 implementation details
We now discuss some implementation details. For the -th realization of the quenched system, grand canonical MC is used to measure of Eq.(4efgjlnoz), with the number of colloids. The distribution is obtained using the (already mentioned) biased sampling scheme [57], in conjunction with a cluster move [25, 61]. The cluster move is needed to alleviate the otherwise (too) slow equilibration of the AO model. Of course, simulations of a single-component fluid do not require the cluster move. We consider system sizes . For each system size, is typically measured for (!) realizations of quenched disorder, at several values of in the vicinity of . Large values of are needed to obtain accurately.
In GC simulations, particles are continuously inserted and deleted from the simulation box, and so one can define a time after which a given population of particles has been completely “updated” by new ones. The duration of a GC simulation may therefore be expressed in units of . In the biased sampling scheme [57], simulation time can be conveniently allocated, since the scheme constructs step-by-step via so-called windows. In the first window, varies between 0 and 1, in the next window between 1 and 2, and so forth, up to (the number of polymers fluctuates freely in each window, of course). Hence, we allocate a fixed amount of simulation time, typically , to each window. It then takes roughly 12 minutes to obtain for , and about 1 hr for . Of course, these benchmarks depend on , as well as on the precise computer architecture, but they suffice to give an overall impression of how much computer time was used.
A final remark concerns the implementation of histogram extrapolation [58]. As stated earlier, all simulations are performed at colloid chemical potential , and is used to extrapolate to different values. Obviously, a similar expression holds for the polymers also, which one could use to extrapolate in . In fact, an important ingredient of this work is precisely the latter extrapolation, and our analysis would become extremely cumbersome without it. However, this requires that we store the full two-dimensional histogram , with the number of colloids, and the number of polymers. Since we typically consider 2000 realizations of quenched disorder, storage requirements become enormous. Fortunately, storage can be reduced tremendously, when one realizes that, for a fixed number of colloids , the corresponding distribution in is to a good approximation a single Gaussian peak. For this is obvious, since then we have a pure polymer system, but it holds well for also. Hence, to facilitate extrapolations in , we only need to store the average and variance in for each window (which costs only very little storage, at no cost in CPU time either). We have verified this approach and checked that results obtained at one value of indeed extrapolate to those obtained at a different value (not too far away, of course). Note also that the histogram extrapolation method itself can be optimized since, for a Gaussian distribution, integrations over can be performed exactly beforehand; the resulting expressions become functions of the average and variance, which can be hard-coded.
4 Results
4.1 sample to sample fluctuations


The analysis of Section 2.5 requires that the distributions are somewhat bimodal, i.e. that they resemble the schematic shape of Fig. 4. In order to verify this, we show, in Fig. 5, for a number of realizations of quenched disorder, at a value of significantly below the critical value . Clearly, the bimodal shape is already present in most distributions, even for this low value of . Of course, by making even lower, the bimodal shape will eventually vanish for all realizations of quenched disorder, since we then enter the one-phase region where is just a single peak, conform Fig. 1(b). In any case, Fig. 5 does confirm our expectation that, for random-field Ising universality, bimodal distributions persist well above (recall that is the analogue of inverse temperature). Fig. 5 also reveals that not all the distributions are bimodal, see, for example, the distribution in the upper left corner. In these cases, splitting the distribution in half at the average is not meaningful anymore, although numerically this can still be applied. Since, for the thousands of distributions generated in our simulations, inspecting each one visually by hand is not feasible, the (occasional) single-peaked distribution is treated in the same way as the bimodal ones. Of course, single-peaked distributions become increasingly rare upon increasing , as Fig. 6 clearly indicates, where the same realizations of quenched disorder were used as in Fig. 5. Note that, in Fig. 6, all distributions now feature two peaks.
Another feature that emerges from these figures is that the vapor peak is much sharper than the liquid peak. This appears to be a non-universal feature that depends on the interaction between fluid and quenched particles. In our previous work, we have studied a different type of quenched disorder, whereby also the polymers were not allowed to overlap with the quenched species [37, 38]. In this case, a reversed trend was observed, namely a sharp liquid peak “coexisting” with a much broader vapor.

Having shown that our assumption of bimodal distribution shape is a reasonable one, we need to determine the number of quenched disorder realizations typically required to obtain and accurately. To this end we show, in Fig. 7, the variation of these quantities as a function of , for two system sizes , and several values of (as indicated in the label of each subplot). The trends revealed in Fig. 7 are typical for other state-points also. Clearly, from this figure, we conclude that should be of the order of 1000 at least. Larger values are better still, but then we meet the limit of our computational resources.


4.2 connected susceptibility
We now consider the connected susceptibility, first of the liquid phase. Shown in Fig. 8(a) is versus , for several system sizes. Note the presence of the peak. Consistent with finite size scaling, the peak height increases with ; the latter could now be fitted to Eq.(4efgb) to obtain . However, a more stringent test is to plot
| (4efgjlnoaf) |
with the relative distance from the critical point. Although not derived in this work, finite size scaling implies that data from different system sizes, when scaled conform Eq.(4efgjlnoaf), collapse onto a single master curve, provided the correct values of , , and are used 777The derivation is straightforward, see for example [41].. In Fig. 8(b) the resulting scaling plot is shown, where , , and were used. The quality of the collapse is clearly very good. However, we noticed that good collapses were obtained for different values also, typically and , which gives an indication of the uncertainty. The problem is that both and follow from the -dependence of the peak positions. Over the range of available system sizes, the shift in the peak positions is rather small, and hence large uncertainties in and are unavoidable. In contrast, can be obtained more reliably, since the latter is set by the peak height versus , which yields a more pronounced numerical signature. Similar conclusions are reached for the connected susceptibility of the vapor, see Fig. 9.


4.3 disconnected susceptibility
We now come to the main result of this work, namely the behavior of the disconnected susceptibility. If fluids with quenched disorder belong to the universality class of the RFIM, the analogue of defined in Section 2.5 should diverge with critical exponent . Since [45], the divergence should be very pronounced, much more pronounced than that of the connected susceptibility, in fact. In Fig. 10(a), we show of the liquid phase versus for several system sizes. The formation of a peak is clearly visible. Note also the rapid growth of the peak height: increasing the system size from , the disconnected susceptibility increases by a factor of more than six, compared to a factor of about three for the connected susceptibility. The corresponding scaling plot is shown in Fig. 10(b), which now involves , of course. Using , , and , the data collapse convincingly, confirming the power law divergence of . For the same reason as before, the scaling plot is rather insensitive to and , and so the uncertainty in these quantities is similar as before, but the ratio should again prove reliable. In Fig. 11(a) we plot the disconnected susceptibility of the vapor phase versus , but only for . For reasons we do not yet fully understand, the statistical uncertainty in is very large. While the growth of a peak with system size is still confirmed, the data clearly do not lend themselves for measuring critical exponents, and so a scaling plot is not attempted here. One reason for the large statistical uncertainty in is the smaller number of particles in the vapor phase (compared to the liquid).

4.4 scaling of the cumulant
In Fig. 12(a), we show the cumulant as a function of for several system sizes. Recall that the cumulant is defined as , with , which can be calculated straightforwardly from the distributions 222In our previous work [37], we used , but the reader can verify following Section 2.2 that both definitions become equivalent for .. As expected, the cumulants from different system sizes do not intersect at criticality, but instead reveal a scatter of intersection points, close to of the RFIM. This behavior is conform our discussion of Section 2.2, and confirms that remains sharp at the critical point, featuring two well-separated peaks, since hyperscaling is now violated.
For comparison, Fig. 12(b) shows the cumulant of the AO model in the pure system, i.e. without quenched disorder. In this case, hyperscaling is not violated, and a sharp intersection point is indeed revealed, occurring at a value different from the off-critical values and , respectively. For Ising systems in dimensions, we expect that [62], marked by the horizontal line in Fig. 12(b), and our data indeed intersect close to this value (some deviation is clearly apparent, but to account for this would require a field-mixing analysis [63, 26]). From the intersection point, we also conclude for the pure system, which compares well to the estimate reported in [36].

4.5 chemical potential
Finally, we consider the average and variance of the chemical potentials at which our data were obtained. Recall that, for each realization of quenched disorder, we use a “fine-tuned” chemical potential , chosen at the maximum of for that realization. Hence, it is interesting to consider the quenched-averaged chemical potential and its variance , with . Shown in Fig. 11(b) is versus for several system sizes. The data do not reveal any strong -dependence, which is similar to that observed in fluids without quenched disorder. Of more interest is the variance, which should vanish for . Shown in Fig. 13(a) is versus , and the decrease of this quantity with increasing is clearly visible. Kierlik et alhave shown that, below in the two-phase region, the variance of the chemical potential vanishes [14]. Plotting therefore versus , see Fig. 13(b), we observe that this prediction holds quite well for our data also.
5 Discussion and summary
We have explained finite size scaling in the random-field Ising model, and shown how this technique may be applied to a fluid with quenched disorder. We have also defined the analogue of the disconnected susceptibility for the latter. If fluids with quenched disorder belong to the universality class of the random-field Ising model, as conjectured by de Gennes [7], should diverge at criticality, and so our definition facilitates further tests of this conjecture. To perform one such test has been the topic of the present work, using the Asakura-Oosawa model of a colloid-polymer mixture confined to a random porous medium. Our data are indeed compatible with a divergence of . Moreover, for the liquid phase, we even recover , in quantitative agreement with the prediction of Schwartz for the random-field Ising model [45]. Our estimate of the correlation length exponent , although not very precise, is also consistent with reported random-field Ising estimates [50, 51]. Hence, the present results confirm our earlier study [37], where evidence of random-field Ising universality in fluids with quenched disorder was also presented, but based on the shape of at criticality. We also remind the reader of the large number of porous medium realizations used in our analysis. As the “moving averages” of Fig. 7 indicate, such numbers become a necessity, if and are to be obtained with any meaningful accuracy.
Finally, we turn to a discussion of possible applications of our work to experiments. The prototype experimental realization of a fluid with quenched disorder is an atomic fluid injected into silica aerogel. This realization has the disadvantage that the coupling between the porous medium and the fluid is weak [3, 4], as manifested by the small shift of the critical temperature (compared to the system without quenched disorder). Moreover, the characteristic length over which the aerogel structure appears random is very large, compared to the size of the fluid molecules. In this respect, colloidal fluids may offer an attractive alternative. Note that investigations of critical phenomena in colloid-polymer mixtures without quenched disorder [64, 65] are already experimentally feasible: critical interface and density fluctuations can be visualized directly [66, 67] using confocal microscopy [68]. In principle, such confocal experiments could be extended to include quenched disorder also. The generation and synthetization of quenched colloidal porous media has received considerable attention [69, 70, 71]. One could envision an experiment whereby a colloid-polymer mixture is injected into a rigid colloidal gel. Such gels could be formed using small nanoparticles which can grow into randomly branched networks at volume fractions of only a few percent [71]. The size of these nanoparticles can be much smaller than the typical colloid or polymer diameter, and so one can easily reach the regime where the critical correlations of the colloid-polymer mixture average over the random structure of the gel. Another feasible realization would be to use a polymer blend containing nanoparticles of suitable size, such that the diffusion of these particles in the blend is small. The structure formed by the nanoparticles will then appear to be frozen (quenched) on the timescales needed for the critical correlations of the polymer blend to equilibrate. The latter could then be measured using, for example, light scattering 333We are indebted to G. Fytas for a stimulating discussion of this point.. In any case, we hope that the simulational efforts of the present work will stimulate experimental efforts also, in order to completely settle this longstanding problem.
References
References
- [1] Lev D Gelb, Gubbins KE, Radhakrishnan R, and Sliwinska-Bartkowiak M, Reports on Progress in Physics 62, 1573 (1999).
- [2] Gregg S, Adsorption, Surface Area and Porosity (Academic Press, London, England, 1982).
- [3] Wong APY and Chan MHW, Phys. Rev. Lett. 65, 2567 (1990).
- [4] Wong APY, Kim SB, Goldburg WI, and Chan MHW, Phys. Rev. Lett. 70, 954 (1993).
- [5] Zhuang Z, Casielles AG, and Cannell DS, Phys. Rev. Lett. 77, 2969 (1996).
- [6] Tulimieri DJ, Yoon J, and Chan MHW, Phys. Rev. Lett. 82, 121 (1999).
- [7] de Gennes PG, J. Phys. Chem. 88, 6469 (1984).
- [8] Kierlik E, Rosinberg ML, Tarjus G, and Monson PA, J. Phys.: Condens. Matter 8, 9621 (1996).
- [9] Álvarez M, Levesque D, and Weis JJ, Phys. Rev. E 60, 5495 (1999).
- [10] Page KS and Monson PA, Phys. Rev. E 54, 6557 (1996).
- [11] Sarkisov L and Monson PA, Phys. Rev. E 61, 7231 (2000).
- [12] Schöll-Paschinger E, Levesque D, Weis JJ, and Kahl G, Phys. Rev. E 64, 011502 (2001).
- [13] Schmidt M, Schöll-Paschinger E, Köfinger J, and Kahl G, J. Phys.: Condens. Matter 14, 12099 (2002).
- [14] Kierlik E, Monson PA, Rosinberg ML, and Tarjus G, Journal of Physics: Condensed Matter 14, 9295 (2002).
- [15] Imry Y and Ma Sk, Phys. Rev. Lett. 35, 1399 (1975).
- [16] Imbrie JZ, Phys. Rev. Lett. 53, 1747 (1984).
- [17] Nattermann T, in: AP Young (ed.), Spin Glasses and Random Fields, p. 277 (World Scientific, Singapore, 1998).
- [18] Evans R, Journal of Physics: Condensed Matter 2, 8989 (1990).
- [19] Binder K, Landau D, and Müller M, J. Stat. Phys. 110, 1411 (2003).
- [20] Asakura S and Oosawa F, J. Chem. Phys. 22, 1255 (1954).
- [21] Vrij A, Pure Appl. Chem. 48, 471 (1976).
- [22] Lekkerkerker H, Poon W, Pusey P, Stroobants A, and Warren P, Europhys. Lett. 20, 559 (1992).
- [23] Aarts D, Tuinier R, and Lekkerkerker H, J. Phys.: Condens. Matter 14, 7551 (2002).
- [24] Brader JM, Evans R, Schmidt M, and Löwen H, J. Phys.: Condens. Matter 14, L1 (2002).
- [25] Vink RLC and Horbach J, J. Chem. Phys. 121, 3253 (2004).
- [26] Vink RLC and Horbach J, J. Phys.: Condens. Matter 16, S3807 (2004).
- [27] Vink RLC, Horbach J, and Binder K, Phys. Rev. E 71, 011401 (2005).
- [28] Fisher ME, Rev. Mod. Phys. 46, 597 (1974).
- [29] Fisher ME and Zinn SY, J. Phys. A: Math. Gen. 31, L629 (1998).
- [30] Zinn-Justin J, Physics Reports 344, 159 (2001).
- [31] Binder K and Luijten E, Physics Reports 344, 179 (2001).
- [32] Fisher ME and Nakanishi H, The Journal of Chemical Physics 75, 5857 (1981).
- [33] Vink RLC, Binder K, and Horbach J, Phys. Rev. E 73, 056118 (2006).
- [34] Vink RLC, De Virgiliis A, Horbach J, and Binder K, Phys. Rev. E 74, 031601 (2006).
- [35] De Virgiliis A, Vink RLC, Horbach J, and Binder K, Europhys. Lett. 77, 60002 (2007).
- [36] Fortini A, Schmidt M, and Dijkstra M, Phys. Rev. E 73, 051502 (2006).
- [37] Vink RLC, Binder K, and Löwen H, Phys. Rev. Lett. 97, 230603 (2006).
- [38] Pellicane G, Vink RLC, Caccamo C, and Löwen H, Journal of Physics: Condensed Matter 20, 115101 (2008).
- [39] Binder K and Heermann DW, Monte Carlo Simulation in Statistical Physics: An Introduction (Springer, Berlin, Germany, 2002).
- [40] Binder K, Z. Phys. B 43, 119 (1981).
- [41] Newman MEJ and Barkema GT, Monte Carlo Methods in Statistical Physics (Clarendon Press, Oxford, 1999).
- [42] Eichhorn K and Binder K, Europhys. Lett. 30, 331 (1995).
- [43] Eichhorn K and Binder K, Journal of Physics: Condensed Matter 8, 5209 (1996).
- [44] Villain J, J. Phys. (Paris) 43, L551 (1982).
- [45] Schwartz M, J. Phys. C: Solid State Phys. 18, 135 (1985).
- [46] Fisher DS, Phys. Rev. Lett. 56, 416 (1986).
- [47] Schwartz M, Gofman M, and Natterman T, Physica A 178, 6 (1991).
- [48] Young AP and Nauenberg M, Phys. Rev. Lett. 54, 2429 (1985).
- [49] Mézard M and Monasson R, Phys. Rev. B 50, 7199 (1994).
- [50] Rieger H, Phys. Rev. B 52, 6659 (1995).
- [51] Newman MEJ and Barkema GT, Phys. Rev. E 53, 393 (1996).
- [52] Freire F, O’Connor D, and Stephens CR, J. Stat. Phys. 74, 219 (1994).
- [53] Wiseman S and Domany E, Phys. Rev. E 52, 3469 (1995).
- [54] Wiseman S and Domany E, Phys. Rev. E 58, 2938 (1998).
- [55] Privman V and Fisher ME, J. Stat. Phys. 33, 385 (1983).
- [56] Binder K and Landau DP, Phys. Rev. B 30, 1477 (1984).
- [57] Virnau P and Müller M, J. Chem. Phys. 120, 10925 (2004).
- [58] Ferrenberg AM and Swendsen RH, Phys. Rev. Lett. 61, 2635 (1988).
- [59] Borgs C and Kappler S, Phys. Lett. A 171, 37 (1992).
- [60] Orkoulas G, Fisher ME, and Panagiotopoulos AZ, Phys. Rev. E 63, 051507 (2001).
- [61] Vink RLC, in: DP Landau, SP Lewis, and HB Schüttler (eds.), Computer Simulation Studies in Condensed Matter Physics, vol. XVII, p. 45 (Springer, Berlin, 2004).
- [62] Luijten E, Fisher ME, and Panagiotopoulos AZ, Phys. Rev. Lett. 88, 185701 (2002).
- [63] Bruce AD and Wilding NB, Phys. Rev. Lett. 68, 193 (1992).
- [64] Poon WCK, Journal of Physics: Condensed Matter 14, R859 (2002).
- [65] Ramakrishnan S, Fuchs M, Schweizer KS, and Zukoski CF, The Journal of Chemical Physics 116, 2201 (2002).
- [66] Aarts DGAL, Schmidt M, and Lekkerkerker HNW, Science 304, 847 (2004).
- [67] Royall CP, Aarts D, and Tanaka H, Nature Physics 3, 636 (2007).
- [68] Vossen DLJ, van der Horst A, Dogterom M, and van Blaaderen A, Review of Scientific Instruments 75, 2960 (2004).
- [69] Hoa MLK, Lu M, and Zhang Y, Advances in Colloid and Interface Science 121, 9 (2006).
- [70] Kluijtmans SGJM, Koenderink GH, and Philipse AP, Phys. Rev. E 61, 626 (2000).
- [71] Cho EC, Kim JW, Fernández-Nieves A, and Weitz DA, Nano Letters 318, 1895 (2008).