Primary gas thermometry by means of laser absorption spectroscopy:
Determination of the Boltzmann constant
Abstract
We report on a new optical implementation of primary gas thermometry based on laser absorption spectrometry in the near infrared. The method consists in retrieving the Doppler broadening from highly accurate observations of the line shape of the R(12) transition in CO2 gas at thermodynamic equilibrium. Doppler width measurements as a function of gas temperature, ranging between the triple point of water and the gallium melting point, allowed for a spectroscopic determination of the Boltzmann constant with a relative accuracy of 1.610-4.
pacs:
06.20.Jr, 33.20.-t, 42.62.FiAtomic and molecular spectroscopy have played a major role in fundamental metrology since the advent of highly monochromatic, tunable laser sources. Spectroscopic experiments with a metrological goal mostly consist in precision measurements of absolute frequencies, such as the center frequency of the hydrogen 1s-2s line Niering et al. (2000); Schwob et al. (1999) and the strontium intercombination line Boyd et al. (2007), just to mention a few significant examples.
Recently, high resolution laser absorption spectroscopy has been proposed for a direct determination of the Boltzmann constant Bordé (2005). In this case, a frequency interval has to be measured very accurately. In fact, the method relies on a determination of the line width of a Doppler-broadened absorption profile for an atomic or molecular line in a rarefied gas at thermodynamic equilibrium. The current value of , 1.3806504 (24) 10-23 JK-1, recommended by the Committee on Data for Science and Technology (CODATA) cod , comes from the ratio between the molar gas constant and the Avogadro number Mohr and Taylor (2005). Its relative uncertainty, 1.7 10-6, is mostly due to the uncertainty on , whose accepted value is essentially given by that obtained in 1988 by Moldover et al. Moldover et al. (1988) through a fascinating experiment based on acoustic gas thermometry in argon. There is presently a strong interest in new and more direct determinations of in view of a possible new definition of the unit kelvin Fellmuth et al. (2006). In the current International System of Units (SI), the unit kelvin is linked to an artefact, which is far from being invariant in space and time. As already done for the unit metre by fixing the speed of light , the unit kelvin could be redefined through the thermal energy by fixing the Boltzmann constant. This new approach would make the definition more general and independent of any material substance, technique of implementation, and temperature. Nonetheless, before fixing its value, must be determined with an improved uncertainty, possibly using different methods. Presently, the most accurate methods to measure are based on acoustic gas thermometry, exploiting the relation between the speed of sound in a gas and the thermodynamic temperature, and on dielectric constant gas thermometry, based on the virial expansion of the Clausius-Mossotti equation and applicable only to helium, for which QED provides the static electric dipole polarizability Cencek et al. (2001). Nonetheless, the experimental investigation of new primary thermometric methods, based on radically different principles, is strongly encouraged by the Consultative Committee for Thermometry of the International Committee for Weights and Measures, as reported in its Recommendation T 2 of 2005.
Doppler-broadened laser absorption spectroscopy can be implemented in such a way as to act as a primary thermometric method, with the advantage of being conceptually simple, applicable to any gas at any temperature, in whatever spectral region. In contrast to other methods also based on electromagnetic radiation measurements, such as total radiation thermometry Martin and Haycocks (1998), this new approach does not require absolute radiation determinations. It is well known that the Doppler width, (FWHM), of a line (with a center frequency ) in an absorbing molecular gas at thermodynamic equilibrium depends on the temperature through the equation:
| (1) |
where is the mass of the molecule.
The first spectroscopic determination of has been recently performed in the mid-infrared by the Daussy et al. on the asQ(6,3) rovibrational line of the ammonia molecule 14NH3 at a frequency of 28 953 694 MHz Daussy et al. (2007). The absorption profile was observed with a maximum signal-to-noise ratio (S/N) of 103, in the pressure range between 1 and 10 Pa, at a temperature of 273.15 K, using a CO2 laser frequency stabilized on a OsO4 line. Under these low-pressure conditions, which are close to the Doppler limit, by measuring the width of the absorption line as a function of the pressure and extrapolating to zero pressure, it was possible to deduce the Doppler width, which yielded an evaluation of the Boltzmann constant with a relative uncertainty of 1.910-4 Daussy et al. (2007). This approach allows for a very simple spectral analysis but requires an accurate determination of the absolute pressures.
Here we report on a radically different implementation of laser absorption spectroscopy for primary gas thermometry. In particular, we demonstrate that it is possible to retrieve the gas temperature from a molecular absorption profile even when the gas pressure is sufficiently high that the line shape is far from the Doppler limit, but sufficiently small that one can neglect the averaging effect of velocity-changing collisions, so that the line shape is given by the exponential of a Voigt convolution. We perform absorption spectroscopy in the near-infrared on a CO2 gas sample at thermodynamic equilibrium using a distributed feed-back (DFB) diode laser, probing the R(12) component of the combination band. In contrast to the NH3 molecule, our molecular target does not exhibit any hyperfine structure.
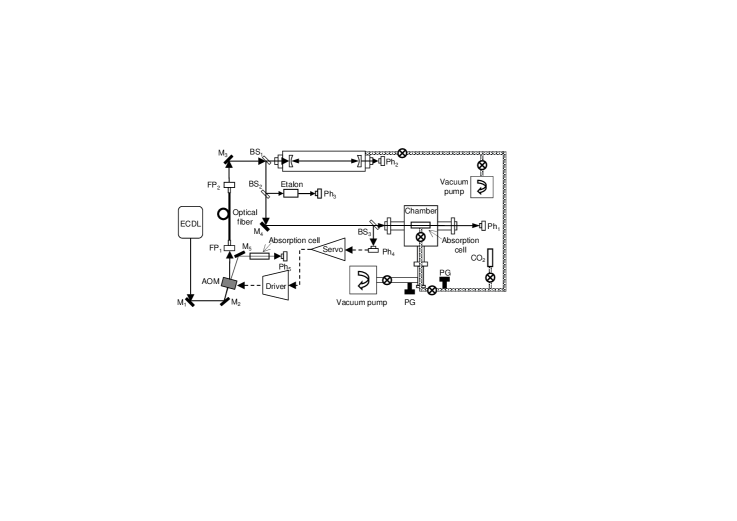
The experimental setup is depicted in Fig. 1. The diode laser, emitting on a single mode at 2.006 m with a maximum power of 3 mW, is mounted in a mirror extended-cavity configuration. In this scheme, a partially reflecting mirror, with a 50% reflection coating on one side and an antireflection (AR) coating on the other, provides the optical feedback for line narrowing down to 1 MHz. As will be shown later on, this is sufficient for the aim of the present experiment. Collimated by a double-aspheric lens, the laser beam first passes through an acousto-optic modulator (AOM) and then is injected into a single-mode, polarization-maintaining optical fiber. The latter is employed as a high-quality spatial filter to produce an optimum TEM00 transverse mode. The AOM is used as an actuator within a servo loop in order to keep the intensity of the laser beam constant over a laser frequency scan as wide as 1 wavenumber. Driven by a 1 W radiofrequency signal at 80 MHz, the AOM deflects about 70% of the laser power from the primary beam to the first diffracted order, which is used for the experiment. The intensity control feedback loop ensures a stability level better than 10-4 (measured value over a laser frequency span of about 0.5 cm-1). The servo loop is active within an electronic bandwidth of 50 kHz. After being collimated again, the laser beam is divided into four parts by a series of beam splitters. The first beam is sent to a high-finesse, confocal optical resonator that provides accurate frequency markers for calibration purposes. The second goes to a 5 cm tick germanium etalon, which allows for a coarse check of the frequency calibration. The third beam impinges on a monitor photodiode, whose output signal is used as the input signal to our servo to control the rf power driving the AOM. Finally, the remaining portion of the laser beam passes through a homemade, temperature-stabilized sample cell, closed at each end by an AR-coated BK7 window. Temperature-stabilized, extended-wavelength, InGaAs photodetectors are employed to monitor the laser radiation. The optical resonator consists of a pair of identical, high-quality, dielectric mirrors, with a radius of curvature of 50 cm and a reflectivity of 99.5%. The mirror mounts, tightly locked over a stainless steel base, fit into the two ends of a glass tube, which is periodically evacuated. The absorption cell is 10.5 cm long and is housed inside a stainless steel vacuum chamber, which is equipped with a pair of optical windows of the same type as those of the cell. Consisting of a cylindrical cavity inside an aluminium block, with inner and external surfaces carefully polished, the cell is temperature stabilized by means of four Peltier elements. Three precision platinum resistance thermometers (Pt100) measure the temperature of the cell’s body while a proportional integral derivative controller is used to keep the temperature uniform along the cell and constant within 40 mK, over a time interval of 2 hours. This active system also allows us to vary the gas temperature between 270 and 330 K.
The Pt100 thermometers were calibrated at the triple point of water and at the gallium melting point with an overall accuracy better than 0.01 K. Both during the calibration and when placed in the absorption cell, the thermometers are fed by a 1 mA current. The correction due to the self heating effect has been applied together with the associated uncertainty.
The sample cell is filled with CO2 gas (with a nominal purity of 99.999%) at a pressure between 70 and 130 Pa, measured using a 1300 Pa full-scale capacitance gauge with a 0.25% accuracy. A turbomolecular pump is used to periodically evacuate the sample cell and create high-purity conditions. Data acquisition is performed by means of a digital oscilloscope (Tektronix TDS7104), with a 13-bit vertical resolution (on the voltage range covered by the absorption profile) and a total number of points for each spectrum equal to 5000. Spectral averaging over 25 consecutive scans is performed, the scan rate being 5 Hz. The resulting spectrum is then transferred to a personal computer. Simultaneously, the transmissions from both the optical resonator and the etalon are recorded.

An example spectrum is shown in Fig. 2. The observed S/N was 1600:1, with an equivalent noise detection bandwidth of 600 Hz and a power incident upon the cell of 50 W. A MATLAB code is used to carry out the line shape fitting and retrieve the Doppler width in a fully automated way for any set of repeated acquisitions. Particular attention is paid to the frequency calibration of the spectra. In fact, prior to each fit, the same code analyzes the transmission spectrum from the confocal resonator in order to construct a linear frequency scale that has to be matched to the corresponding absorption spectrum. This is done by means of a cubic spline interpolation of the peak frequencies versus their index in the data array. Obviously, an accurate determination of the cavity free-spectral-range, , is also necessary. For that purpose, two different methods were implemented, whose results were in total agreement. The first one was based on the simultaneous detection of absorption on both the zero- and first-order beams as provided by the AOM, once the former was sent to a second absorption cell (see Fig. 1). The two cells were filled with CO2 gas at the same pressure and at room temperature. Because of the frequency shift between the two beams (80517.420.12 kHz, as measured by a universal counter), the center frequencies of the two line profiles, simultaneously recorded along with the transmission comb from the optical cavity, are separated by an exactly known quantity. The second method consisted in making a broad laser frequency scan (0.5 cm-1) in order to observe a pair of CO2 absorption lines, namely the R(8) and R(27) transitions, whose center frequencies are accurately known. These frequencies, as well as that of the R(12) line, were taken from Ref. Miller and Brown, 2004. Thus, as a result of a weighted mean between the two values, was found to be 149.560.01 MHz. In our operation conditions, the effects of temperature variations and changes in the cavity alignment on could be neglected. As it will be shown later on, the relative uncertainty on the cavity free-spectral-range, multiplied by a factor of 2, will contribute to the overall accuracy of the spectroscopic determination of . The linearity of the frequency scale was periodically checked using the transmission spectra from the germanium etalon. Deviations from linearity, which could affect the symmetry of the absorption profiles, were found to be negligible at the present experimental accuracy. Coming back to the fit of the absorption line shape, the normalized Voigt function was computed using the approximation of Weideman Weideman (1994). It was confirmed that this approximation is equal to the Voigt convolution, as tabulated in Ref. Abramowitz and Stegun, 1972, to better than 1 part in 106. The nonlinear least-squares fitting code was based on a Levenberg-Marquardt algorithm. The code was tested on simulated spectra, assuming a gas pressure of 130 Pa at a temperature of 296 K, and adding a random noise to the computed line shape. As one could expect, the relative accuracy in the retrieval of the Doppler width strongly depends on the signal-to-noise ratio. In fact, relative deviations between the real value and the retrieved one of 2.610-5 and 5.210-6 (mean values over 10 simulations) were found for S/N=1600 and 1.6104, respectively.

The exponential of a Voigt function is able to fit our measured spectra within the experimental noise, as shown in Fig. 2. Reported in the bottom part of the figure, the residuals evidence that the noise is dominated by periodic fluctuations due to spurious etalon effects, whose root-mean-square value is of the order 10-5 V. Owing to our intensity stabilization procedure, the background signal for the Voigt fit could be optimally reproduced by simply adding a flat baseline to the line shape function. Apart from the Doppler line width, the remaining free parameters were the line center frequency, the homogeneous width and an amplitude factor, the latter representing the product of the line strength factor, the gas pressure and the absorption path length. In our experimental configuration, saturation and transit time broadening could be neglected. It is worth noting that the scan goes quite far into the line wings, as demonstrated a posteriori by the area under the normalized fitting function, which was found to be larger than 0.99.
In Fig. 3, an example of spectroscopic determinations of the gas temperature, over a time interval of 4 minutes, is reported. The histogram, on the right side of Fig. 3, essentially shows that the distribution is gaussian. Simultaneously to the spectral acquisitions, the Pt100 temperatures were also recorded, providing a mean value of 298.68 K, with a standard deviation of 10 mK. With very few exceptions, a good agreement was found between the spectroscopic and Pt100 temperatures, typical deviations being much smaller than 1 K.

Doppler width determinations were repeated as a function of the gas temperature, in the range between the triple point of water and the gallium melting point. This approach was mainly adopted to cancel out possible systematic errors arising from residual etalon effects due to the cell’s windows. In Fig. 4, the experimental values of the quantity and the corresponding temperatures, as provided by the Pt100 thermometers, are plotted. The molecular mass was calculated from the relative atomic masses of 16O and 12C, the molar mass constant, and the Avogadro number Mohr and Taylor (2005). A linear fit of these data directly provides the spectroscopic value for the Boltzmann constant, namely JK-1. The relative uncertainty in the temperature values, also including the short-term fluctuations, were found to be a factor of 10 smaller compared to the relative error of a typical spectroscopic determination of the temperature itself. For this reason, there errors were ignored in the linear fit. The 1- uncertainty on includes the statistical error on the slope of the best-fit line as well as the uncertainty on the frequency scale. Our determination agrees with the CODATA value.
In conclusion, we have demonstrated that highly accurate, intensity-stabilized, laser absorption spectrometry in the near-infrared represents an extremely powerful tool for primary gas thermometry. Our experiment allowed us to provide a spectroscopic measurement of the Boltzmann constant, with a relative accuracy of 1.610-4. The absorption features of our molecular target around 2-m were found to be a very good choice mainly because of the insensitivity of the Doppler width to the gas pressure. More precisely, for CO2 pressures below a few hundred Pa, we did not observe any influence from Dicke narrowing or speed-dependent effects. This is true at the present precision level. Once, in the near future, we will be able to retrieve the Doppler width with a much smaller uncertainty, it will be necessary to confirm its behavior as a function of the gas pressure.
Future developments include the use of a pair of phase-locked extended-cavity diode lasers to improve our capability of measuring laser frequency variations, as well as the implementation of a new detection method based on fast amplitude modulation of the laser beam and phase-sensitive detection to enhance the signal-to-noise ratio. We are also building a new temperature-stabilized cell, which should ensure a constant and homogeneous gas temperature within 1 mK. After these significant improvements, our method could contribute to the new definition of the kelvin, in the near future. In fact, we will no longer be limited by the accuracy of the frequency scale. On the other hand, the S/N is expected to increase by a factor of 25, provided that spurious etalon effects are eliminated. We also plan to exploit the excellent linearity of standard InGaAs detectors by shifting the operation wavelength down to 1.4 m. According to our simulations, it should be possible to reach an accuracy level of a few parts in 106.
Acknowledgements.
This work is supported by the Italian Ministry for University and Research, under the framework program PRIN 2006. The authors would like to thank Massimo Inguscio for a critical reading of the manuscript and Guglielmo Tino for seminal discussion.References
- Niering et al. (2000) M. Niering et al., Phys. Rev. Lett. 84, 5496 (2000).
- Schwob et al. (1999) C. Schwob et al., Phys. Rev. Lett. 82, 4960 (1999).
- Boyd et al. (2007) M. M. Boyd et al., Phys. Rev. Lett. 98, 083002 (2007).
- Bordé (2005) C. Bordé, Phil. Trans. R. Soc. A 363, 2177 (2005).
- (5) eprint The recommended value of can be found on http://physics.nist.gov/constants.
- Mohr and Taylor (2005) P. Mohr and B. Taylor, Rev. Mod. Phys. 77, 1 (2005).
- Moldover et al. (1988) M. R. Moldover, J. P. M. Trusler, T. J. Edwards, J. B. Mehl, and R. S. Davis, Phys. Rev. Lett. 60, 249 (1988).
- Fellmuth et al. (2006) B. Fellmuth et al., Meas. Sci. Technol. 17, R145 (2006).
- Cencek et al. (2001) W. Cencek, K. Szalewicz, and B. Jeziorski, Phys. Rev. Lett. 86, 5675 (2001).
- Martin and Haycocks (1998) J. Martin and P. Haycocks, Metrologia 35, 229 (1998).
- Daussy et al. (2007) C. Daussy et al., Phys. Rev. Lett. 98, 250801 (2007).
- Miller and Brown (2004) C. Miller and L. Brown, J. Mol. Spectrosc. 228, 329 (2004).
- Weideman (1994) J. Weideman, SIAM J. Numer. Anal. 31, 1497 (1994).
- Abramowitz and Stegun (1972) M. Abramowitz and A. Stegun, Handbook of mathematical functions (Dover, New York, 1972).