Simultaneous suppression of ferromagnetism and superconductivity in UCoGe by Si substitution
Abstract
We investigate the effect of substituting Si for Ge in the ferromagnetic superconductor UCoGe. Dc-magnetization, ac-susceptibility and electrical resistivity measurements on polycrystalline UCoGe1-xSix samples show that ferromagnetic order and superconductivity are progressively depressed with increasing Si content and simultaneously vanish at a critical concentration . The non-Fermi liquid temperature variation in the electrical resistivity near and the smooth depression of the ordered moment point to a continuous ferromagnetic quantum phase transition. Superconductivity is confined to the ferromagnetic phase, which provides further evidence for magnetically mediated superconductivity.
pacs:
74.70.Tx, 74.62.Dh,75.30.KzRecently, it was discovered Huy-PRL-2007 that the intermetallic compound UCoGe belongs to the small group of ferromagnetic superconductors (FMSCs): superconductivity with a transition temperature K coexists with weak itinerant FM order with a Curie temperature K. Ferromagnetic superconductors attract much interest, because in the standard BCS scenario superconductivity (SC) and ferromagnetism (FM) are incompatible Berk-PRL-1966 . This is due to the strong de-pairing effect of the ferromagnetic exchange interaction, which thwarts phonon mediated formation of singlet Cooper pairs. However, an alternative route is offered by spin fluctuation models Fay-PRB-1980 ; Lonzarich-CUP-1997 , in which critical magnetic fluctuations associated with a ferromagnetic quantum critical point (FM QCP) mediate SC by pairing the electrons in triplet states. The FMSCs discovered so far are UGe2 Saxena-Nature-2000 (under pressure), UIr Akazawa-JPCM-2004 (under pressure), URhGe Aoki-Nature-2001 and UCoGe Huy-PRL-2007 . The latter two compounds offer the advantage that SC occurs at ambient pressure, which facilitates the use of a wide range of experimental techniques to probe magnetically mediated SC.
UCoGe crystallizes Lloret-PhDthesis-1988 ; Canepa-JALCOM-1996 in the orthorhombic TiNiSi structure (space group ). Evidence for the proximity to a FM QCP has been extracted from magnetization and specific heat measurements Huy-PRL-2007 on polycrystalline samples. The low K and the small value of the ordered moment = 0.03 reveal magnetism is weak. Itinerant magnetism is corroborated by the small value of the magnetic entropy Huy-PRL-2007 (0.3 % of ln2) associated with the magnetic transition. More recently, the magnetic and SC properties were determined for a single-crystalline sample Huy-arXiv-2008 . Magnetization data reveal UCoGe is a uniaxial ferromagnet with the ordered moment = 0.07 pointing along the axis. The electrical resistivity measured for a current shows SC below 0.6 K and a sharp kink signaling the Curie temperature K. The temperature variation of the resistivity Huy-arXiv-2008 ; Huy-tobepublished is characteristic Moriya-Spinger-1985 for a weak itinerant FM near a critical point, i.e. a Fermi liquid dependence below and scattering at critical FM fluctuations there above.
In the generic pressure-temperature phase diagram for FMSCs Fay-PRB-1980 ; Lonzarich-CUP-1997 ; Kirkpatrick-PRL-2001 ; Monthoux-Nature-2007 the superconducting phase (the dome) is confined to the magnetic phase and and vanish at the same critical pressure. Such a phase diagram has been reported for UGe2 Saxena-Nature-2000 and UIr Akazawa-JPCM-2004 under pressure. In the case of UCoGe Huy-PRL-2007 , the analysis of the thermal expansion and specific heat data, using the Ehrenfest relation, shows that decreases with pressure, whereas increases. This places UCoGe on the far side of the superconducting dome with respect to the magnetic quantum critical point. Concurrently, under hydrostatic mechanical pressure is predicted to go through a maximum, before vanishing at the critical point. In this work we use an alternative route to study the evolution of FM and SC, namely chemical pressure exerted by replacing Ge by isoelectronic Si. Ferromagnetic UCoGe and paramagnetic Troc-JMMM-1988 UCoSi are isostructural Lloret-PhDthesis-1988 ; Canepa-JALCOM-1996 . The unit cell volume of UCoSi is smaller than the one of UCoGe, so chemical pressure is relatively weak. By means of magnetic and transport measurements we find that FM order and SC are gradually depressed and vanish simultaneously at a critical concentration . SC is confined to the FM phase in agreement with the generic phase diagram. This yields further support for magnetically mediated superconductivity.
A series of polycrystalline UCoGe1-xSix samples were prepared with and . The constituents (natural U 3N, Co 4N, Ge 5N and Si 5N) were weighed according to the nominal composition U1.02Co1.02Ge1-xSix and arc melted together under a high-purity argon atmosphere in a water-cooled copper crucible. The as-cast samples were annealed for ten days at 875 ∘C. Samples were cut by spark erosion in a bar-shape for transport and magnetic measurements. The phase homogeneity of the annealed samples was investigated by Electron Probe Micro Analysis (EPMA). The matrix had the 1:1:1 composition and all samples contained a small amount (2%) of impurity phases. The EPMA technique did however not allow for a precise determination of the Ge and Si ratio, and in the following is the nominal concentration. Powder X-ray diffraction patterns at K for and confirmed the TiNiSi structure. The measured lattice constants are Å, Å and Å for UCoGe and Å, Å and Å for UCoSi, in good agreement with literature Lloret-PhDthesis-1988 ; Canepa-JALCOM-1996 . The unit cell volume decreases linearly from 209.5 Å3 () to 202.1 Å3 (), with the main contraction along the and axis.
The dc-magnetization, , was measured in a SQUID magnetometer in magnetic fields up to 5 T and temperatures down to 2 K. The low-field ( T) ac-susceptibility, , was measured using a mutual inductance coil and a phase-sensitive bridge in a 3He system with base temperature 0.23 K or in a dilution refrigerator with base temperature 0.02 K. Electrical resistivity data, , were taken using a low-frequency ac-bridge in a four-point configuration in the same temperature range.
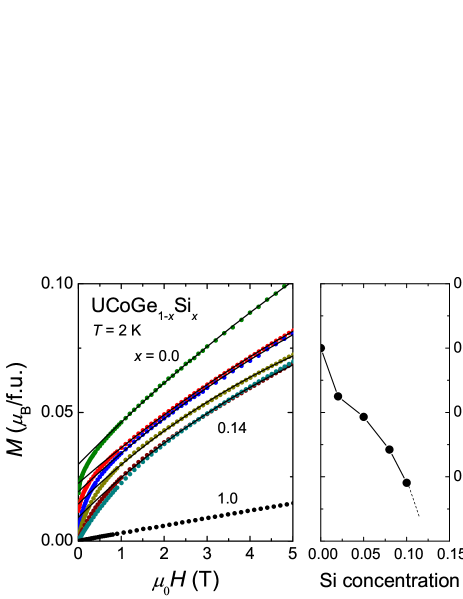
The dc-magnetic susceptibility of the UCoGe1-xSix alloys was measured in an applied field of 1 T in the temperature range K. The effect of doping small amounts of Si on is weak. For all the data for K are described by a modified Curie-Weiss law, with a temperature independent susceptibility m3/mol and an effective moment f.u.. On the contrary, the effect of doping on the FM transition is large. Measurements of the dc-magnetization in a small field ( T) show that upon Si doping the FM transition is rapidly suppressed to below the low temperature limit of our dc-magnetometer (2 K). For 0.00 and 0.02 we find = 3.0 K and 2.5 K, respectively. In Fig. 1 we show the field dependence of the magnetization measured at K. The gradual increase of observed for T is related to the itinerant nature of the magnetic state. The spontaneous magnetization rapidly drops with increasing Si content. For the ordered compounds an estimate of can be made by fitting the data to the empirical expression
| (1) |
where the parameter probes the magnetic interaction strength of the fluctuating moments. In the high-field limit . Eq. 1 describes the experimental data well for T (solid lines in Fig. 1). The intercepts of the fits with the vertical axis yield the fit parameters in the limit . The deviations for T are due to the finite temperature at which the data are taken (the ordered moment is not fully developed yet). For () in agreement with previous results Huy-PRL-2007 , while for . For the samples with 0.05, 0.08 and 0.10 the data have been taken at . Nevertheless, a rough estimate of can be obtained, as the magnetic transition shows a large temperature broadening in applied fields T. The resulting values of are traced in the right panel of Fig. 1. We conclude smoothly goes to zero in the concentration range .
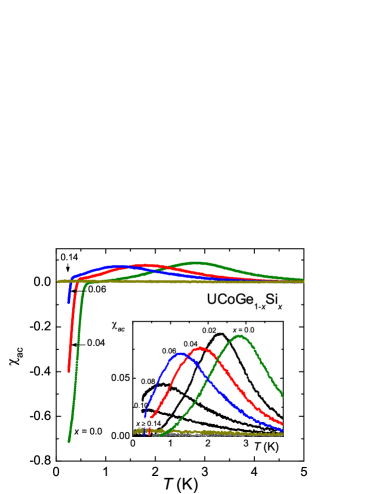
The suppression of was studied in more detail by the ac-susceptibility technique. The data, taken down to 0.23 K () and down to 0.02 K (), are shown in Fig.2. The maximum in locates the Curie temperature, which equals 2.8 K and 2.3 K, for 0.00 and 0.02 respectively. These values compare well with those extracted from the dc-magnetization. With increasing Si content the transition becomes weaker, broadens (see inset in Fig. 2) and for a maximum in no longer can be identified. This confirms magnetism vanishes in the concentration range . The large diamagnetic signal measured for 0.00 Huy-PRL-2007 , 0.04 and 0.06 down to 0.23 K signals bulk SC. SC is progressively depressed and is no longer observed for (at least down to 0.02 K).
The electrical resistivity was measured in the temperature interval K for and in the range K for . For the residual resistivity cm. Upon alloying increases linearly at least up to at the fast rate of 12 cm per at.% Si. This shows all Si substitutes for Ge. Concurrently, the residual resistance ratio KK, which amounts to 27 for , drops to for . For , however, the levels off at a value . The strong doping sensitivity of is possibly related to an enhanced site inversion Ge,Si Co. Notice the TiNiSi structure is an ordered variant of the CeCu2 structure Sechovsky-handbook-1998 (for U compounds crystallizing in the latter structure the transition metal atoms and group IV atoms are randomly distributed over the Cu sites).

The FM transition appears as a broad hump in for pure UCoGe Huy-PRL-2007 . Upon alloying, the hump shifts to lower temperatures at the same rate as the maximum in . In Fig. 3 we show the low-temperature part of the resistivity data in a plot of versus . Here is determined by fitting for . For each the best value of was obtained by fitting over a larger and larger temperature range, while keeping constant and the error small. In the magnetic phase () the exponent shows a quasi-linear decrease from for to the non-Fermi-liquid value for (see Fig. 3). Close to the critical point the temperature range for the fit becomes very small and the values of should be interpreted with care. Nevertheless, the decreasing trend is evident. For the Fermi liquid value is recovered. The SC transition is depressed with increasing Si content and no SC has been observed down to 0.02 K for .
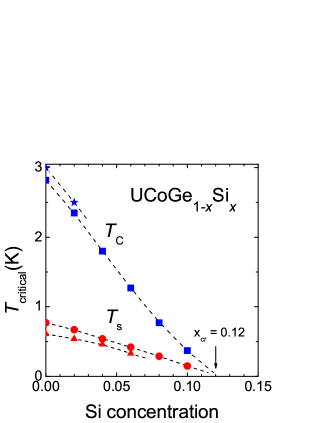
Having determined the evolution of the FM and SC phases in the UCoGe1-xSix alloys by magnetic and transport measurements, we construct the phase diagram shown in Fig. 4. is depressed quasi-linearly, at least till , at a rate K/at.%Si. By extrapolating we arrive at a critical Si concentration for the suppression of FM order . For a tail appears, and the data extrapolate to . , determined resistively by the midpoint of the transition, is depressed somewhat faster than linear, initially at a rate K/at.%Si. By smoothly extrapolating we obtain a critical Si concentration for the suppression of SC . The values measured by for , signal the onset of bulk Huy-PRL-2007 SC and follow the same trend. Notice bulk extrapolates to a slightly lower , i.e. close to the value obtained by the linear extrapolation of .
In order to compare the effect of chemical and hydrostatic pressure we calculate from the difference in unit cell volume of UCoGe and UCoSi that 1 at.% Si is equivalent to 0.35 kbar (here we assume the isothermal compressibility Pa-1). Concurrently, the measured doping-induced depression of (Fig. 4) translates to K/kbar, which is about a factor three larger than the value K/kbar calculated Huy-PRL-2007 via the Ehrenfest relation. This indicates Si does not merely exert chemical pressure. Indeed hybridization phenomena in U alloys are in general strongly anisotropic Sechovsky-handbook-1998 . As regards the SC transition, Si doping obviously has a different effect than hydrostatic pressure. The measured doping-induced depression of (Fig. 4) translates to K/kbar, while the Ehrenfest relation shows increases at a rate K/kbar Correction_Ts-p .
The suppression of magnetic order in the UCoGe1-xSix alloys can be understood in terms of a simple Doniach picture Doniach-PhysicaB-1977 : by doping the smaller Si atoms the hybridization strength increases, which leads to a loss of magnetism. The rapid suppression of FM order provides further evidence that UCoGe is close to a FM QCP. This is corroborated by the steady decrease of the non-Fermi liquid exponent of the resistivity measured in the FM phase (see Fig. 3). The itinerant nature of the FM state suggests that the critical point is of the Moriya-Hertz-Millis Hertz-PRB-1976 ; Moriya-Spinger-1985 ; Millis-PRB-1993 type. The extracted exponent near is much smaller than the value predicted for a clean FM QCP. A similar observation was made for the doping-induced FM QCP in URh1-xRuxGe alloys Huy-PRB-2007 : at . Clearly, disorder reduces Pfleiderer-Nature-2001 . The smooth depression of indicates the ferro-to-paramagnetic transition at is a continuous phase transition. Additional experiments, e.g. specific heat, are required to put the evidence for a FM QCP at on firm footing.
The magnetic and SC phase diagram (Fig. 4) presents compelling evidence that superconductivity is confined to the FM phase. Moreover, by smoothly extrapolating and we arrive at a most important conclusion, namely . This shows that FM order and SC are closely tied together. The simultaneous suppression of FM order and SC yields strong support for triplet SC mediated by FM spin fluctuations Fay-PRB-1980 ; Lonzarich-CUP-1997 ; Kirkpatrick-PRL-2001 ; Monthoux-Nature-2007 . Evidence for triplet SC is furnished by the absence of Pauli limiting in the upper critical field Huy-arXiv-2008 . Moreover, the observed anisotropy in provides evidence for an axial SC gap with nodes along the direction of the ordered moment, as calculated Mineev-PRB-2004 for the phase of an orthorhombic FMSC. On the other hand, it is recognized Foulkes-PRB-1977 ; Fay-PRB-1980 that triplet SC is extremely sensitive to scattering at non-magnetic impurities and defects. Therefore, it is surprising that SC survives till doping concentrations of 12 at.% Si. For our polycrystalline UCoGe samples, with , we calculate Huy-PRL-2007 an electron mean free path, Å, in excess of the SC coherence length Å, a necessary condition for unconventional SC. Upon replacing Ge by Si the residual resistance increases, leading to a corresponding decrease of . Unconventional SC therefore would require a strong doping-induced reduction of as well. The depression of non- wave SC by non-magnetic impurities can be modelled using a generalized form Hirschfeld-PRB-1988 ; Millis-PRB-1988 of the Abrikosov-Gor’kov pair-breaking theory. A recent example is provided by the defect-driven depression of -wave SC in the paramagnet Sr2RuO4 Mackenzie-PRL-1998 . In the case of the UCoGe1-xSix alloys, however, the defect-driven depression of is partly compensated by increasing due to chemical pressure. Also, one may speculate that upon the approach of the FM QCP, FM fluctuations stimulate triplet SC even stronger. Obviously, more experiments are needed to unravel the different pairing and de-pairing contributions to .
In summary, magnetic and transport measurements on a series of polycrystalline UCoGe1-xSix samples show that ferromagnetic order and superconductivity are both depressed and vanish at the same critical concentration . The non-Fermi liquid exponent in the resistivity near and the smooth depression of the ordered moment point to a continuous FM quantum phase transition. Superconductivity is confined to the ferromagnetic phase, which provides further evidence for magnetically mediated superconductivity. These results offer a unique route to investigate the emergence of superconductivity near a FM QCP at ambient pressure.
This work was part of the research program of FOM (Dutch Foundation for Fundamental Research of Matter) and COST Action P16 ECOM.
References
- (1) N. T. Huy, A. Gasparini, D. E. de Nijs, Y. Huang, J. C. P. Klaasse, T. Gortenmulder, A. de Visser, A. Hamann, T. Görlach, and H. v. Löhneysen, Phys. Rev. Lett. 99, 067006 (2007).
- (2) N. F. Berk and J. R. Schrieffer, Phys. Rev. Lett. 17, 433 (1966).
- (3) D. Fay and J. Appel, Phys. Rev. B 22, 3173 (1980).
- (4) G. G. Lonzarich, in Electron: A Centenary Volume, ed. M. Springford (Cambridge Univ. Press, Cambridge, 1997), Chapter 6.
- (5) S. S. Saxena, K. Ahilan, P. Agarwal, F. M. Grosche, R. K. Haselwimmer, M. Steiner, E. Pugh, I. R. Walker, S. R. Julian, P. Monthoux, G. G. Lonzarich, A. D. Huxley, I. Sheikin, D. Braithwaite, and J. Flouquet, Nature (London) 406, 587 (2000).
- (6) T. Akazawa, H. Hidaka, T. Fujiwara, T. C. Kobayashi, E. Yamamoto, Y. Haga, R. Settai, and Y. Ōnuki, J. Phys.: Condens. Matter 16, L29 (2004).
- (7) D. Aoki, A. D. Huxley, E. Ressouche, D. Braithwaite, J. Flouquet, J. P. Brison, E. Lhotel, and C. Paulsen, Nature (London) 413, 613 (2001).
- (8) B. Lloret, Ph.D. Thesis (University of Bordeaux I, 1988), unpublished.
- (9) F. Canepa, P. Manfrinetti, M. Pani, and A. Palenzona, J. Alloys Comp. 234, 225 (1996).
- (10) N. T. Huy, D. E. de Nijs, Y. K. Huang, and A. de Visser, Phys. Rev. Lett. 100, 077002 (2008).
- (11) N. T. Huy, Ph.D. Thesis (University of Amsterdam, 2008), unpublished.
- (12) T. Moriya, Spin Fluctuations in Itinerant Electron Magnetism (Springer, Berlin, 1985).
- (13) T. R. Kirkpatrick, D. Belitz, T. Vojta, and R. Narayanan, Phys. Rev. Lett. 87, 127003 (2001).
- (14) P. Monthoux, D. Pines and G. G. Lonzarich, Nature (London) 450, 1177 (2007).
- (15) R. Troć and V. H. Tran, J. Magn. Magn. Mat. 73, 389 (1988).
- (16) V. Sechovský and L. Havela, Handbook of Magnetic Materials Vol. 11, ed. K. H. J. Buschow (North Holland, Amsterdam, 1998), pp. 1-289.
- (17) This value corrects the estimate K/kbar given in Ref.1.
- (18) S. Doniach, Physica B 91 231 (1977).
- (19) J. Hertz, Phys. Rev. B 14, 1165 (1976).
- (20) A. J. Millis, Phys. Rev. B 48, 7183 (1993).
- (21) N. T. Huy, A. Gasparini, J. C. P. Klaasse, A. de Visser, S. Sakarya, and N. H. van Dijk, Phys. Rev. B. 75 212405 (2007).
- (22) See e.g. C. Pfleiderer, S. R. Julian, and G. G. Lonzarich, Nature (London) 414, 427 (2001).
- (23) V. P. Mineev and T. Champel, Phys. Rev. B 69, 144521 (2004).
- (24) I. F. Foulkes and B. L. Gyorffy, Phys. Rev. B 15 1395 (1977).
- (25) P. J. Hirschfeld, P. Wölfle, and D. Einzel, Phys. Rev. B 37 83 (1988).
- (26) A. J. Millis, S. Sachdev, and C. M. Varma, Phys. Rev. B 37, 4975 (1988).
- (27) A. P. Mackenzie, R. K. W. Haselwimmer, A. W. Tyler, G. G. Lonzarich, Y. Mori, S. Nishizaki, and Y. Maeno, Phys. Rev. Lett. 80, 161 (1998).