X-ray Properties of the GigaHertz-Peaked and Compact Steep Spectrum Sources.
Abstract
We present Chandra X-ray Observatory observations of Giga-Hertz Peaked Spectrum (GPS) and Compact Steep Spectrum (CSS) radio sources. The Chandra sample contains 13 quasars and 3 galaxies with measured 2-10 keV X-ray luminosity within erg s-1. We detect all of the sources, five of which are observed in X-ray for the first time. We study the X-ray spectral properties of the sample. The measured absorption columns in the quasars are different than those in the galaxies in the sense that the quasars show no absorption (with limits ) while the galaxies have large absorption columns () consistent with previous findings. The median photon index of the sources with high S/N is and it is larger than the typical index of radio loud quasars. The arcsec resolution of Chandra telescope allows us to investigate X-ray extended emission, and look for diffuse components and X-ray jets. We found X-ray jets in two quasars (PKS 1127-145, B2 0738+32), an X-ray cluster surrounding a CSS quasar (z=1.1, 3C 186), detected a possible binary structure in 0941-080 galaxy and an extended diffuse emission in galaxy PKS B2 1345+12. We discuss our results in the context of X-ray emission processes and radio source evolution. We conclude that the X-ray emission in these sources is most likely unrelated to a relativistic jet, while the sources’ radio-loudness may suggest a high radiative efficiency of the jet power in these sources.
1 Introduction
Powerful radio sources exemplify the most energetic processes in the Universe and demonstrate that an accreting supermassive black hole can influence regions at megaparsec distances away from its immediate sphere of influence. How these sources are triggered and how long they last are subjects of many scientific investigation. In this paper we present X-ray observations of a sample of the most powerful, but compact radio sources. They may represent an early stage of just triggered quasar activity. Giga-Hertz Peaked Spectrum (GPS) and Compact Steep Spectrum (CSS) radio sources typically have compact radio morphology with the radio emission contained within their host galaxy ( kpc, O’Dea 1998). The compact radio structure on miliarcsec scales is similar to the morphology of a large radio source with lobes, hot spots and jets. Because of this similarity and the observed high radio power the GPS sources are thought to be the precursors of large radio galaxies observed at the early stage of their expansion (evolution model, Fanti et al 1995, O’Dea & Baum 1997, O’Dea 1998). Note that an alternative model, where the source is confined by a dense environment (frustrated) has not been completely ruled out (Snellen et al., 2000; Alexander, 2000), although there is no evidence for the medium with the required column density (Morganti, 2007)
If the evolutionary hypothesis is correct the studies of GPS/CSS may impact our understanding of triggering quasars. Measured expansion velocities of double radio structures (Polatidis & Conway, 2003) in several nearby GPS galaxies support the idea of them being young ( years). In addition their radio morphology suggests that the sources are observed at high inclination angles, so the Doppler beaming is not important. Thus the young age of GPS galaxies with the double or symmetric radio morphology has not been questioned and evolution studies often consider only the GPS/CSS galaxies, e.g. the sources where the central AGN engine cannot be directly observed as it is might be buried by a large column of obscuring material (Guainazzi et al., 2006).
Luminous quasars are thought to be powered by high accretion rates and radio loud quasars in addition to strong thermal emission also exhibit relativistic jets carrying large kinetic power. GPS/CSS quasars with a core-jet radio morphology provide a challenge for measuring their age because a truly young GPS/CSS quasar could often be confused with a blazar observed along the jet axes (Lister, 2003; Stanghellini et al., 2005). However, there should also be young sources among blazars. Identifying typical blazars and young quasars within the GPS/CSS quasar samples is not trivial and has been basically avoided. In order to distinguish a blazar from a young radio source one needs to consider the entire broad-band spectrum of each source. This is hard and requires simultaneous observations at many frequencies, as blazars typically vary. A correlated rapid variability across many frequencies including the gamma-ray band may indicate a blazar nature, while a young GPS/CSS source should not vary on the short timescales (less than a few months).
X-ray emission is predicted as a result of the radio source evolution and its expansion into the surrounding interstellar and intergalactic medium (ISM/IGM) (Heinz et al., 1998). A detection of such emission could provide information about temperature and density, e.g. the physical conditions of the expanding radio source.
While there has been an abundance of the radio data collected over the last decade, X-ray observations of GPS/CSS sources have been sporadic. O’Dea (1998) lists 31 GPS sources ((only quasars were detected while 7 galaxies had upper limits) showing quite high X-ray luminosities (Lergs s-1). An intrinsic X-ray absorption was reported by Elvis et al. (1994) in two out of three high redshift GPS quasars suggesting that their environment might be different from that of the other quasars. ROSAT upper limits for a few GPS/CSS galaxies of L ergs s-1 are consistent with the X-ray emission expected from poor clusters or early type galaxies. The first X-ray detection of a GPS galaxy at L ergs s-1 by ASCA was reported by O’Dea et al (2000). Recent XMM-Newton observations of a few GPS galaxies (Guainazzi et al. (2006), Vink et al. (2006)) indicate an intrinsic absorption with an average column of cm-2, and the radio-to-X-ray luminosity ratios comparable to the normal radio galaxies. There is also no compelling evidence for a hot gas in the X-ray spectra of GPS galaxies. These observations support the evolution model in which GPS galaxies are ”young” counterparts for large-scale FRII galaxies (Guainazzi et al., 2006).
The highest spatial resolution X-ray observations before the launch of the Chandra X-ray Observatory (Chandra) were made with the ROSAT HRI in which 2 out of 4 GPS quasars showed traces of an extended emission (Antonelli & Fiore 1997, Siemiginowska et al 2003). The spatial resolution of Chandra enables to detect X-ray structures on arcsec scales with a high dynamic range (Weisskopf et al., 2003). During the first years of the mission we have made a surprising discovery - the two of the GPS quasars have shown hundred kilparsec scale X-ray jets in the Chandra X-ray images (Siemiginowska et al. (2002), Siemiginowska et al. (2003a)). These two quasars have been classified as GPS quasars in radio band with no indication of a large scale emission. However, a careful re-analysis of archival radio data show that there was indeed a large scale radio structure present, but due to a strong quasar core emission only detectable in the high dynamic range radio data.
For this exploratory X-ray study we selected 16 GPS/CSS sources from the sample presented in O’Dea (1998). Our X-ray sample is not complete by any means, but it is so far the largest sample of GPS/CSS sources with the highest quality X-ray data. The main goal of this study is to obtain the X-ray flux and spectra, and to investigate an extended X-ray emission, disentangle diffuse and nuclear components, look for X-ray jets and study absorption properties. We found X-ray jets in two quasars, discovered an X-ray cluster surrounding a redshift z=1 CSS quasar, detected a possible binary structure in one galaxy and an extended diffuse emission in the other. Overall the absorption properties of GPS quasars are different than those of GPS galaxies in the sense that the quasars show no absorption (with limits ) while the galaxies have large absorption columns consistent with the previous findings.
The paper is structured in a following way. We present the X-ray sample in Section 2; in Section 3 we show the X-ray Chandra data and describe the data analysis process; in Section 4 we present the results and Section 5 contains the discussion of the results. We summarize the results in Section 6. Throughout this paper we use the cosmological parameters based on the WMAP measurements (Spergel et al. 2003): H71 km sec-1 Mpc-1, , and .
2 X-ray Sample
Our original Chandra sample of GPS/CSS sources was chosen from the complete sample compiled by O’Dea (1998) that consists of two samples studied by Fanti et al. (1990) and Stanghellini et al. (1998). Fanti et al sample was derived from 3C catalog with the following criteria: (1) flux density larger than Jy at 178 MHz; (2) projected linear size kpc; (3) deg and deg; (4) log power at 178 MHz W Hz-1. The Stanghellini et al. (1998) sample was selected from the complete catalog of radio sources stronger than 1 Jy at 5 GHz compiled by Khur et al.(1981) with the following criteria: (1) a source flux density measured at 5 GHz should be larger than 1 Jy; (2) a radio spectrum has a turn-over at the frequency between 0.4-6 GHz; (3) a spectral index is steep, 0.5 at high frequency end, after the turn-over; (4) a source declination is above and galactic latitude above . The radio spectra for this sample were derived from simultaneous observations to prevent ambiguity from variability. Also, no regard was given to the optical counterpart – quasars and galaxies are both included. This means that the sample can be used to investigate the GPS phenomenon in a range of galaxy environments.
The 11 GPS/CSS sources were selected based on the existing X-ray detections, the size of the radio emission and the low Galactic equivalent Hydrogen column. Four other sources from O’Dea (1998) sample have been already observed by Chandra and we obtained the data from the archive. We also added one more GPS source available in the archive, although it has not been on the O’Dea (1998) list. The main purpose of this study is to investigate the X-ray properties of the GPS/CSS sources and we decided to expand the samples by the archival data.
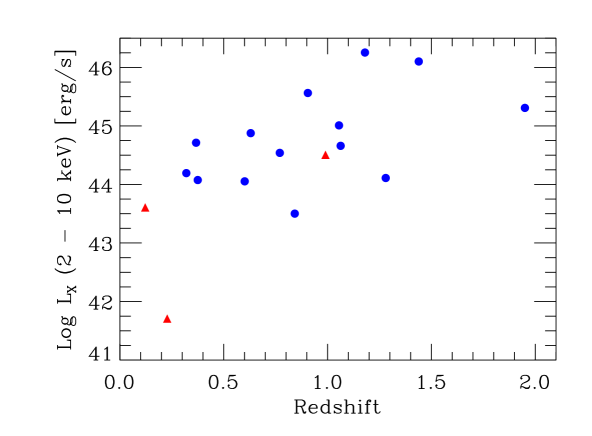
The final Chandra sample presented here contains 3 GPS galaxies and 13 GPS/CSS quasars. The sample is listed in Table 1 with the date of each observation, observation IDs (obsid) and the exposure times. Eleven sources have been previously observed in X-rays. The Chandra, exposure time was estimated assuming a detection of the extended emission 10 times fainter than the core emission. Short 5 ksec exposures were obtained for the 5 sources that have never been observed in X-rays to determine their count rates and X-ray luminosity. The sample spans moderate redshifts (from z=0.228 to z=1.95, Fig. 1) and radio luminosities between L(5GHz)ergs s-1 with one GPS galaxy below L(5GHz)ergs s-1.
3 X-ray Observations and Data Analysis
The Chandra ACIS-S data were collected in two different ways: (1) long exposures ( ksec) to allow detection of a diffuse X-ray emission on arcsec scales; (2) short observations ( ksec) to detect X-ray emission and obtain an X-ray flux for sources with no previous X-ray detections. All observations were performed with the source located 30 arcsec from the default aim-point position on the ACIS-S backside illuminated chip S3 (Proposers’ Observatory Guide, POG111http://cxc.harvard.edu/proposer/POG/index.html). Most data were collected with the 1/8 subarray readout mode of only one CCD to mitigate pileup, however some of the archival data were taken in the full readout mode and are affected by up to pileup.
All 16 sources were detected by Chandra with number of counts between 9 and 14,800.
The X-ray data analysis were performed in CIAO 3.4 with the calibration files from CALDB 3.3 data base. Note that these calibration files account for ACIS-S contamination. Although the pileup fractions are relatively low we include the pileup model specified by Davis (2000) and implemented in Sherpa (Freeman et al., 2001) in our analysis to recover the intrinsic source continuum for a few sources the most affected by pileup (see details below).
3.1 Imaging Analysis
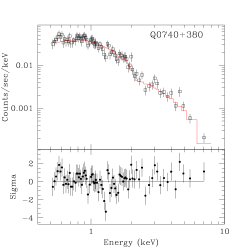
The ACIS-S images were inspected for the presence of an extended X-ray emission. The data show extended components in the vicinity of the X-ray core for 2 sources: a quasar 0740+380 and a galaxy B2 1345+125. We used the CHART simulator to obtain the PSF for these sources and confirmed the presence of the extended component. A detailed analysis and a discussion of the properties of the X-ray cluster emission with a total of 740 counts detected out to 120 kpc from the quasar 0740+380 (z=1.063) have been presented in Siemiginowska et al (2005).
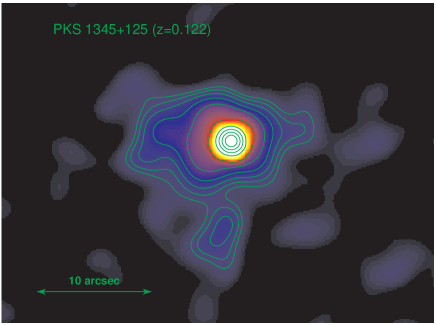
Fig. 2 shows a smoothed ACIS-S image of the galaxy, PKS B2 1345+125 (z=0.122) with the extended emission on the arcsec scale ( kpc). A detailed analysis of this structure is given in Guainazzi et al (in preparation).
3.2 Spectral Analysis
We have used CIAO 3.4 and CALDB 3.3 to analyze all data sets, using the CIAO default tools to extract the spectrum and the associated calibration files (rmf and arf). We used Yaxx222http://cxc.harvard.edu/contrib/yaxx/package to uniformly analyzed and fit the data. The spectra were extracted from circular regions centered on each source. Annuli surrounding the source regions were assumed for the background regions. The total counts detected for each source are listed in Table 1.
We fit an absorbed power law model to the spectral data:
photons cm-2 sec-1 keV-1, where is the normalization at 1 keV, is the photon index of the power law and and are the two components for the absorption. The first absorption component is the effective Galactic absorption characterized by the equivalent neutral Hydrogen column Ngal which we list for each source in Table 1 (COLDEN333http://cxc.harvard.edu/toolkit/colden.jsp). This absorption was constant during fitting. We assume that the second absorption component is intrinsic to the quasar and located at redshift , with N as the equivalent hydrogen column. and are the corresponding absorption cross sections (Morrison & McCammon 1983, Wilms, Allen and McCray 2000). We used Powell optimization and (data variance) statistics (binning the data to contain a minimum of 16 counts in a bin) to determine the best fit parameter values. The modeling results are presented in the Table 2.
The above model was applied to each source to obtain a uniform description of the sample. For sources with a high count rate and high number of counts we also included the effects of pileup in our modeling.
3.2.1 Pileup Analysis
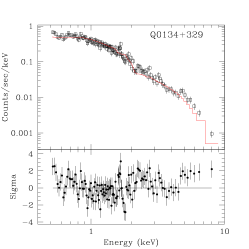
The pileup fractions for the observations were estimated a plot of pileup fraction versus photon/frame in Section 6.14 of the POG2. The photon/frame parameter was calculated by dividing the number of counts by the exposure time and multiplying this ratio by the frame time for each observation. These estimates indicated that pileup was significant in Q0134+329, and Q1416+067.
In order to correctly model pile-up, we removed the ACIS afterglow correction applied in the standard data processing (SDP). This correction, intended to discard cosmic ray events, could also remove as much as 20% of valid source photons.
In Sherpa, an absorption (xsphabs) and power law (pow) model were fit to the data within the 0.3 to 7.0 keV energy range; Q1416+067 also included a redshifted absorption (xszwabs) component since NH, the absorption column was detected in the previous fit for this source. A pileup model (jdpileup) was included in these fits, using the Monte-Powell fitting method.
The results of these fits are shown in Table 1 which displays the spectral index obtained from adding in the pileup component as well as the estimated pileup fraction and the pileup fraction found from running the fit. For each target, the index increased after including the pile-up component in the fit as expected. The pileup fraction calculated through Sherpa was significantly higher than that estimated from the POG for Q0134+329. For the quasars in the sample, the average photon index increased to 1.84 from 1.77 when the pileup model was included (see Fig. 4).
Due to the strong pileup (it modifies the PSF) it is hard to determine whether any extended X-ray emission component is present in these sources.
4 Results
In general the GPS/CSS sources are strong X-ray point sources, however an extended X-ray emission is detected in several cases in a form of large scale jets or a diffuse component. We discuss this aspect of our studies in the next section in more detail.
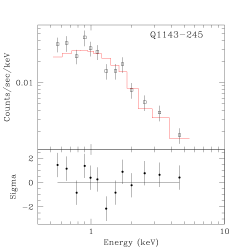
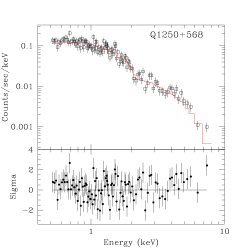
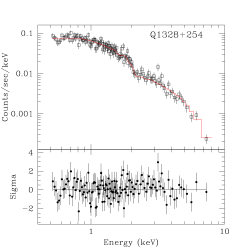
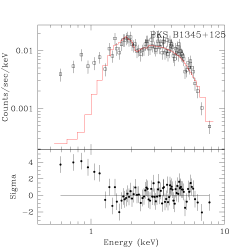
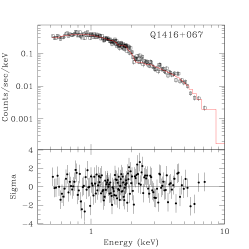
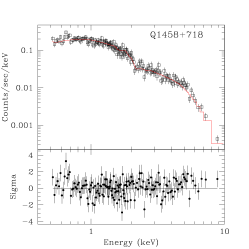
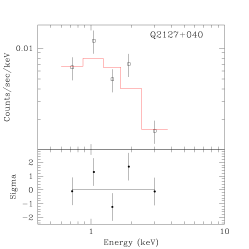
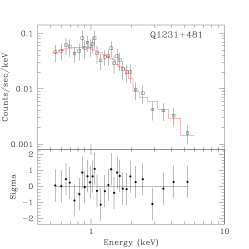
Fig. 3 plots the absorbed power law model fits to the X-ray spectra for each source with the residuals. Table 2 shows best fit values of the absorption column and photon index with 90% errors for one significant parameters. All sources are relatively well described by the power law model. However, the values reflect the scatter observed in the residuals in Fig. 3 and indicate the need for a more complex spectrum than a simple power law model for a few sources. For example PKS B2 1345+125 has a large absorption column (N cm-2) and a soft X-ray excess, Q0134+329 is better described by a two component power law model, while Q0740+380 shows a possible absorption line (but in this case the signal to noise is low in this part of the spectrum and calibration uncertainties are large enough that we cannot claim this line detection).
We applied a two component model to the PKS B2 1345+125 X-ray spectrum, e.g. an absorbed power law and a bremstrahlung emission, to determine the luminosity of the soft X-ray thermal emission. The parameters of this model are the following: the column density of the intrinsic absorber equal to N cm-2, photon index of the absorbed power law (slightly different than in the previous single power law fit), the temperature of the thermal component kT keV and the flux within 0.5-2 keV of 5.3 ergs cm-2 s-1 resulting in the observed luminosity of 9.5 ergs s-1. The unabsorbed flux in 0.5-2 keV energy range from the power law component results in ergs s-1 luminosity which is comparable to a typical quasar luminosity.
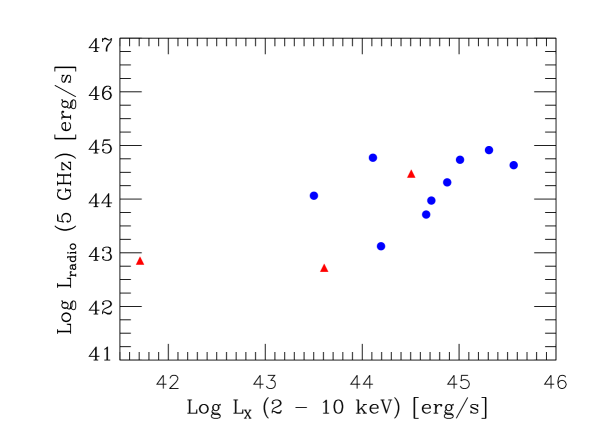
Figure 4 shows the distribution of a power law photon index for the entire sample. The 1 errors are large () for sources with small number of counts, while for the high quality data the errors are small (). An average photon index for the high S/N data is 1.78 and a majority of sources have an index within . This is higher than a typical index of 1.5 for a radio loud quasar (Elvis et al., 1994; Richards et al., 2006). As shown in figure 5 there is no dependence between the photon index and radio-to-X-ray luminosity ratio in this sample.
We studied absorption properties and searched for an additional (above the Galactic column) absorption required by the data intrinsic to the source, so at the fixed redshift of the source. We detected the intrinsic absorption columns cm-2 for three quasars PKS 1127-145, B2 0738+313, Q1416+067 and cm-2 for one galaxy, B2 1345+125. We note that two quasars are known to have Damped Lyman Alpha (DLA) absorption systems (PKS 1127-145, B2 0738+313, Bechtold et al. (2001); Siemiginowska et al. (2003a)) and one has a broad absorption line system (BAL) (Q1416+067 Bechtold et al. (2002)). In general the upper limits for the intrinsic absorption cm-2 indicate low columns in majority of quasars.
We do not detect any trends in absorption with photon index or source luminosity. A comparison with the GPS galaxies (Guainazzi et al., 2006) indicates that the galaxies have larger absorption columns than the GPS quasars. This may be due to a difference in the viewing angle between the quasars and galaxies, so the galaxies are observed along the direction of an obscurer, e.g. “torus”.
5 Discussion.
5.1 X-rays from Unresolved Core
A typical radio size of the GPS/CSS source is relatively small in comparison to the resolution of Chandra X-ray images. This means that the X-ray emission measured in a standard source extraction region (radius = 1.75 arcsec) contains the entire complex radio structure of the GPS radio source (e.g. jets, hot spots, core) and we cannot resolve the individual radio components in X-rays. This observational fact complicates any theoretical interpretation for the origin of the X-ray emission. A contribution to the observed X-ray spectrum can come not only from the central quasar power engine but also from unresolved jets, hot spots or thermal gas heated by an expanding radio source.
The X-ray emission could originate in an accretion flow onto a supermassive black hole and be associated with a hot ionized medium, e.g. corona, hot wind, jet, hot innermost flow (Sobolewska et al., 2004a, b). It can also be a result of the reflection of the primary emission off the cold (105 K) disk flow (e.g. Ross & Fabian (1993)). However, in radio-loud sources the jet emission often dominates over these accretion components. In fact the radio to gamma-rays emission is entirely dominated by the jet emission in blazars’ which are observed along the jet axes (Sikora et al., 1997). Some of the GPS sources might be indeed observed along the jet axis and have a significant X-ray emission due to the relativistic jet particles.
If, for example, a relativistic jet is propagating within a strong IR photon field the IR photons upscattered by the jet electrons can contribute to the X-ray and gamma-ray emission (see Sikora et al. (2002), Błażejowski et al. (2004)). The expected spectrum is flat in comparison to the photon index found in our sample except for PKS 1127-145 with , the smallest in the sample. The distribution of a power law photon index for the sample is plotted in Fig. 4. A majority of the sources have with the median value of = 1.84 for the quasars in the sample. This is higher than the values of 1.570.08 Bechtold et al. (1994b) or 1.55 Belsole et al. (2006) observed for the other radio loud quasars and similar to the value of 2.03 observed in radio quiet quasars Kelly et al. (2007) where the X-ray emission is not associated with a jet. We conclude that there is no evidence for a strong contribution of a parsec scale jet to the X-ray spectrum in 13/14 objects in our sample of GPS/CSS quasars. This needs to be confirm with observations of a larger X-ray sample of GPS/CSS sources.
5.1.1 Expanding Radio Source
Can a powerful expanding radio source, (unresolved by Chandra), contribute to the X-ray spectrum? The VLBI observations indicate relativistic motions associated with the expanding jet components 444http://www.physics.purdue.edu/astro/MOJAVE/. Outside a parsec-scale region the GPS radio jets show knots and hot spots emission. Such features indicate sites of shocks, interactions and particle acceleration and in principle lead to the X-ray emission through the synchrotron, inverse Compton processes or thermal emission of hot, shocked interstellar medium. Heinz, Reynolds and Begelman (1998) considered the evolution of radio-source expansion within host galaxies. They simulated interactions between a growing radio source and the interstellar and intergalactic medium. For the highly supersonic expansion of the young source a shock forms around the expanding source and it heats up the medium to X-ray temperatures. As a result a “cocoon” of hot medium surrounds the radio source. Depending on the density of the medium and the strength of the shock a source of the size of 16 kpc can emit erg sec-1 in the Chandra band. Such an X-ray luminosity is of the order of the luminosity observed for the sources in our sample (Table 3). Recently Stawarz et al. (2007) (see also Perucho & Martí (2002)) modeled the spectra of GPS galaxies with the emission from expanding radio lobe and applied the model to a sample of GPS galaxies. Such emission will be featureless. Spectral lines would be present if the emission originates from a hot thermal plasma and, depending on metallicity, we would expect to detect the emission lines due to metals, in particular oxygen and iron lines.
Thermal X-ray emission due to the shock heated plasma can be easily confused with the emission from the accretion flow. Reflection off cold/warm matter in the accretion disks can be present in some sources. A characteristic Fe K- fluorescent emission line is usually associated with the reflection component and indicates that the X-ray emission originates in the accretion flow. Of the 8 sources in our sample with a good signal to noise data we detected Fe-line emission in two quasars, Q0740+380 and Q1328+254. In both sources the equivalent width of the emission line is relatively small, 0.4 keV (90%). The energy of the detected line, Erest=6.40 keV in both cases, indicates that it is not coming from the ionized, thermal material, but it may indicate a reflection component becoming important in these sources.
If the intrinsic absorption is high the reflection component can be detected at higher energies (E keV) and can provide information on the intrinsic source luminosity. GPS galaxies are likely to be highly absorbed (Guainazzi et al., 2006; Vink et al., 2006). We find an equivalent Hydrogen column density of cm-2 in two galaxies (Siemiginowska et al., 2003b). In contrast there is no significant absorption present in the observed by Chandra GPS quasars. This result is in agreement with the other X-ray studies of radio sources where the higher absorption has been detected in the galaxies than the quasars (Belsole et al., 2006), however, the absorption columns in GPS galaxies are not higher than the columns observed in other galaxies (Guainazzi et al., 2006; Vink et al., 2006)).
We note that we detected the absorption columns in three quasars (see Table 2) and two are known to have intervening damped Lyman- absorbers on the line of sight, while the third one an associated absorber with metal system detectable in the optical spectrum. The current data do not allow us to constrain the redshifts of the X-ray absorbers, so there is no confirmation on whether the detected absorption is due to intervening DLA systems, or intrinsic to the quasar. The full description of detectability of the X-ray absorption due to DLA is given in Bechtold et al (in preparation).
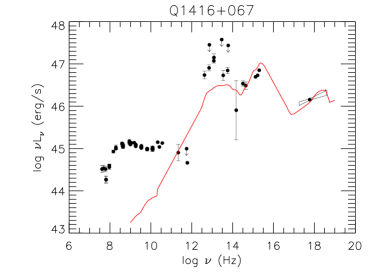
5.1.2 Spectral Energy Distributions
The optical-UV emission of the GPS/CSS sources is typical of broad line quasars. Both broad emission lines and a big blue bump are present in all cases and there is no signature of a jet synchrotron emission in the optical-UV band. However, GPS sources are strong radio emitters. We compiled the spectral energy distribution (SED) for our sample using the existing broad-band data available in NED. Figure 8 shows the radio loudness () of the GPS/CSS sources in our sample in comparison to the other radio loud quasars in Elvis et al. (1994). The GPS/CSS quasars are at the higher end of the radio loudness distribution with most of the sources at . Note that this trend is also true when we compare GPS/CSS sources to the sample of radio loud sources presented by Sikora et al. (2007) where the calculated radio luminosity included the entire radio source, e.g. the core, lobes and jets. Figures 5 and 6 show the X-ray luminosity in comparison to the radio luminosity at 5 GHz. There is no correlations between radio and X-ray properties visible in these two figures.
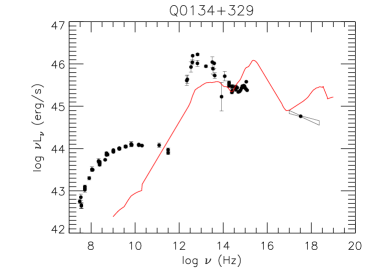
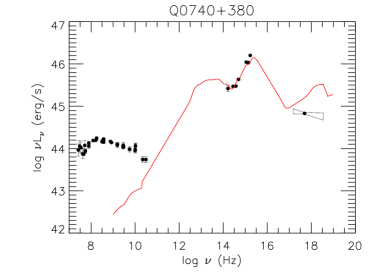
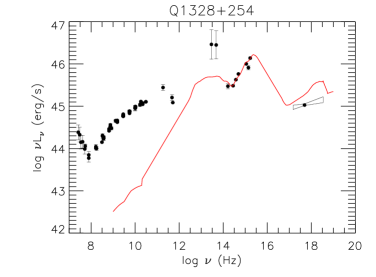
Plots in Figure 9 shows the four quasars for which we could build a broadband SED. The big blue bump is prominent in all sources. For comparison we plot the radio loud SED compiled by Elvis et al. (1994) normalized at 1 micron. The strong radio emission exceeding an average radio-loud quasar’s SED is clearly visible indicating a much stronger radio/optical power in GPS sources, (by a factor of ) than in normal radio-loud quasar. Interestingly the X-ray luminosity shown in the SEDs is similar or even lower than that for the radio loud quasars. This might indicate that the contribution from the GPS radio components to the X-ray spectrum is small. We calculated the parameter for all the sources in the sample. The values are in Table 3. The median for the sample is 1.53. This is in agreement with values for radio quiet quasars (Kelly et al., 2007, 2008; Sobolewska et al, 2008) and suggests that the X-ray emission for the sources in our sample is most likely related to the accretion process as in radio quiet quasars. We note that PKS 1127-145 maybe an exception because it has both a hard X-ray spectrum () and a small equal to 1.29. Therefore X-ray spectral analysis of a photon index and other spectral features for a larger sample are needed to firmly established such conclusions.
5.2 Large Scale X-ray Emission
Three types of large scale X-ray morphology associated with the GPS source: (1) an X-ray jet; (2) a diffuse X-ray emission surrounding the source; and (3) a secondary source within 10-20 arcsec.
5.2.1 Jets
In general many detections of a large scale radio emission were not claimed significant before the corresponding X-ray detections were found by Chandra. High dynamic range observations are required for detecting faint structures in the vicinity of a bright point source, and the experiments need to be designed for specific purpose of detecting such emission.
Large scale X-ray jets were discovered in two sources in our sample: PKS1127-145 (Siemiginowska et al., 2002, 2007) and B2 0738+313 (Siemiginowska et al., 2003a). A re-analysis of the radio data confirmed the presence of the radio jets. Both jets have similar morphologies in X-ray and radio. As in the other large scale X-ray jets (Harris & Krawczynski, 2006) the question of the primary mechanism responsible for the X-ray emission has not been resolved. The X-ray emission is modeled either as the synchrotron emission from several populations of relativistic electrons or as a result of the inverse Compton scattering of the Cosmic Microwave Background (CMB) photons off relativistic electrons within the jet (see Harris & Krawczynski (2006) for the most recent review of the X-ray jets). There is no confirming evidence favoring either of the two models.
A large scale jet emission gives a possible evidence for the source non-GPS status (see Stanghellini et al. (2005) for discussion on the classification of the GPS sources). The blazar-like emission can be responsible for the overall emission and the analysis of a ’young’ GPS class is confusing. On the other hand there should be some young sources within the blazar class and the question is how to find them.
5.2.2 Diffuse X-ray Emission
Why do we expect any diffuse X-ray emission to be associated with the GPS/CSS? There have been several possibilities considered including: (1) a relic of the past activity, (2) a confining medium, (3) signatures of the interactions between the jet and interstellar medium, (4) a remnant of the past merger and (5) an X-ray cluster.
The typical size of the GPS/CSS source is comparable to the size of the host galaxy. However, a small fraction of the GPS/CSS sources exhibits a large scale radio emission, which has been associated with the past source activity (Baum, O’Dea, de Bruyn, & Murphy, 1990; Kunert-Bajraszewska et al., 2005; Marecki et al., 2006). In a few cases a young GPS source is growing within a large scale double radio source (Marecki et al., 2006). Do we expect any extended X-ray emission to be present in those sources? The old relic can produce X-rays by upscattering CMB photons on an old population of electrons in the old radio structures, or if there is still remaining jet activity supplying the energy to the outer structures. A large scale jet in B2 0738+313 could represent such old structure (Siemiginowska et al., 2003a). A faint radio lobe emission has been detected on both sides of the core, while the X-ray jet is propagating towards one of the two lobes. However, we do not detect any X-rays associated with the radio lobes in this source.
Powerful radio-loud quasars are often found in rich clusters of galaxies (Yee & Green, 1987). However, there have been no systematic studies of the X-ray environment of GPS/CSS sources. In our sample we detect an extended diffuse X-ray emission associated with the X-ray cluster of 3C 186, z=1.063 quasar and an extended emission in GPS galaxy, PKS 1345+125. The properties of the 3C 186 cluster were discussed in Siemiginowska et al. (2005). One important conclusion from the studies of 3C 186 is that the hot cluster gas is not able to confine the expanding radio source and that the jet moves out of the host galaxy with no significant energy loss.
The diffuse X-ray emission in PKS B1345+125 may originate as a thermal emission associated with the galaxy halo. The size of the extended X-rays is of order kpc and it agrees with the size of the extended emission line region of kpc studied in optical (Holt et al., 2003; Axon et al., 2000). Holt et al. (2003) identified three kinematically distinct emission line regions in this source. They associated the narrow line component that was the most extended one with the quiescent ISM in the galaxy halo. The X-ray emission is elongated towards the South-West similarly to the optical emission and it also agrees with the VLBI jet axis (Stanghellini et al., 2001), suggesting that it is somehow related to the expanding GPS source. More detailed discussion of this interesting source and the signatures of the radio source interactions with the ISM is presented in Guainazzi et al (in preparation).
In the models for GPS/CSS source confinement the required density to significantly slow down the jet is relatively high (De Young (1993)). Such a dense medium could be detected in X-rays through the intrinsic absorption (or emission). While X-ray observations of GPS galaxies suggest that they are highly obscured (Guainazzi et al., 2006; Vink et al., 2006) the GPS quasars in this sample do not show significant X-ray absorption.
5.2.3 Binary
Some GPS sources show signatures of mergers, although at the same level as other active and non-active galaxies (de Vries et al., 2000a). A radio source in the vicinty of PKS 0941-080 (z=0.228) was identified by Stanghellini et al. (2005) in their VLA image at about 20 arcsec ( kpc) to the West of the double nucleus galaxy (de Vries et al, 2000b). There is no optical counterpart to this radio source. In 5 ksec Chandra observation of PKS 0941-080 we detected both radio sources, but only 4 counts were detected at the location of the second radio source. This observation was not deep enough to study an X-ray environment of this possibly interacting system. The GPS galaxy PKS 0941-080 is the faintest erg cm-2 s-1 and the least X-ray luminous between all GPS galaxies detected so far in X-rays (erg s-1) (Guainazzi et al., 2006; Vink et al., 2006). No other source in the sample has a second component detected in X-rays.
5.3 Jets and Accretion Power: the Evolution of Radio Sources
In terms of the evolution of radio sources, the GPS source might represent an early stage of the quasar activity. A process responsible for a triggering of the quasar activity remains one of the key open questions. A central supermassive black hole requires a large amount of fuel to power a quasar. Recent simulations of hierarchical structure formation suggest that the quasar activity is a direct consequence of galaxy interactions resulting in a rapid fuel supply to the central black hole. On the other hand some “feedback” or other intermittency mechanism (see, e.g. Janiuk et al 2004, Siemiginowska et al 1996), for accretion flow instabilities) is required to induce the intermittent source activity observed in nearby clusters of galaxies (McNamara & Nulsen, 2007).
If GPS/CSS sources are representative of an initial activity stage then one would expect to detect some signatures of the increased fuel supply into the central regions of their host galaxy. The estimated age of the smallest GPS galaxies from the expansion velocity of the radio components indicates ages below 103 yrs (Polatidis & Conway, 2003) while the synchrotron ages for larger samples show usually age years (Murgia et al., 1999).
Sikora et al. (2007) studied a relationship between the source radio power and the accretion power (defined as Eddington luminosity) for a large sample of AGN. They compare a total radio power of the source (nucleus and the large scale radio emission) to the accretion power of the nucleus and show that the radio luminosity is relatively constant for large optical luminosities, but decreases for the low optical luminosities. The sources in our sample are extremely radio luminous and radio-loud Figure 8 shows that the radio-loudness for the sources in our sample exceeds the radio-loudness of the radio-loud quasars in Elvis et al. (1994). Their optical to X-ray luminosities expressed as are instead within the range values of radio quiet quasars 1.49 (Kelly et al., 2007) suggesting that the X-ray emission processes are most likely related to the accretion process. The high radio-loudness may be related to the higher efficiency of radiating the jet power in compact radio sources.
6 Summary
We discussed Chandra X-ray observations of a sample of GPS/CSS sources. We detected all sources and study their X-ray spectral and spatial properties. GPS quasars are not absorbed in contrast to GPS galaxies that show high X-ray column densities. The median X-ray photon index 1.84 is steeper than the one observed in radio loud quasars, while the optical to X-ray luminosity ratios are typical of radio quiet quasars. We may conclude that the X-ray emission in these sources is most likely related to the accretion power as in radio quiet quasars and not to the relativistic jet, except for PKS 1127-145.
References
- Akujor & Garrington (1995) Akujor, C. E., & Garrington, S. T. 1995, A&AS, 112, 235
- Alexander (2000) Alexander, P. 2000, MNRAS, 319, 8
- Axon et al. (2000) Axon, D. J., Capetti, A., Fanti, R., Morganti, R., Robinson, A., & Spencer, R. 2000, AJ, 120, 2284
- Baum, O’Dea, de Bruyn, & Murphy (1990) Baum, S. A., O’Dea, C. P., de Bruyn, A. G., & Murphy, D. W. 1990, A&, 232, 19
- Błażejowski et al. (2004) Błażejowski, M., Siemiginowska, A., Sikora, M., Moderski, R., & Bechtold, J. 2004, ApJL, 600, L27
- Bechtold et al. (2002) Bechtold, J., Dobrzycki, A., Wilden, B., Morita, M., Scott, J., Dobrzycka, D., Tran, K., & Aldcroft, T. 2002, ApJS, 140, 143
- Bechtold et al. (2001) Bechtold, J., Siemiginowska, A., Aldcroft, T. L., Elvis, M., & Dobrzycki, A. 2001, ApJ, 562, 133
- Bechtold et al. (1994b) Bechtold, J., et al. 1994b, AJ, 108, 759
- Bechtold et al. (1994a) Bechtold, J., et al. 1994a, AJ, 108, 374
- Belsole et al. (2006) Belsole, E., Worrall, D. M., & Hardcastle, M. J. 2006, MNRAS, 366, 339
- Cawthorne et al. (1986) Cawthorne, T. V., Scheuer, P. A. G., Morison, I., Muxlow, & T. W. B. 1986, MNRAS, 219, 883
- Condon & Broderick (1991) Condon, J. J., & Broderick, J. J. 1991, AJ, 102, 1663
- Dallacasa et al. (1995) Dallacasa, D., Fanti, C., Fanti, R., Schilizzi, R. T., & Spencer, R. E. 1995, A&A, 295, 27D
- de Vries et al. (2000a) de Vries, W. H., O’Dea, C. P., Barthel, P. D., Fanti, C., Fanti, R., & Lehnert, M. D. 2000a, AJ, 120, 2300
- de Vries et al (2000b) de Vries, W. H., O’Dea, C. P., Barthel, P. D., & Thompson, D. J. 2000b, A&AS, 143, 181
- De Young (1993) De Young, D. S. 1993, ApJ, 402, 95
- Edwards & Tingay (2004) Edwards, P. G., & Tingay, S. J. 2004, A&A, 424, 91
- Elvis et al. (1994) Elvis, M., Fiore, F., Wilkes, B., McDowell, J., & Bechtold, J. 1994, ApJ, 422, 60
- Fan et al. (2004) Fan, Z-H, & Cao, X. 2004, ApJ, 602, 103
- Fanti et al. (1989) Fanti, C., et al. 1989, A&A, 217, 44
- Fanti et al. (1990) Fanti, R., Fanti, C., Schilizzi, R. T., Spencer, R. E., Nan Rendong, Parma, P., van Breugel, W. J. M., & Venturi, T. 1990, A&A, 231, 333
- Fossati et al. (1998) Fossati, G., Maraschi, L., Celotti, A., Comastri, A., & Ghisellini, G. 1998, MNRAS, 299, 433
- Freeman et al. (2001) Freeman, P., Doe, S., & Siemiginowska, A. 2001, Proc. SPIE, 4477, 76
- Guainazzi et al. (2004) Guainazzi, M., Siemiginowska, A., Rodriguez-Pascual, P., & Stanghellini, C. 2004, A&A, 421, 461
- Guainazzi et al. (2006) Guainazzi, M., Siemiginowska, A., Stanghellini, C., Grandi, P., Piconcelli, E., & Azubike Ugwoke, C. 2006, A&A, 446, 87
- Gugliucci et al. (2005) Gugliucci, N. E., Taylor, G. B., Peck, A. B., & Giroletti, M. 2005, ApJ, 622, 136
- Gupta et al. (2006) Gupta, N., Salter, C. J., Saikia, D. J., Ghosh, T., & Jeyakumar, S. 2006, MNRAS, 373, 972
- Harris & Krawczynski (2006) Harris, D. E., & Krawczynski, H. 2006, ARA&A, 44, 463
- Heinz et al. (1998) Heinz, S., Reynolds, C. S., & Begelman, M. C. 1998, ApJ, 501, 126
- Holt et al. (2003) Holt, J., Tadhunter, C. N., & Morganti, R. 2003, MNRAS, 342, 227
- Jamrozy et al. (2007) Jamrozy, M., Konar, C., Saikia, D. J., Stawarz, Ł., Mack, K.-H., & Siemiginowska, A. 2007, MNRAS, 378, 581
- Janiuk et al. (2004) Janiuk, A., Czerny, B., Siemiginowska, A., & Szczerba, R. 2004, ApJ, 602, 595
- Kellermann et al. (1998) Kellermann, K. I., Vermeulen, R. C., Zensus, J. A., & Cohen, M. H. 1998, AJ, 115, 1295
- Kelly et al. (2007) Kelly, B. C., Bechtold, J., Siemiginowska, A., Aldcroft, T., & Sobolewska, M. 2007, ApJ, 657, 116
- Kelly et al. (2008) Kelly, B. C., Bechtold, J., Trump, J. R., Vestergaard, M., & Siemiginowska, A. 2008, ArXiv e-prints, 801, arXiv:0801.2383
- Khur et al. (1981) Khur et al. 1981, A&AS 45, 367
- Kunert-Bajraszewska et al. (2005) Kunert-Bajraszewska, M., Marecki, A., Thomasson, P., & Spencer, R. E. 2005, A&A, 440, 93
- Lister (2003) Lister, M. L. 2003, ASP Conf. Ser. 300: Radio Astronomy at the Fringe, 71
- Lister et al. (2003) Lister, M. L., Kellermann, K. I., Vermeulen, R. C., Cohen, M. H., Zensus, J. A., & Ros, E. 2003, ApJ, 584, 135
- Ludke et al. (1998) Ludke, E., Garrington, S. T., Spencer, R. E., Akujor, C. E., Muxlow, T. W. B., Sanghera, H. S., & Fanti, C. 1998, MNRAS, 299, 467L
- Maness et al. (2004) Maness, H. L., Taylor, G. B., Zavala, R. T., Peck, A. B., & Pollack, L. K. 2004, ApJ, 602, 123
- Marecki et al. (2006) Marecki, A., Thomasson, P., Mack, K.-H., & Kunert-Bajraszewska, M. 2006, A&A, 448, 479
- Mantovani et al. (1998) Mantovani, F., Junor, W., Bondi, M., Cotton, W., Fanti, R., Padrielli, L., Nicolson, G. D., & Salerno, E. 1998, A&A, 332, 10M
- Morganti (2007) Morganti, R. 2007, ArXiv e-prints, 710, arXiv:0710.1197
- Murgia et al. (1999) Murgia, M., Fanti, C., Fanti, R., Gregorini, L., Klein, U., Mack, K.-H., & Vigotti, M. 1999, A&A, 345, 769
- McNamara & Nulsen (2007) McNamara, B. R., & Nulsen, P. E. J. 2007, ARA&A, 45, 117
- O’Dea et al. (2000) O’Dea, C. P., De Vries, W. H., Worrall, D. M., Baum, S. A., & Koekemoer, A. 2000, AJ, 119, 478
- O’Dea (1998) O’Dea, C. P. 1998, PASP, 110, 493
- O’Dea et al. (1991) O’Dea, C. P., Baum, S. A., & Stanghellini, C. 1991, ApJ, 380, 66
- O’Dea et al. (2006) O’Dea, C. P., Mu, B., Worrall, D. M., Kastner, J., Baum, S., & de Vries, W. H. 2006, ApJ, 653, 1115
- Paragi et al. (1998) Paragi, Z., Frey, S., & Sanghera, H. S. 1998, A&A, 338, 840
- Pearson & Readhead (1988) Pearson, T. J., & Readhead, A. C. S. 1988, ApJ, 328, 114
- Perucho & Martí (2002) Perucho, M., & Martí, J. M. 2002, ApJ, 568, 639
- Polatidis & Conway (2003) Polatidis, A. G., & Conway, J. E. 2003, Publications of the Astronomical Society of Australia, 20, 69
- Richards et al. (2006) Richards, G. T., et al. 2006, ApJS, 166, 470
- Ross & Fabian (1993) Ross, R. R., & Fabian, A. C. 1993, MNRAS, 261, 74
- Sambruna et al. (2004) Sambruna, R. M., Gambill, J. K., Maraschi, L., Tavecchio, F., Cerutti, R., Cheung, C. C., Urry, C. M., & Chartas, G. 2004, ApJ, 608, 698.
- Schoenmakers et al. (1999) Schoenmakers, A. P., de Bruyn, A. G., Röttgering, H. J. A., & van der Laan, H. 1999, A&A, 341, 44
- Shields (1978) Shields, G. A. 1978, Nature, 272, 706
- Siemiginowska et al. (2002) Siemiginowska, A., Bechtold, J., Aldcroft, T. L., Elvis, M., Harris, D. E., & Dobrzycki, A. 2002, ApJ, 570, 543
- Siemiginowska et al. (2003a) Siemiginowska, A., et al. 2003, ApJ, 595, 643
- Siemiginowska et al. (2003b) Siemiginowska, A., Stanghellini, C., Brunetti, G., Aldcroft, T. L., Bechtold, J., Elvis, M., & Harris, D. E. 2003, New Astronomy Review, 47, 467
- Siemiginowska et al. (2005) Siemiginowska, A., Cheung, C. C., LaMassa, S., Burke, D. J., Aldcroft, T. L., Bechtold, J., Elvis, M., & Worrall, D. M. 2005, ApJ, 632, 110
- Siemiginowska et al. (2007) Siemiginowska, A., Stawarz, Ł., Cheung, C. C., Harris, D. E., Sikora, M., Aldcroft, T. L., & Bechtold, J. 2007, ApJ, 657, 145
- Sikora et al. (2007) Sikora, M., Stawarz, Ł., & Lasota, J.-P. 2007, ApJ, 658, 815
- Sikora et al. (2002) Sikora, M., Błażejowski, M., Moderski, R., & Madejski, G. M. 2002, ApJ, 577, 78
- Sikora et al. (1997) Sikora, M., Madejski, G., Moderski, R., & Poutanen, J. 1997, ApJ, 484, 108
- Snellen et al. (2000) Snellen, I. A. G., Schilizzi, R. T., Miley, G. K., de Bruyn, A. G., Bremer, M. N., & Röttgering, H. J. A. 2000, MNRAS, 319, 445
- Sobolewska et al. (2004a) Sobolewska, M. A., Siemiginowska, A., Życki, P. T. 2004a, ApJ, 617, 102
- Sobolewska et al. (2004b) Sobolewska, M. A., Siemiginowska, A., Życki, P. T. 2004b, ApJ, 608, 80
- Sobolewska et al (2008) Sobolewska, M. A, Gierlinski, M., Siemiginowska, A. 2008, ApJ, to be submitted
- Stark et al. (1992) Stark, A. A., Gammie, C. F., Wilson, R. W., Bally, J., Linke, R. A., Heiles, C., & Hurwitz, M. 1992, ApJS, 79, 77
- Stanghellini et al. (2005) Stanghellini, C., O’Dea, C. P., Dallacasa, D., Cassaro, P., Baum, S. A., Fanti, R., & Fanti, C. 2005, A&A, 443, 891
- Stanghellini et al. (2001) Stanghellini, C., Dallacasa, D., O’Dea, C. P., Baum, S. A., Fanti, R., & Fanti, C. 2001, A&A, 377, 377
- Stanghellini et al. (1998) Stanghellini, C., O’Dea, C. P., Dallacasa, D., Baum, S. A., Fanti, R., & Fanti, C. 1998, A&AS, 131, 303
- Stanghellini, Baum, O’Dea, & Morris (1990) Stanghellini, C., Baum, S. A., O’Dea, C. P., & Morris, G. B. 1990, A&A, 233, 379
- Stawarz et al. (2007) Stawarz, L., Ostorero, L., Begelman, M. C., Moderski, R., Kataoka, J., & Wagner, S. 2007, ArXiv e-prints, 712, arXiv:0712.1220
- Stawarz (2004) Stawarz, Ł. 2004, ApJ, 613, 119
- Stawarz, Sikora, Ostrowski, & Begelman (2004) Stawarz, L., Sikora, M., Ostrowski, M., & Begelman, M. C. 2004, ApJ, 608, 95
- Stickel, et al. (1993) Stickel, M., & Kuhr, H. 1993, A&AS, 101, 521
- Taylor et al. (1994) Taylor, G. B., Vermeulen, R. C., Pearson, T. J., Readhead, A. C. S., Henstock, D. R., Browne, I. W. A., & Wilkinson, P. N. 1994, ApJS, 95, 345
- Taylor & Peck (2003) Taylor, G. B., & Peck, A. B. 2003, ApJ, 597, 157
- Vink et al. (2006) Vink, J., Snellen, I., Mack, K.-H., & Schilizzi, R. 2006, MNRAS, 367, 928
- Weisskopf et al. (2003) Weisskopf, M. C., et al. 2003, Experimental Astronomy, 16, 1
- Woo et al. (2002) Woo, J-H., & Urry, M. C. 2002, ApJ, 579, 530
- Yee & Green (1987) Yee, H. K. C., & Green, R. F. 1987, ApJ, 319, 28
- Xiang et al. (2002) Xiang, L., Stanghellini, C., Dallacasa, D., & Haiyan, Z. 2002, A&A, 385, 768X
- Xu et al. (1995) Xu, W., Readhead, A. C. S., Pearson, T. J., Polatidis, A. G., & Wilkinson, P. N. 1995, ApJS, 99, 297X
- Zensus et al. (2002) Zensus, J. A., Ros, E., Kellermann, K. I., Cohen, M. H., Vermeulen, R. C., & Kadler, M. 2002, AJ, 124, 662Z
| Name | TypeaaG-Galaxy, Q-Quasar, GPS or CSS radio classification based on O’Dea (1998). | redshift | NHbbequivalent Hydrogen column in the Milky Way from COLDEN (Stark et al., 1992). | Radioccradio size in arcsec from O’Dea (1998); | Radio | Exposure | Chandra | OBSID | Tot cts | Net cts | |
|---|---|---|---|---|---|---|---|---|---|---|---|
| 1020 cm-2 | Size | Morph | ksec | Obs Date | |||||||
| 0134+329 | 3C48 | Q/CSS | 0.367 | 4.54 | 0.5 | CJ5 | 9.2 | 2002-03-06 | 3097 | 6726 | 5318.8 |
| 0615+82 | Q/GPS* | 0.71 | 5.3 | 0.5 | IR2 | 47.3 | 2001-10-18 | 1602 | 2395 | 2178.0 | |
| 0738+32 | Q/GPS | 0.63 | 4.18 | 0.01 | CJ1 | 27.6 | 2000-10-10 | 377 | 3675 | 3431.2 | |
| 0740+380 | 3C186 | Q/CSS | 1.063 | 5.64 | 2.2 | DLJ7 | 34.4 | 2002-05-16 | 3098 | 1830 | 1702.2 |
| 0941-080 | G/GPS | 0.228 | 3.67 | 0.05 | CSO1 | 5.35 | 2002-03-26 | 3099 | 9 | 8.8 | |
| 1127-145 | Q/GPS | 1.18 | 3.12 | 0.003 | CJ1 | 27.3 | 2000-05-28 | 866 | 14,972 | 14,972.6 | |
| 1143-245 | Q/GPS | 1.95 | 5.22 | 0.006 | CJ1 | 4.95 | 2002-03-08 | 3100 | 222 | 219.7 | |
| 1245-197 | Q/GPS | 1.28 | 4.72 | 0.5 | CSO6 | 5.1 | 2001-12-23 | 3101 | 44 | 43.8 | |
| 1250+568 | 3C277.1 | Q/CSS | 0.32 | 1.22 | 1.67 | DLJ5 | 14.0 | 2002-10-27 | 3102 | 2337 | 2277.1 |
| 1328+254 | 3C287 | Q/CSS | 1.055 | 1.08 | 0.048 | CJ2 | 36.2 | 2002-01-06 | 3103 | 3509 | 3415.6 |
| 1345+12 | 4C12.50 | G/GPS | 0.122 | 1.9 | 0.08 | CSO1 | 25.3 | 2000-02-24 | 836 | 1347 | 1335.2 |
| 1416+067 | 3C298 | Q/CSS | 1.439 | 2.5 | 1.49 | DLJ5 | 17.9 | 2002-03-01 | 3104 | 10,183 | 9522.1 |
| 1458+718 | 3C309.1 | Q/CSS | 0.905 | 2.33 | 2.11 | CSO8 | 16.95 | 2002-01-28 | 3105 | 5434 | 5104.6 |
| 1815+614 | Q/GPS | 0.601 | 3.9 | CSO3 | 4.9 | 2002-09-25 | 3056 | 164 | 142.0 | ||
| 1829+29 | 4C29.56 | Q/CSS | 0.842 | 11.16 | 3.1 | CSO4 | 5.3 | 2002-10-08 | 3106 | 19 | 18.9 |
| 2128+048 | G/GPS | 0.99 | 5.23 | 0.03 | CSO1 | 5.7 | 2002-10-11 | 3107 | 92 | 90.7 |
| gal | abs | abs | Norm | |||
| nH | nH | Redshift | [1 keV] | (DOF) | ||
| 10-5ph/cm2/s | ||||||
| Q0615+820 | 5.3 | 4.69 | 0.770 | 1.73 | 5.63 | 90.6(101) |
| B2 0738+313 | 4.2 | 8.3 | 0.630 | 1.56 | 13.80 | 172.4(143) |
| Q0740+380 | 5.6 | 8.44 | 1.063 | 2.09 | 6.92 | 73.3(78) |
| Q1127-145 | 4.1 | 17.8 | 1.180 | 1.20 | 52.69 | 346.2(310) |
| Q1143-245 | 5.2 | 76.88 | 1.950 | 1.62 | 5.09 | 11.1(9) |
| Q1250+568 | 1.2 | 2.25 | 0.320 | 1.85 | 19.27 | 112.7(98) |
| Q1328+254 | 1.1 | 15.75 | 1.055 | 1.86 | 11.12 | 111.5(124) |
| PKS B1345+125G | 1.9 | 254.3 | 0.122 | 1.10 | 12.11 | 107.8(71) |
| Q1458+718 | 2.3 | 3.19 | 0.905 | 1.57 | 33.45 | 165.2(168) |
| Targets with low counts (N) fit with NH fixed at the Galactic column | ||||||
| Q0941-080G | 3.7 | 2.62 | 0.25 | 49.0(442) | ||
| Q1245-197 | 4.7 | 1.96 | 1.17 | 132.5(442) | ||
| Q1815+614 | 3.9 | 1.70 | 3.42 | 5.5(6) | ||
| Q1829+290 | 11.2 | 1.82 | 0.54 | 98.2(442) | ||
| PKS B2128+048G | 5.2 | 1.28 | 1.58 | 6.1(3) | ||
| Targets affected by pile-up. | ||||||
| Q0134+329 | 4.5 | 0.75 | 0.367 | 2.19 | 79.89 | 212.4(143) |
| 2.52 | 91.0 | 180.9(141) | ||||
| Q1416+067 | 2.2 | 27.1 | 1.439 | 1.85 | 70.04 | 226.7(203) |
G Galaxy; Errors are 90 for one significant parameter. The upper limits are 3.
| Flux | Lx | Flux | Lx | LB | LR | RX1 | RL2 | 3 | 4 | ||
| [0.5-2keV] | [0.5-2keV] | [2-10keV] | [2-10keV] | [5 GHz] | |||||||
| erg/cm2/s | erg/s | erg/cm2/s | erg/s | erg/s | erg/s | ||||||
| Q0134+329 | 15.22 | 2.89 | 15.58 | 5.17 | 11.66 | 0.94 | 7.36 | 4.28 | 1.54 | 0.63 | |
| Q0615+8205 | 1.07 | 0.70 | 2.24 | 3.46 | 2.98 | 0.87 | 7.64 | 5.05 | 1.35 | 0.55 | |
| B2 0738+313 | 3.12 | 1.46 | 7.37 | 7.53 | 1.65 | 2.05 | 7.76 | 5.61 | 1.72 | 0.60 | |
| Q0740+380 | 1.28 | 1.39 | 1.55 | 4.57 | 13.37 | 0.52 | 7.14 | 4.29 | 1.74 | 0.50 | |
| Q0941-080 | 0.05 | 0.006 | 0.03 | 0.005 | 0.004 | 0.07 | 9.31 | 6.53 | 2.11 | 0.72 | |
| Q1127-145 | 12.22 | 15.74 | 49.38 | 179.41 | 80.82 | 8.15 | 7.10 | 4.74 | 1.29 | 0.65 | |
| Q1143-245 | 1.03 | 2.91 | 2.17 | 20.33 | 7.13 | 8.20 | 7.81 | 6.04 | 1.56 | 0.68 | |
| Q1245-197 | 0.22 | 0.33 | 0.32 | 1.29 | 0.80 | 5.91 | 8.77 | 6.65 | 1.57 | 0.88 | |
| Q1250+56 | 4.12 | 0.62 | 6.27 | 1.56 | 2.18 | 0.13 | 7.15 | 4.13 | 1.44 | 0.63 | |
| Q1328+254 | 2.39 | 2.57 | 3.51 | 10.22 | 15.70 | 5.41 | 7.90 | 5.23 | 1.59 | 0.70 | |
| PKS B1345+125 | 4.04 | 0.11 | 12.18 | 0.41 | 10.08 | 0.05 | 7.53 | 3.67 | 1.52 | 0.66 | |
| Q1416+067 | 15.33 | 26.96 | 23.69 | 126.23 | 98.68 | 4.81 | 6.76 | 4.32 | 1.42 | 0.57 | |
| Q1458+718 | 7.04 | 5.93 | 17.05 | 36.55 | 173.46 | 4.29 | 7.37 | 4.03 | 1.47 | 0.64 | |
| Q1815+6145 | 0.73 | 0.32 | 0.12 | 1.13 | 0.02 | 0.24 | 7.50 | 5.50 | – | – | |
| Q1829+290 | 0.09 | 0.07 | 0.18 | 0.32 | 1.16 | 1.16 | 8.73 | 6.17 | 1.73 | 0.79 | |
| PKS B2128+048 | 0.32 | 0.31 | 1.25 | 3.21 | 1.23 | 2.99 | 8.37 | 6.06 | 0.91 | 1.09 | |
| 1 = log(Flux5GHz/Flux2keV) | |||||||||||
| 2 Radio loudness: log(Flux5GHz/FluxBBand) | |||||||||||
| 3 : log[Flux(2500Å)/Flux(2keV)]/2.605, in rest frame | |||||||||||
| 4 : -log[Flux(2500Å)/Flux(5GHz)]/5.38 in rest-frame. | |||||||||||
| Calculated flux at 2500 Åby using V magnitude from O’Dea et al. 1998 and from the relation: f, where | |||||||||||
| The V magnitudes for Q0615+820 and Q1231+481 came from Veron-Cetty et al., 2001 | |||||||||||
| 5 Radio flux values at 5GHz calculated from NED data for these sources; we used published values for radio flux from O’Dea et | |||||||||||
| al. 1998 for the other sources. | |||||||||||
| All luminosity values are unabsorbed and in rest-frame. | |||||||||||