Frequent Occurrence of High-speed Local Mass Downflows on the Solar Surface
Abstract
We report on new spectro-polarimetric measurements with simultaneous filter imaging observation, revealing the frequent appearance of polarization signals indicating high-speed, probably supersonic, downflows that are associated with at least three different configurations of magnetic fields in the solar photosphere. The observations were carried out with the Solar Optical Telescope onboard the Hinode satellite. High speed downflows are excited when a moving magnetic feature is newly formed near the penumbral boundary of sunspots. Also, a new type of downflows is identified at the edge of sunspot umbra that lack accompanying penumbral structures. These may be triggered by the interaction of magnetic fields sweeped by convection with well-concentrated magnetic flux. Another class of high speed downflows are observed in quiet sun and sunspot moat regions. These are closely related to the formation of small concentrated magnetic flux patches. High speed downflows of all types are transient time-dependent mass motions. These findings suggest that the excitation of supersonic mass flows are one of the key observational features of the dynamical evolution occurring in magnetic-field fine structures on the solar surface.
1 Introduction
Recent high-spatial resolution imaging observations of the sun from ground-based facilities using advanced techniques, such as adaptive optics and image processings, have been revealing that the solar photosphere is highly structured with many large and small scale mass motions. Granules or granular cells are the most visible manifestations of small scale mass motions on the photosphere and are formed by convection. Magnetic fields of the sun, some of which are observed as tiny bright points in G-band images (Berger & Title, 1996), wander due to interaction with nearby evolving granular cells (Steiner et al., 1998). The interaction between granular motions and magnetic field can provide kinetic energy to the magnetic field and drives much more dynamic behaviors as well as plasma heating in the solar upper atmosphere. Sunspots, the largest visible magnetic structures at the photosphere, also show Evershed mass flows in the radial direction of the penumbra (Solanki, 2003). It is not easy with ground-based observations to trace dynamical behaviors of mass motions and their association with evolution of magnetic fields and heating in the upper atmosphere at sub-arcsecond spatial scales because of variable seeing conditions. Therefore we lack observational knowledge about the overall dynamical evolution of the solar atmosphere including mass motions, magnetic fields, and heating. It is apparent that our observational knowledge can be much improved via high spatial-resolution observations from space with seeing-free stable conditions. New observations of dynamic flows associated with magnetic fields would provide key clues toward understanding the nature of atmospheric dynamics and thus the physical mechanisms that control the dynamical evolution of magnetic field features.
Spectro-polarimetric observations of magnetically sensitive spectral lines in visible and infrared wavelengths have become crucial in the past decade for quantitative investigations of magnetic field structures in the photosphere (Lites et al., 1993). The spectro-polarimetric observations also probe the line-of-sight Doppler motion of the mass in the atmosphere occupied by the magnetic field. The Solar Optical Telescope (SOT) (Tsuneta et al., 2008; Tarbell et al., 2008; Ichimoto et al., 2008; Suematsu et al., 2008; Shimizu et al., 2008) onboard a new Japanese spacecraft Hinode (Kosugi et al., 2007), starting its scientific observations from November 2006 after its successful launch on 22 September 2006, includes the Spectro-Polarimeter (SP) instrument, which performs for the first time precise (0.1%) measurements of polarization with high spatial resolution (0.3 arcsec) under seeing-free conditions. The SP observations provide highly dispersed spectral profiles of the polarization (Stokes profiles) suitable for investigating mass flows associated with magnetic field.
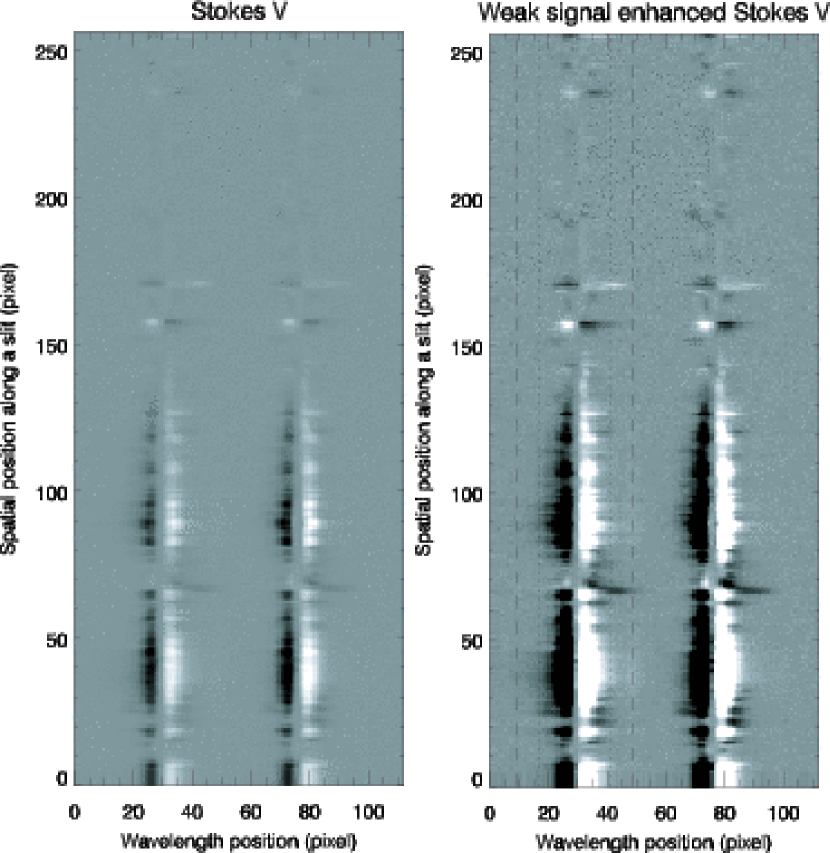
One of the remarkable features observed in the Stokes profiles is the frequent appearance of complex Stokes V (circular polarization) profiles showing signal excess at the red side (longer wavelength) of the Fe I 630 nm spectral lines, as shown in Figure 1. At two local positions, a signal elongating toward the right is clearly seen mÅ from the center of the spectral lines. Since the peak of the antisymmetric Stokes V profile is roughly located 100 mÅ from the line center, a mÅ offset corresponds to 7-14 km s-1, suggesting mass flows exceeding the sound velocity in the photosphere (6-7 km s-1) associated with the magnetic field. Based on Stokes profile measurements, the number of observational reports on supersonic or rapid flows of any type in the photosphere is recently increasing; a strong downflow close to the neutral line of a delta sunspot (Martínez Pillet et al., 1994; Lites et al., 2002), supersonic Evershed downflows in a sunspot (Wiehr, 1995; del Tor Iniesta et al., 2001), strong downflows at the location of chromospheric Ellerman bombs (Socas-Navarro et al., 2006), magnetic elements amplified by flux expulsion and convective collapse (Sigwarth et al., 1999; Bellot Rubio et al., 2001; Socas-Navarro & Manso Sainz., 2005), magnetic elements in quiet and active regions (Sigwarth, 2001), supersonic downflows in the sunspot moat (Shimizu et al., 2007) and so on. It appears from these previous observations that supersonic mass flows occur in localized areas, which can be revealed only with high spatial resolution observations. The SOT observations can provide time series of spectro-polarimetric measurements with sub-arcsec spatial resolution under stable seeing-free condition, allowing us to investigate the dynamical evolution of high speed flows and its relation to features seen in other imaging observations.
This paper presents new Hinode observations showing that supersonic downflows frequently occur at various magnetic circumstances in the photosphere (section 3). In section 4, a few typical examples corresponding to each of downflow events classified in section 3 are shown to trace temporal evolution of the events and their associated features captured with simultaneous filter imaging observations, followed by discussions in section 5. These observations show the importance of further investigations on the supersonic downflows for understanding fine structures and their dynamic evolution of magnetic field concentrations as well as for understanding transient heating at the chromosphere.
2 Observations
Two types of spectro-polarimetric observations were made with the Spectro-Polarimeter of SOT on December 2, 2006. One was a fast mapping observation performed between 0:00-3:30 UT and the other is a normal mapping observation performed between 10:30-15:30 UT. The primary purpose of this fast mapping observation was to capture overall temporal signatures of rapid flows in the active and quiet region with a field of view as large as possible. The fast mapping mode has a 4.4 minute cadence for a 20.5 arcsec-wide scan with 0.32 arcsec effective pixel size (64 positions in east-west direction). In the fast mapping, since the slit width is 0.16 arcsec, photons are accumulated during one modulator rotation (1.6 sec) at the 1st slit position and during another rotation at the next slit position. The field of view along the slit is 82 arcsec (256 pixels). The supreme spatial resolution capability of the SOT is not fully exploited with the fast mapping observation, and instead the normal mapping observation provides the best spatial resolution (0.16 arcsec pixel) data. This particular normal map mode had a 67 sec cadence for a 2.1 arcsec-wide scan (13 positions, 4.8 sec photon accumulation for each) in east-west direction with 41 arcsec (256 pixels) along the slit. Hence it covered a much smaller area than the fast maps but with higher resolution and longer integrations.
A moderate sunspot was partially included in the field of view with a moat flow area and quiet region located north of the spot (Figure 2). The spot is a leading spot of active region NOAA 10926, located near the disk center (200 arcsec S, 200 arcsec W), and it consists of three umbrae divided by light bridge structures.
The SP obtains the full polarization states of line profiles of two magnetically sensitive Fe lines at 630.15 and 630.25 nm and nearby continuum. We define a measure to identify the elongated signal excess located far from the line center by integrating the Stokes V signals over to mÅ from the center. The zero-velocity is derived from the profile averaged over all the Stokes I profiles along the slit (256 profiles). This measure has the advantage of detecting the complicated Stokes V profiles that suggest the existence of high speed signals. Note that the zero-crossing wavelengths of Stokes V profile (e.g., Sigwarth, 2001) sometimes used for quantitative studies do not detect high speed components adequately for some types of Stokes V profiles, if a largely shifted component has the same polarization polarity as the rest component (See section 4 for examples).
During the normal-mapping spectro-polarimetric measurements, the Broadband Filter Imager (BFI) of SOT produced photometric images in the G (430.50 nm center, 1.2 nm width) and Ca II H (396.85 nm center, 0.3 nm width) spectral bands at the highest spatial resolution (about 0.2 arcsec, 0.0545 arcsec in pixel size) every minute.
3 Frequent Occurrence of High-Speed Downflows
Figure 2 shows a time series of our measure representing signal excess for the red and blue sides of the spectral line. A large number of point-like, 1 arcsec or less in diameter, dark and bright signals (opposite signs of V) can be easily identified in the red-side wing at various locations. The point-like signals have durations of 4 - 30 minutes, most only about 4-10 minutes, indicating that all these high-speed downflows in the photosphere are transient and not static.
Three types of high-speed downflows can be identified, each associated with their spatial relationship to the sunspot: 1) Around the outer boundary of sunspot penumbra. Most of these events are located in a moat flow region surrounding the penumbra, and some events are also seen from the middle to the outer edge of penumbral structures (del Tor Iniesta et al., 2001). Dark features are slightly predominant, i.e., negative integrated Stokes V at the red side of the spectral lines. 2) At the edge of those portions of umbrae that do not have associated penumbral structures. These transiently appear with a strong bright signal in the map. In the sunspot examined in this paper, the portions of umbrae without penumbral structures are formed in association with light bridge structures where evolving granular cells are present. Another portion of the umbra without associated penumbral structures is seen at the lower right-hand-side corner of the field of view where the umbra is face to face with a different sunspot with the same magnetic polarity located to the south. 3) At small magnetic field concentrations located in moat and quiet regions far from the sunspots. In many events, a bright point with sub arcsec diameter is observed in the Stokes I continuum and more clearly in G-band images at the exact location of downflows.
It should be pointed out that strong signal excesses are not as common in the blue side of the spectral lines, except for a few events at the small magnetic field concentrations located near the outer boundary of penumbra. This indicates less upward mass motions exceeding the sound velocity at the photospheric level.
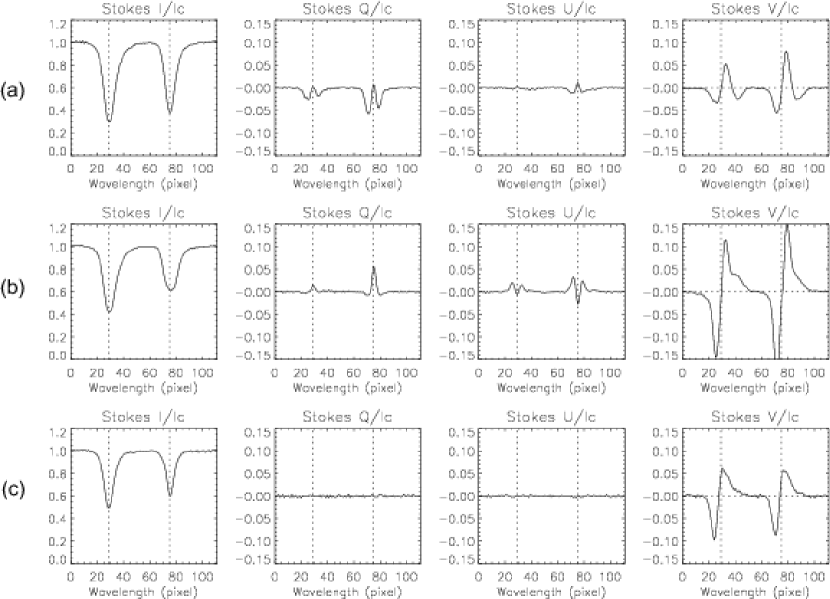
Figure 3 shows the full Stokes profiles typically observed for the three types. At the outer edge of penumbral (type 1), a common characteristic of the Stokes V profile is a complex shape with three lobes, unlike the usual, antisymmetric profile with two lobes. The two lobes located at both sides about equidistant from the zero velocity wavelength have a symmetric Stokes Q/U (linear polarization) shape with a signal strength similar to that of Stokes V. This indicates an inclined magnetic field at rest. The extra lobe is observed at the red side with predominantly negative signal and with no clear corresponding signal in Stokes Q and U, suggesting that the magnetic field forming the third lobe is primarily vertical.
The second type, observed at the umbral edge without accompanying penumbra, also shows a complex Stokes V profile with three lobes (Figure 3b). The unique signature common to these events is that the third lobe is positive, indicating a magnetic field aligned to the ambient magnetic field of the sunspot. This type of motion is also observed around the outer boundary of pores, which also, of course, do not have associated penumbral structures.
The third type is observed in the moat and quiet area where small concentrations of magnetic field are scattered. Some of the Stokes V profiles have an elongated signal toward the longer wavelength in addition to the usual, antisymmetric profile with two lobes (Figure 3c). In some cases there is an extreme red-shifted lobe, similar to that of the umbra. No linear polarization is observed, indicating that the magnetic field is vertical.
Here we note a limitation of the measure used in this analysis. Small values of this quantity do not necessarily imply the absence of high-speed downflows. In fact, weak Stokes V signals will always produce small values of this quantity even if strong downflows exist. On the other hand, strong Stokes V signals can produce large values of this quantity even if a strong downflow exists only in a small fraction of the pixel. Thus, the magnitude of the measure should be interpreted carefully, although the measure is useful to easily identify high-speed downflows that are associated with magnetic flux.
4 Temporal Evolution and Associated Features
In this section, we examine the temporal development of high-speed downflows using the Stokes profiles and simultaneous filter imaging observations to understand how high-speed downflows develop with their associated magnetic fields.
4.1 High-speed downflows near sunspot penumbral boundaries
Figure 4 shows the temporal evolution of typical downflow events observed just outside the sunspot penumbral boundary. The field of view of each frame is (N-S) (E-W) arcsec. Note that the quantities derived from the normal-mapping Stokes measurement are 2.1 arcsec wide in the east-west direction. High-speed downflows (negative signal) are observed twice in this sequence (16 min coverage), each of which is accompanied by a tiny positive signal. The second event is marked by circles with a radius of 1.0 arcsec in Figure 4. They are located almost at a short extension (1-2 arcsec) from a dark filamentary structure of the penumbra, where nearly horizontal Evershed gas flows seem to be preferentially concentrated with nearly horizontal magnetic field (Title et al., 1993; Shine et al., 1994; Rimmele, 1995; Rouppe van der Voort, 2002; Bellot Rubio et al., 2006; Ichimoto et al., 2007). Note that the tip of the dark filamentary structure is seen at the bottom of Stokes I continuum and G-band images, as identified with the contour lines in G-band. The duration of the events is 3-4 minutes. The longitudinal magnetograms, generated by integrating the blue wing of Stokes V, show that a white patch newly appears at almost the same time (t= 539s) and location of the second event. The white patch at t= 539, 607, and 674s is still negative-polarity, but it can be recognized as a white patch because this negative polarity signal is much weaker than the surrounding negative-polarity signals. The center portion becomes truely positive polarity at t= 741s and the positive polarity signal continues to develop after the time, finally forming a smaller concentrated positive patch. This evolution of the white patch suggests that a positive-polarity magnetic flux starts to develop in the negative-polarity flux dominant area from around t = 539s, which is when the second high-speed downflow event begins.
The positive patch slowly moves outward (upward in the figure), approaching a pre-existing negative-polarity patch, where tiny positive high-speed signals are observed at the red wing of the Stokes V profiles. The magnetic flux in the negative-polarity patch seems to slowly decrease with time. The positive-negative pair of the magnetic features can be recognized as a bipolar moving magnetic feature (MMF, e.g., Harvey & Harvey, 1973). Note that the temporal evolution shown here is rather common in the formation of MMFs and another example can be found in Kubo et al. (2007a). The positive magnetic patch with strong downflow exists in an inter-granular lane at the front edge of a granule which gradually expands outward from the penumbral side. The series of G-band images show that a bright compact feature starts to appear and brighten from t= 270s and another bright feature from t= 539s near the tip of the dark filamentary structure and it seems to be pushed by an expanding granule. Moreover, Ca II H images show a transient brightening at the location of downflow events. As clearly seen in the second event marked with circles, a small patchy bright feature appears at the same time as the downflow event (t= 539s) and fades after t= 876s. This signature is clearly different from longer-lived enhanced Ca II H emission seen in strong flux concentrations.
This example clearly shows that high-speed downflows are excited at the extension from Evershed flow channels in the penumbra, resulting in a vertically oriented magnetic field, well known as an MMF. Simultaneously, transient heating occurs in the chromospheric layer, which may mean that the magnetic field of the newly appeared positive-polarity field expanded and reached the chromosphere. Also, it might be indirect evidence of heating due to shocks formed by supersonic downflows.
Figure 5 shows the temporal evolution of full Stokes profiles at the location of the second large downflow event. The Stokes profiles correspond to the center of the downflowing structure defined by the center of the 1.0-arcsec-radius circles in Figure 4. For the profiles before and after the downflow event, we traced the magnetic signature observed in G-band and magnetic flux images. Before t= 270s, the position is unchanged from the last identified position, because it is difficult to trace the magnetic signature. The third lobe starts to appear in Stokes V from t= 472s and is well observed until t= 741s. The profile of Fe I 630.15nm at t= 809s still shows a conspicuous third lobe. The high-speed downflow forming the third lobe reaches 9.2 km s-1 at t= 674s, derived from the wavelength of a zero-crossing formed with the third lobe. The red and blue wing amplitude of antisymmetric Stokes V profile decreases during the period when the third lobe is observed and a Stokes V signal with the opposite polarity amplitude appears by the end of the sequence, indicating that the line-of-sight magnetic polarity of the main magnetic field component is completely replaced with the opposite polarity magnetic field formed with the excitation of high-speed downflow. The linear polarization (Stokes Q and U) signals shows that the inclined magnetic field evolves to almost vertically oriented field when the high-speed downflow is well observed (t= 607 - 741s). An inversion based on the Milne-Eddington model approximation gives an inclination of the magnetic field of 114 deg with strength of 809 gauss at t= 0s, where the field inclination of 90 deg is defined as horizontal. At t= 944s, the magnetic field evolves to 1975 gauss with an inclination of 50 deg.
4.2 High-speed downflows at sunspot umbral edge
Figure 6 shows the temporal evolution of typical downflow events observed at the sunspot umbral boundary. Note that the events are located near the lower edge of the Stokes observing region. Three high-speed downflow events are detected in this area; one bright event is observed in the upper left of the frames (just outside the circles) over t= 270 - 472s, the second event is at the left side of the circles over t= 203 - 809s, and the third bright event starts to brighten from around t= 472s, and is marked by circles with a radius of 1.0 arcsec. These high-speed downflow events are located at the boundary between the dark umbral region and bright granules, which can be identified by the contours. Radial outflows, the well-known sunspot moat flows, are not seen at umbral edges without penumbra, as shown in Vargas Domíngues et al. (2007). The size of nearby granules appearing beside the umbral edge is much smaller than those seen in the quiet Sun, which is reflected by the distribution of strong magnetic flux not only inside the umbral region but also in the nearby granules. The magnetic flux map shows that strong flux of the umbral region is extended to the nearby granule region. The nearby granules evolve during the time that the high-speed downflows are observed, although no clear correlation between the granule evolution and downflow development is derived from this observation. No clear features are observed in the series of Ca II H images.
Figure 7 is the temporal evolution of the full Stokes profiles at the location of the third downflow event. The profiles are for the center of the 1.0-arcsec-radius circles in Figure 6. Before the downflow event, the position is unchanged from the position identified at t= 472s, because it is impossible to trace the magnetic signature. The antisymmetric Stokes V profile with two lobes does not show significant changes during the period, but an elongated signal toward the longer wavelength appears from t= 405s. The Fe I 630.15 nm line shows that the elongated signal can be identified as the third lobe in t= 539 to 741s frames. The scale of the vertical axis in Stokes V is 4 times larger than in Stokes Q and U, meaning that the magnetic field has almost a vertical orientation. The Milne-Eddington inversion for the profiles at t= 944s gives a 156 deg inclination for a 1685 gauss magnetic field.
4.3 High-speed downflows at moat and quiet regions
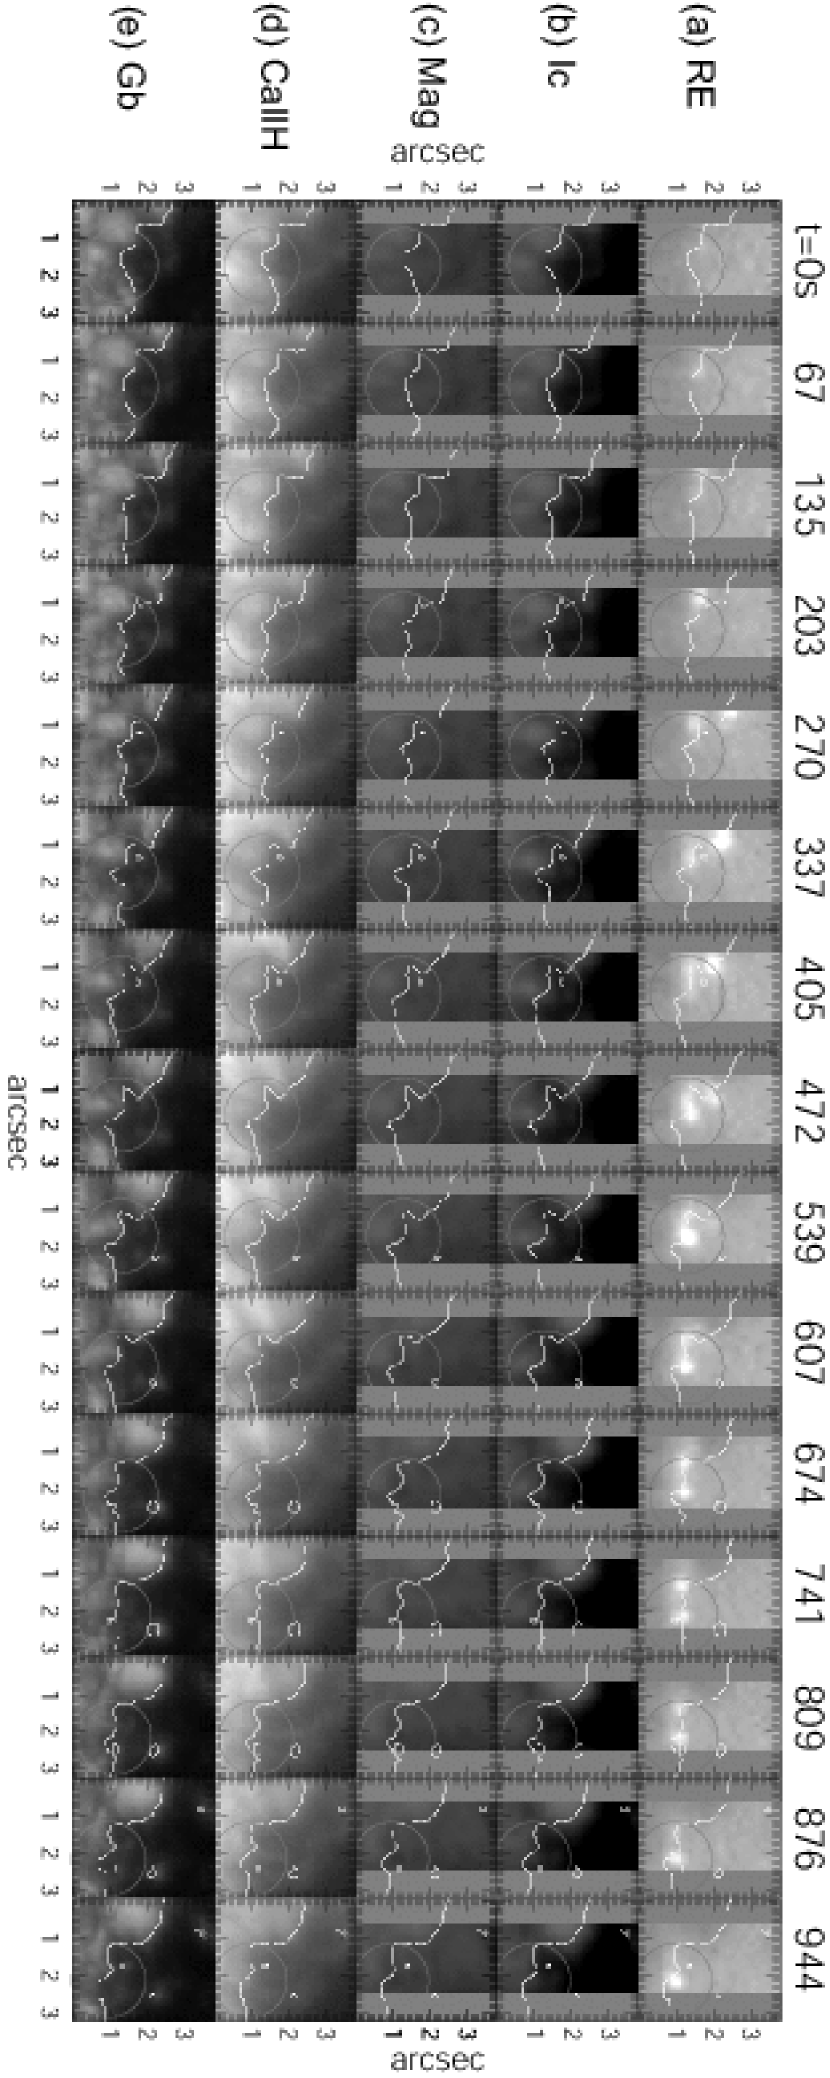
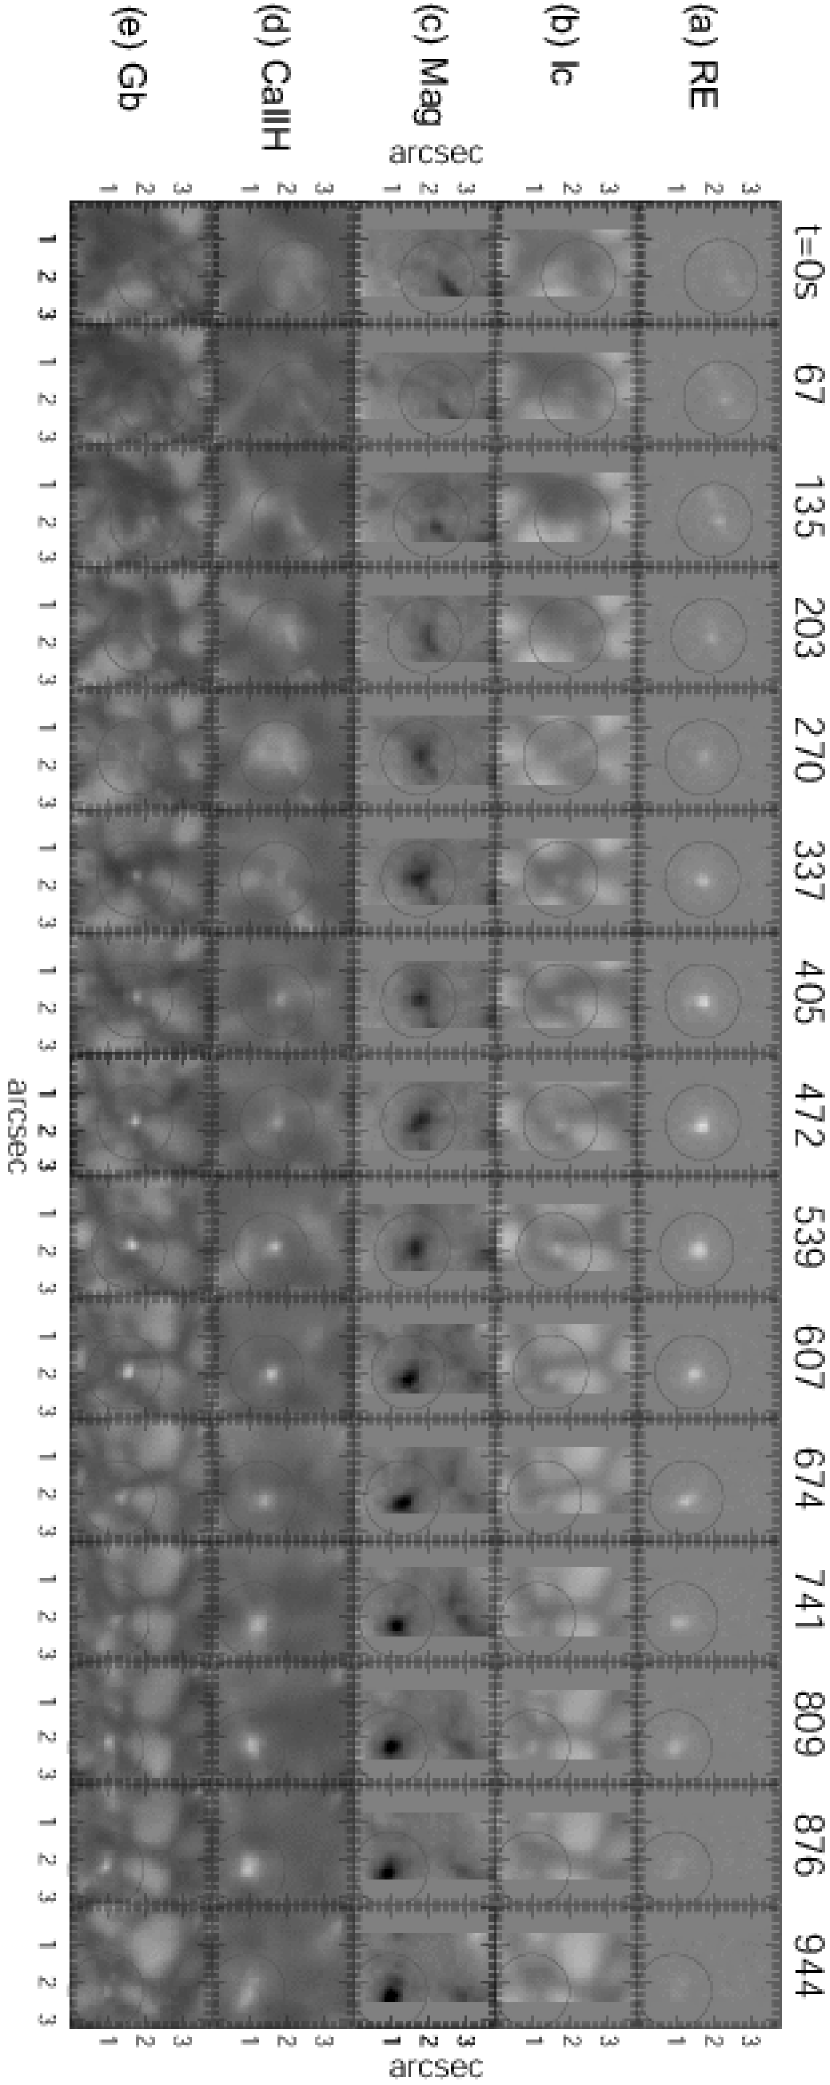
Figure 8 shows the temporal evolution of one typical downflow event observed in the quiet region far from the sunspot. The downflow signal is observed in a weakly concentrated negative-polarity patch, which is located in an inter-granular lane. It seems that the negative-polarity patch is rather diffuse, about 1 arcsec in size at t = 203 s, and it developes to form a concentrated magnetic flux less than 0.5 arcsec in size. When the concentrated magnetic flux appears in longitudinal magnetogram (after t= 337s), the signal excess at the red wing is well observed, followed by the disappearance of the signal excess (t= 876s). The series of G-band images show that a bright point (GBP, e.g., Berger & Title, 1996) is newly formed after t= 337 s at the exact location of the signal excess and magnetic flux concentration. The size of GBPs is 0.3 arcsec in diameter. Immediately after starting the excitation of a high-speed downflow, a point-like transient brightening is observed in Ca II H images (after t= 405s). After the downflow signal disappears, the chromospheric brightening signature in Ca II H also fades out (t= 944s).
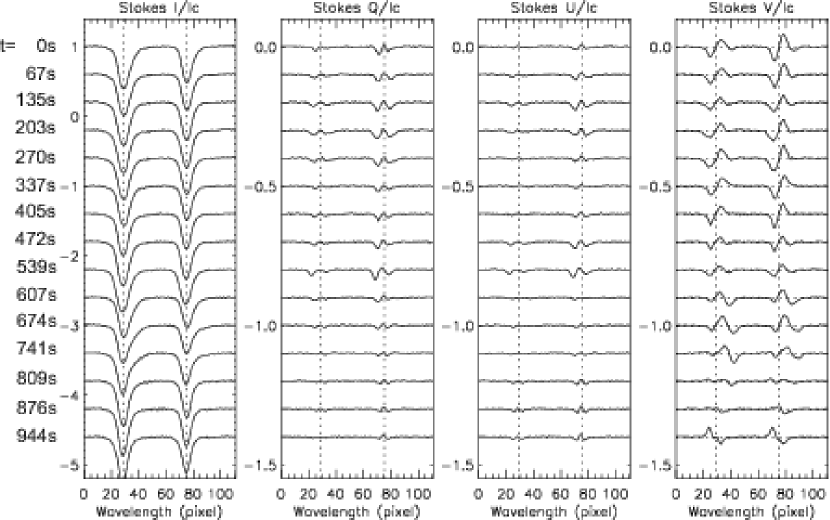
The temporal evolution of full Stokes profiles at the centers of the 1.0-arcsec-radius circles are given in Figure 9. No apparent signal is seen in Stokes Q and U above the noise level, meaning that the magnetic field is vertically oriented. The third lobe is well seen for more than 10 minutes from the 2nd profile (t= 67s), especially in the Fe I 630.15 nm line, whose line core is formed slightly higher than that of Fe I 630.25 nm line in the solar atmosphere. Since the third lobe has the same polarity as the red wing lobe of the usual, antisymmetric Stokes V profile, the third lobe does not make the second zero-crossing. But the Stokes V profile of Fe I 630.15 nm line at t= 539s shows a zero-crossing by the third lobe, giving 7.8 km s-1 (164mÅ from the line center), which is supersonic. The blue wing amplitude of the antisymmetric Stokes V profiles shows a gradual growth as a function of time, suggesting the increase of either (or both) magnetic field strength or magnetic filling factor (how much area is occupied by the magnetic field). Actually, the Milne-Eddington inversion gives that the intrinsic magnetic field strength changes from 479 gauss (t= 0s) to 1514 gauss (t= 944s) and the magnetic filling factor from 0.22 (t= 0s) to 0.35 (t= 944s).
5 Discussions
5.1 High-speed downflows associated with formation of MMFs
It was shown that the excitation of high-speed downflows is observed outside the sunspot penumbra when a magnetic flux patch with a polarity opposite to the sunspot is newly formed. Such patches may be identified as one polarity patch of a MMF. MMFs sometimes have bipolar magnetic structures and stream away from near the outer boundary of the penumbra of well-developed sunspots (Zhang et al., 2003; Hagenaar & Shine, 2005; Cabrera Solana et al., 2006; Kubo et al., 2007b). This observation suggests that bipolar MMFs may be effectively developed and formed in association with the excitation of high-speed downflows in a magnetic tube. An outward directed flow, Evershed flow, is well observed in the sunspot penumbra, and downflows are observed at some locations at the outer edge of the penumbra, returning the mass flux below the photosphere (Westendorp Plaza et al., 1997; Schlichenmaier & Collados, 2002; Bellot Rubio et al., 2004; Borrero et al., 2006; Beck, 2008). The Evershed flows along individual channels are transient with a timescale of the order of 10-15 minutes (Shine et al., 1994; Rimmele, 1994), and some of the downflows can evolve to supersonic flows at the photospheric layer (del Tor Iniesta et al., 2001; Bellot Rubio et al., 2004). The observed high-speed downflows are predominantly located around the outer edge of the penumbra and its extension to the moat flow area. Closely related to downward magnetic pumping (Thomas et al., 2002), pairs of magnetic features may be more effectively developed by downward kinks formed by a high-speed downflow.
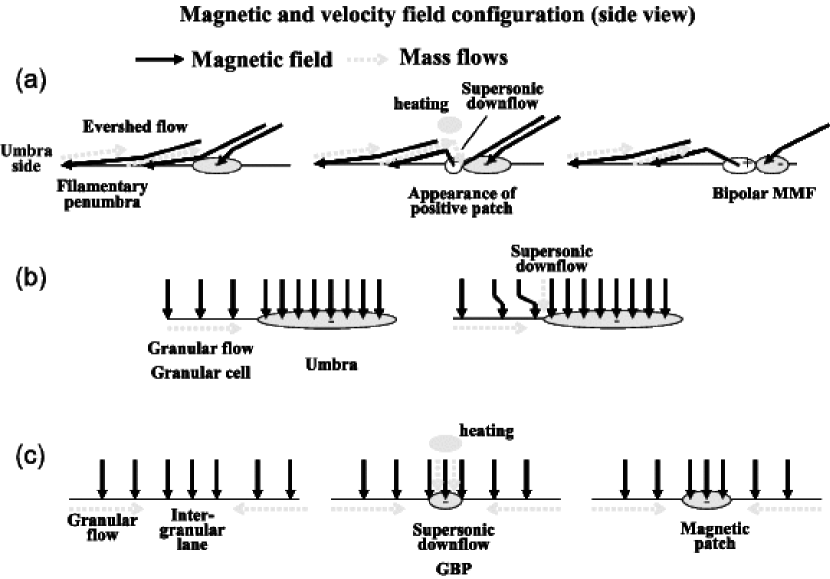
Before the excitation of a high-speed downflow, there is an inclined magnetic field in the moat region, which is partially an extension from nearly horizontal penumbral structures of sunspots. Transient Evershed flow gas along the penumbral horizontal field may continue to flow along the inclined magnetic field located just outside the penumbral boundary. A bulk of gas supplied to a small height above the photosphere by a transient Evershed flow may start to drop into the photosphere along magnetic fields due to gravitational force. Such a bulk flow may reform a part of magnetic field to a more vertical oriented configuration and the gas may undergo a free fall, resulting in accelerating to high speed. At this time, a complicated Stokes V profile with three lobes is observed; The observed spectral profiles can be interpreted with two magnetic components existing within 0.3 arcsec resolution or with two magnetic components existing along the line of sight in the thin layer of the line formations, as shown in Figure 10a. The main component is a pre-existing inclined magnetic field with no strong mass motions, which represents the global structure of the magnetic field at the outer area of penumbra. Moreover, because of the highly red-shifted nature of the third lobe, a limited portion of magnetic field carries a high-speed downflow forming a vertical field orientation. The downward mass motion continuing for roughly 5 minutes reforms the magnetic field into more vertically-oriented magnetic field in the opposite direction of the spot. After ending the high-speed downflow, the opposite-directed vertically-reformed magnetic field may go on to form a strong concentrated flux, as described in section 5.3.
5.2 High-speed downflows associated with convection in strong magnetic fields
High-speed downflows are sometimes observed at the edge of sunspot umbra without accompanying penumbral structures. Also, similar downflows are observed at the edge of pores, which are small concentration of magnetic flux without horizontally oriented penumbral structures. An expanding granular cell with significant magnetic flux is located beside the umbra. High-speed downflows are observed at the interface between the umbra and the granular cell. A significant circular polarization signal is emitted from the granular cell, indicating vertically oriented magnetic flux. The development of a granular cell may force magnetic fields to sweep toward the umbral boundary, which may trigger the interaction of the sweeping field with well-concentrated magnetic flux in the umbra (Figure 10b). One possible interaction is a magnetic reconnection between them. To form a discontinuity between the magnetic fields, the sweeping field needs to be inclined to the magnetic field inside the umbra. As a result of magnetic reconnection in the photosphere or lower chromosphere, a reconnection outflow directed toward the surface may be observed as supersonic mass motions. However, it is a puzzle why strong upward motions are not observed. The other possible interaction is that the physical process described in section 5.3 are excited when the sweeping magnetic field is merged to the pre-existing umbral field with kilo gauss strength.
5.3 High-speed downflows at quiet and moat regions
The example shown in Figure 8 and 9 clearly shows that high-speed downflows are excited in the vertically-oriented magnetic field area during the formation of a small concentrated magnetic flux patch, which can also be seen as a bright point in G-band. This observation is consistent with previous observations reporting on supersonic downflows at the magnetic elements amplified by flux expulsion and convective collapse (Sigwarth et al., 1999; Bellot Rubio et al., 2001; Socas-Navarro & Manso Sainz., 2005). Convective collapse is theoretically introduced as a mechanism for concentrating magnetic fields into thin (km, or 0.1-0.2 arcsec in diameter) but strong (kilo gauss) flux tubes (Parker, 1978; Spruit & Zweibel, 1979). It is predicted in the theory that a downward flow can be excited due to convective instability developed by radiative cooling inside the flux tube with decreasing heat input from ambient atmosphere across magnetic field lines. The high-speed downflow leads to a partial evacuation of the gas and therefore a concentration of the magnetic flux with increasing magnetic field strength (Figure 10c). This paper is mainly focused on the mass motions inside the concentrated magnetic flux patch observed in full Stokes profiles. Careful multicomponent inversions of these Stokes spectra will be required for precise determinations of the physical properties inside the flux tubes with high speed mass flows. It should be noted that another example from a Hinode spectro-polarimetric observation is recently examined with an inversion technique (Nagata et al., 2008).
The observed high-speed downflows may be more effectively initiated if the gas is drained from the low chromosphere into the photosphere. We have observed flux emerging all the time in quiet areas and plage regions (Centeno et al., 2007; Ishikawa et al., 2008). The emerging flux will carry mass upward, which must flow downward at some point. The upward motions of the emerging magnetic fields may also constrict magnetic flux tubes so that the gas flows could become high speed in the tubes and the high-speed flows are sustained in the photosphere. Indeed, it is observed that the Stokes V profile is strongly red-shifted at one end of the emerging, horizontal magnetic structure with velocity up to 5 km s-1 (Ishikawa et al., 2008).
Almost simultaneously with the excitation of a high-speed downflow, a point-like transient brightening is also observed at the exact location of the high-speed downflow with the Ca II H filter. The Ca II H filter has a response function with an average response height of 247 km above the photospheric level and a long tail extending into the middle chromosphere (Carlsson et al., 2007). Transient Ca II H brightenings can be interpreted by various kinds of mechanisms including mechanisms discussed below. One interpretation is that the Ca II H brightening is a signature of transient heating of the chromospheric gas either by a heat source located in the chromosphere or energy transfer from the photosphere through magnetic fields. Another interpretation is that the observed Ca II H brightening is due to decreasing the line absorption with reduced opacity of the gas. This may be caused by a strong evacuation inside the magnetic flux tube at chromospheric layer, if the high-speed downflows observed at the photosphere extends to the chromosphere during the formation of the kG flux tubes.
The first interpretation, transient heating in the upper atmospheric layer, is also suggested by an observation of red-shifted events observed at the outer moat region using full Stokes measurements of infrared photospheric Si I 10827 Å line with Tenerife Infrared Spectro-Polarimeter (Shimizu et al., 2007). The physical conditions of the red-shifted component derived with SIR (Stokes Inversion based on Response functions) inversion show that the downflowing component has a relative downward motion as large as 10 km s-1 with a vertical orientation of the magnetic field and that the temperature of the downflowing component seems to be 400-500 K higher than that of the stationary component. These observations suggest that a magnetic reconnection occurring in the upper atmospheric layer excites a supersonic downflow (Shimizu et al., 2007), although a slight delay was observed in Ca II H brightening compared with the excitation of a high-speed downflow. Note that a supersonic downflow is also reported at the location of chromospheric Ellerman bombs (Socas-Navarro et al., 2006), which may be a magnetic reconnection at the chromosphere.
As an alternate mechanism, a shock front formed by a supersonic downflowing motion inside a magnetic flux tube may play a key role in determining the further dynamical evolution of the concentrating magnetic flux (Takeuchi, 1999). According to this simulation, the shock formation is restricted within the most unstable portion of the examined parameter range. A strong downflow rebounds in the deeper layers and the resulting upward mass motion leads to a shock wave penetrating from the photosphere to the chromosphere, which may be observed a weak blue-shift signal in Stokes V profiles (Bellot Rubio et al., 2001; Socas-Navarro & Manso Sainz., 2005). The energy deposition in the low chromosphere by the propagating shock waves may be observed as a point-like transient brightening in Ca II H images.
6 Conclusions
The Spectro-Polarimeter provides new precise observations of solar magnetic fields as well as velocity fields at the surface with 0.3 arcsec spatial resolution. It reveals frequent occurrences of high-speed, probably supersonic, downflows in the photospheric layer. We find that the photosphere is full of extremely dynamical small scale structures with high-speed mass motions. High-speed downward mass flows occur not only in association with sunspot magnetic field structures but also in small concentrations of magnetic flux in the quiet sun.
Understanding the sources of high-speed mass downflows needs further observational investigations with Stokes-polarimetric observations by Hinode. However, the temporal evolution of some downflow events shown in this paper suggests a few magnetic circumstances for exciting high-speed mass flows at the photosphere: the extension from Evershed flows in sunspots, interaction between intense magnetic field and nearby convective gas motions, and magnetic elements amplified by flux expulsion and convective collapse. The high-speed downflows observed at the extension from the penumbral filamentary structures are suggested to play an important role in forming MMFs around the sunspot penumbra. High speed flows in a magnetic flux tube may play an role in forming kinks of magnetic field. Associated with high-speed downflows, transient brightenings are also observed in chromospheric Ca II H images. Supersonic mass motions would form shock fronts and generate shock waves in the atmosphere, which can be important in propagating the energy and the heating of plasma.
References
- Beck (2008) Beck, C. 2008, A&A, 480, 825
- Bellot Rubio et al. (2001) Bellot Rubio, L.R., Hidalgo, I.R., Collados, M., Khomenko, E., & Ruiz Cobo, B. 2001, ApJ, 560, 1010
- Bellot Rubio et al. (2004) Bellot Rubio, L.R., Balthasar, H., & Collados, M. 2004, A&A, 427, 319
- Bellot Rubio et al. (2006) Bellot Rubio, L.R., Schlichenmaier, R., & Tritschler, A. 2006, A&A, 453, 1117
- Berger & Title (1996) Berger, T.E. & Title, A.M. 1996, ApJ, 463, 365
- Borrero et al. (2006) Borrero, J.M., Solanki, S.K., Lagg, A., Socas-Navarro, H., & Lites, B. 2006, A&A, 450, 383
- Cabrera Solana et al. (2006) Cabrera Solana, D., Bellot Rubio, L.R., Beck, C., & del Toro Iniesta, J.C. 2006, ApJ, 649, L41
- Carlsson et al. (2007) Carlsson, M., Hansteen, V.H., De Pontieu, B., et al. 2007, PASJ, 59, S663
- Centeno et al. (2007) Centeno, R., Socas-Navarro, H., Lites, B., et al. 2007, ApJ, 666, L137
- del Tor Iniesta et al. (2001) del Tor Iniesta, J.C., Bellot Rubio, L.R., Collados, M. 2001, ApJ, 549, L39
- Hagenaar & Shine (2005) Hagenaar, H.J., & Shine, R.A. 2005, ApJ, 635, 659
- Harvey & Harvey (1973) Harvey, K. & Harvey, J. 1973, Solar Physics, 28, 61
- Ichimoto et al. (2008) Ichimoto, K. et al. 2008, Solar Physics, submitted
- Ichimoto et al. (2007) Ichimoto, K., Shine, R.A., Lites, B. et al. 2007, PASJ, 59, S593
- Ishikawa et al. (2008) Ishikawa, R., Tsuneta, S., Ichimoto, K. et al. 2008, A&A, in press
- Kosugi et al. (2007) Kosugi, T. et al. 2007, Solar Physics, 243, 3
- Kubo et al. (2007a) Kubo, M., Ichimoto, K., Shimizu, T. et al. 2007a, PASJ, 59, S607
- Kubo et al. (2007b) Kubo, M., Shimizu, T., & Tsuneta, S. 2007b, ApJ, 659, 812
- Lites et al. (1993) Lites, B.W., Elmore, D.F., Seagraves, P., & Skumanich, A.P. 1993, ApJ, 418, 928
- Lites et al. (2002) Lites, B.W., Socas-Navarro, H., Skumanich, A., & Shimizu, T. 2002, ApJ, 575, 1131
- Martínez Pillet et al. (1994) Martínez Pillet, V., Lites, B.W., Skumanich, A., & Degenhardt, D. 1994, ApJ, 425, L113
- Nagata et al. (2008) Nagata, S., Tsuneta, S., Suematsu, Y. et al. 2008, ApJ, in press
- Parker (1978) Parker, E.N. 1978, ApJ, 221, 368
- Rimmele (1994) Rimmele, T.R. 1994, A&A, 290, 972
- Rimmele (1995) Rimmele, T.R. 1995, A&A, 298, 260
- Rouppe van der Voort (2002) Rouppe van der Voort, L.H.M. 2002, A&A, 389, 1020
- Schlichenmaier & Collados (2002) Schlichenmaier, R., Collados, M. 2002, A&A, 381, 668
- Shimizu et al. (2008) Shimizu, T. et al. 2008, Solar Physics, accepted
- Shimizu et al. (2007) Shimizu, T., Martínez-Pillet, V., Collados, M., Ruiz-Cobo, B., Centeno, R., Beck, C., & Katsukawa., Y. 2007, in ASP Conf. Ser. Vol. 369, New Solar Physics with Solar-B Mission, eds., K. Shibata, T, Sakurai, S. Nagata (San Francisco: ASP), 113
- Shine et al. (1994) Shine, R.A., Title, A.M., Tarbell, T.D., Smith, K., & Frank, Z.A. 1994, ApJ, 430, 413
- Sigwarth et al. (1999) Sigwarth, M., Balasubramaniam, K.S., Knölker, M. & Schmidt, W. 1999, A&A, 349, 941
- Sigwarth (2001) Sigwarth, M. 2001, ApJ, 563, 1031
- Socas-Navarro & Manso Sainz. (2005) Socas-Navarro, H. & Manso Sainz, R. 2005, ApJ, 620, L71
- Socas-Navarro et al. (2006) Socas-Navarro, H., Martínez Pillet, V., Elmore, D., Pietarila, A., Lites, B.W., & Manso Sainz, R. 2006, Solar Physics, 235, 75
- Solanki (2003) Solanki, K. 2003, Astron. Astrophys. Rev., 11, 153
- Spruit & Zweibel (1979) Spruit, H.C., Zweibel, E.G. 1979, Solar Physics, 62, 158
- Steiner et al. (1998) Steiner, O., Grossmann-Doerth, U., Knölker, M., & Schussler, M. 1998, ApJ, 495, 468
- Suematsu et al. (2008) Suematsu, Y. et al. 2008, Solar Physics, accepted
- Takeuchi (1999) Takeuchi, A. 1999, ApJ, 522, 518
- Tarbell et al. (2008) Tarbell, T.D. et al. 2008, Solar Physics, submitted
- Title et al. (1993) Title, A., Frank, Z., Shine, R., Tarbell, T., Topka, K., Scharmer, G., & Schmidt, W. 1993, ApJ, 403, 780
- Thomas et al. (2002) Thomas, J.H., Weiss, N.O., Tobias, S.M., & Brummell, N.H. 2002, Nature, 420, 390
- Tsuneta et al. (2008) Tsuneta, S. et al. 2008, Solar Physics, accepted
- Vargas Domíngues et al. (2007) Vargas Domíngues, S., Bonet, J.A., Martínez Pillet, V., Katsukawa, Y., Kitagoshi, Y., & Rouppe van der Voort, L. 2007, ApJ, 660, L165
- Westendorp Plaza et al. (1997) Westendorp Plaza, C., del Toro Iniesta, J.C., Ruiz Cobo, B., Martínez Pillet, V., Lites, B.W., & Skumanich, A. 1997, Nature, 389, 47
- Wiehr (1995) Wiehr, E. 1995, A&A, 298, L17
- Zhang et al. (2003) Zhang, J., Solanki, S.K., & Wang, J. 2003, A&A, 399, 755