Near-infrared integral field spectroscopy of the Homunculus nebula around Carinae using Gemini/cirpass††thanks: Based on observations obtained at the Gemini Observatory, which is operated by the Association of Universities for Research in Astronomy, Inc., under a cooperative agreement with the NSF on behalf of the Gemini partnership: the National Science Foundation (United States), the Particle Physics and Astronomy Research Council (United Kingdom), the National Research Council (Canada), CONICYT (Chile), the Australian Research Council (Australia), CNPq (Brazil) and CONICET (Argentina).
Abstract
This work presents the first integral field spectroscopy of the Homunculus nebula around Carinae in the near-infrared spectral region ( band). We confirmed the presence of a hole on the polar region of each lobe, as indicated by previous near-IR long-slit spectra and mid-IR images. The holes can be described as a cylinder of height (i.e. the thickness of the lobe) and diameter of and cm, respectively. We also mapped the blue-shifted component of He i 10830 seen towards the NW lobe. Contrary to previous works, we suggested that this blue-shifted component is not related to the Paddle but it is indeed in the equatorial disc.
We confirmed the claim of Smith (2005) and showed that the spatial extent of the Little Homunculus matches remarkably well the radio continuum emission at 3 cm, indicating that the Little Homunculus can be regarded as a small H ii region. Therefore, we used the optically-thin 1.3 mm radio flux to derive a lower limit for the number of Lyman-continuum photons of the central source in Car. In the context of a binary system, and assuming that the ionising flux comes entirely from the hot companion star, the lower limit for its spectral type and luminosity class ranges from O5.5 iii to O7 i. Moreover, we showed that the radio peak at 1.7 arcsec NW from the central star is in the same line-of-sight of the ‘Sr-filament’ but they are obviously spatially separated, while the blue-shifted component of He i10830 may be related to the radio peak and can be explained by the ultraviolet radiation from the companion star.
keywords:
stars: general – stars: individual: Carinae – circumstellar matter – reflection nebulae1 Introduction
The Homunculus nebula around the massive luminous blue variable Carinae is the result of an eruptive mass-loss event that took place around 1843, throwing out more than 10 M⊙ in a bipolar outflow (Morse et al., 2001; Gaviola, 1950; Ringuelet, 1958; Currie et al., 1996; Smith & Gehrz, 1998; Smith et al., 1998; Smith et al., 2003; Smith, 2006). Hillier & Allen (1992) suggested that the lobes of the Homunculus are essentially hollow shells with most of the mass concentrated in two polar caps and thin side walls (see also Davidson et al. 2001; Smith 2002; Meaburn et al. 1993). In addition, a ragged equatorial disc also formed, which makes the Homunculus unique among bipolar nebulae (Duschl et al., 1995). The Homunculus shows a complex mottled surface with lanes of dust condensation and holes in the lobes (Morse et al., 1998). Although the Homunculus is mainly a reflection nebula, it also has associated intrinsic emission lines due to shocks or photo-excitation (Smith, 2005, 2004, 2006, 2002; Davidson et al., 2001; Allen & Hillier, 1991, 1993; Hillier & Allen, 1992). Such studies showed that the observed velocity pattern of a spectral line along the Homunculus can be used to determine the origin of each component of the emission.
Surprisingly, another bipolar structure lying inside the Homunculus was discovered by Ishibashi et al. (2003) using long-slit spectroscopy obtained with the Space Telescope Imaging Spectrograph (STIS) aboard the Hubble Space Telescope (HST). The so-called Little Homunculus was detected in more than 30 optical lines of [Fe ii] and [Ni ii] (such as [Fe ii] 4891, 4907, 4975, and [Ni ii] 7380) as well as in He i and H i lines (Ishibashi et al., 2003), and is particularly bright in the near-IR [Fe ii] lines (Smith, 2002). The proper motion and radial velocities analysis are consistent with the Little Homunculus forming in a smaller mass-ejection event that occurred around 1890 (Ishibashi et al., 2003; Smith, 2005). Smith (2005) estimated an ejected mass and kinetic energy for the Little Homunculus of 0.1–0.2 M⊙ and roughly 1047 erg, respectively – values which are at least two orders of magnitude lower than those for the Great Eruption that created the larger Homunculus (Smith et al., 2003). Although Smith (2005) mapped the basic structure of the Little Homunculus using five slits oriented parallel to the major axis and separated by 1 arcsec, the spatial distribution of the Little Homunculus with a higher angular resolution in the near-infrared has not been done so far.
Car is also surrounded by a broken toroidal ring structure (Smith & Gehrz, 2000; Smith et al., 2002; Morris et al., 1999; Ishibashi et al., 2003), which absorbs part of the ultraviolet radiation, while allowing the rest to escape through holes and excite/ionise the surrounding gas at large distances from the central source (Smith, 2006). An excellent example of this effect is given by the blue-shifted component of the He i 10830 line projected onto the NW lobe (Smith, 2002).
This work presents the results of the first integral-field spectroscopy mapping of the Homunculus nebula. The paper is organized as follows. The observations and data reduction are described in §2. A discussion about the line-formation mechanism throughout the nebula around Carinae is presented in §3, while the results are shown in §4. In §5 is a comparison of the continuum radio-emission and our results as well as our estimates about the properties of the hot-companion star. Finally, our conclusions are summarized in §6.
2 Observations and data reduction
The integral field observations of Car were recorded on 2003 March 14, 15 and 18 at the 8m Gemini South telescope using the visitor instrument CIRPASS111www.ast.cam.ac.uk/optics/cirpass/cirpass_index.html, a spectrograph developed by the Cambridge instrumentation team (Parry et al., 2004). CIRPASS has 490 hexagonal lens placed at the integral field unit with a spatial sampling interval of 0.25 arcsec per lens. It provides a wavelength coverage of 10620–12960, with a resolving power () of 3200.
The observations were originally planned for two epochs, one at the high- (2003 March) and other at the low-excitation state (2003 July) of the 5.5 yr cycle (Damineli, 1996; Damineli et al., 2000). Unfortunately, the observing run during the low excitation state was lost due to poor weather conditions.
The following strategy was adopted to map the whole Homunculus: 2 images were taken at a given position of the nebula, and then the IFU was shifted by 0.88 arcsec along the North–South axis to take the next 2 images. The final dataset comprised 2 images from 44 IFU positions, which corresponds to a final mosaic of 6299 spectra and covers the whole Homunculus.
The data were reduced using standard near-infrared techniques. First, any spurious features were removed by the iraf222iraf – Image Reduction and Analysis Facility – is written and supported by the iraf programming group at the National Optical Astronomy Observatories (NOAO) in Tucson, Arizona. NOAO is operated by the Association of Universities for Research in Astronomy (AURA), Inc. under cooperative agreement with the National Science Foundation/cosmicrays task. After that, the spectra were flat-fielded, and an optimal spectral extraction was performed in order to account for the overlapping wings among neighboring spectra. The wavelength calibration was done using an argon lamp spectra and a polynomial interpolation (RMS Å). The telluric lines were removed dividing the Homunculus spectra by the spectrum of a hot early-type star observed just after the science observation. The photospheric lines of the telluric standard was removed previously through an interpolation of the adjacent continuum. The FWHM of the point-spread function of our data is 0.4 arcsec, which was measured using the intensity profile of the standard star. Finally, a full data cube was constructed from the individual spectra using our own tasks written in idl. The signal-to-noise ratio (S/N) is quite variable along the entire mosaic: within the region where the Homunculus nebula is located, the average S/N in the continuum is , while throughout the outer ejecta it is roughly 10.
3 Mechanisms of excitation and/or ionization in the circumstellar ejecta of Car
In this paper, we focus on two emission lines found throughout the Homunculus, namely, [Fe ii] 12567 and He i 10830. As usual in the spectra of the Homunculus, these lines show many components of intrinsic and reflected emission, which can be used to map the spatial distribution of structures lying inside or outside the Homunculus. Hence, it is very important to know about the mechanisms of line-formation in order to better understand the physical conditions of the emitting and reflecting regions.
In this section we will discuss about the process of line-formation inside and outside the Homunculus nebula. We must stress that throughout this paper, we refer to ‘photo-excitation’ as the process by which a photon of the radiation field is absorbed by an atom or ion of the gas with the promotion of one electron to a higher energy level without ionization (bound-bound transition). If the incident photon has an energy greater than the ionization potential of the atom or ion, then one electron will be stripped out of it. This process is called ‘photo-ionization’ and is responsible for bound-free transitions.
On the other hand, if the gas is hot enough to keep most of the atoms ionized, as usually found around massive stars, then the electronic density will be high and probably the electrons will collide with the ions and excite their electron to an upper level (more energetic). This process is called ‘collisional-excitation’ or ‘collisional-ionization’, depending on the capability of the incident electron in removing or not one electron from the target ion.
The return of the electron to the ground state of the ion – known as recombination – will be followed by the emission of many photons with different energy, which gives rise to the emission-line spectrum of some stars.
3.1 The Homunculus nebula
Many studies have shown that in the lobes of the Homunculus nebula, photo-excitation is the predominant mechanism for populating the atomic levels of the ions (Gull et al., 2005; Verner et al., 2005; Smith, 2006). This is because the strong stellar radiation is absorbed by dust in the nebula which, in turn, is heated to a few hundreds degrees Kelvin and starts to emit a reprocessed radiation field responsible for keeping the observed ionization structure inside the walls (Smith & Ferland, 2007). However, this is not ionizing radiation since the central source has a dense stellar wind which absorbs nearly all of the Lyman-continuum photons. The few photons that escape the stellar wind are absorbed either by the toroidal structure at the equator or by the Little Homunculus, which causes strong variability in the radio continuum (Duncan et al., 1997).
On the other hand, the stellar wind shows a latitude-dependent profile, being more dense and fast in the polar regions than in the equatorial region (Smith et al., 2003). The expansion velocity of the Homunculus is about 600 km s-1 while the stellar wind reaches terminal velocities in the range of 600 to 1000 km s-1. Thus, inside the lobes it is expected to detect collisionally-excited emission lines as well. Indeed, the strength of IR [Fe ii] and H2 lines in the NW lobe relative to SE suggest that there is a combination of slow shocks and photo-excitation inside the lobes. The shocks are needed to explain the observed value 35 for the ratio of [Fe ii] 16435 to Br (Smith & Davidson, 2001), though it should not exceed the threshold velocity either for dissociation of H2 – detected by Smith & Davidson 2001 – or to emit any hard X-ray photon – as noted by Weis et al. 2001. Therefore, the walls of the nebula must be composed of dense, small neutral/molecular knots or clumps (Morse et al., 1998) so that the fast bi-polar wind could escape into the outer ejecta without strong interaction with the Homunculus (similar to the well-known Rayleigh-Taylor instabilities).
Therefore, in the lobes of the Homunculus nebula, there is a competition between photo-excitation and collisions as the main line-formation mechanism, the former being the most significant excitation/ionisation process.
3.2 The equatorial region
In the equatorial region, however, the stellar wind is slower than in the polar regions. It also presents a lower density and consequently, the emission due to collisions is weak. Therefore, the equatorial region is largely dominated by photo-excitation. This is because of both the proximity to the central source and the high ionization flux from the equatorial region of the central star (Smith et al., 2003). The presence of a torus around the system is revealed by narrow-band IR images and confirmed at radio wavelengths (Smith et al., 1998; Duncan et al., 1997) as well as in emission lines. Nevertheless, this structure is not continuous but shows either dense clumps (where low-ionization ions are detected) and holes (through where radiation can escape). Examples of these structures are the so-called ‘Sr-filament’ (Zethson et al., 1999; Gull et al., 2000, 2001; Zethson et al., 2001; Bautista et al., 2002; Hartman et al., 2004; Bautista et al., 2006) and the He i 10830 emission columns (Smith et al., 2002).
3.3 The outer ejecta
The picture drastically changes when considering the line-formation process outside the Homunculus nebula, namely, in the outer ejecta. This region is nitrogen-rich (Smith & Morse, 2004) and responsible for practically all of the observed X-ray flux up to 1.5 keV, which implies shock velocities in excess of 1500 km s-1(Weis et al., 2004). These shocks are sufficient to excite (and even ionize) ions to higher energy levels than those observed in the Homunculus. This is supported by the observation of N vi/vii, Si xiii/xiv, Mg xii in the X-ray part of a thermal-emission spectrum and strong N ii, [Oiii], [S iii] and Si ii and many other lines of high-ionization energy ions in the optical range (Smith et al., 2004; Weis et al., 2004; Hamaguchi et al., 2007).
Thus, throughout the Homunculus nebula the process of line-formation is mainly via photo-excitation with a little contribution from slow shocks inside the lobes at high stellar latitudes, while in the outer ejecta the predominant process is excitation/ionisation via collisions, with little contribution from photo-excitation.
4 Results: -band spatial maps of the nebula around Car
4.1 Structures in the [Fe ii] 12567 line
This section presents the spatial structure and kinematics of the photo-excited regions found in the Homunculus. For the first time, a complete spatial map of such photo-excited regions is presented in the near-infrared. Although velocity maps were already made using forbidden lines in the optical with higher spatial resolution using HST (Ishibashi et al., 2003), the use of the near-infrared region in this work allows the observer to peer through the circumstellar dust and probe the environment around Car.
Extensive work has been done in the near-infrared by N. Smith (Smith, 2002, 2004, 2005, 2006) to establish the overall kinematics of the regions around Car, in special the Little Homunculus (Smith, 2005). However, a complete spatial map has not been done so far in near-infrared. The IFU observations presented here should therefore be interpreted as complementary information to what has been presented by previous works using long-slit spectroscopy.
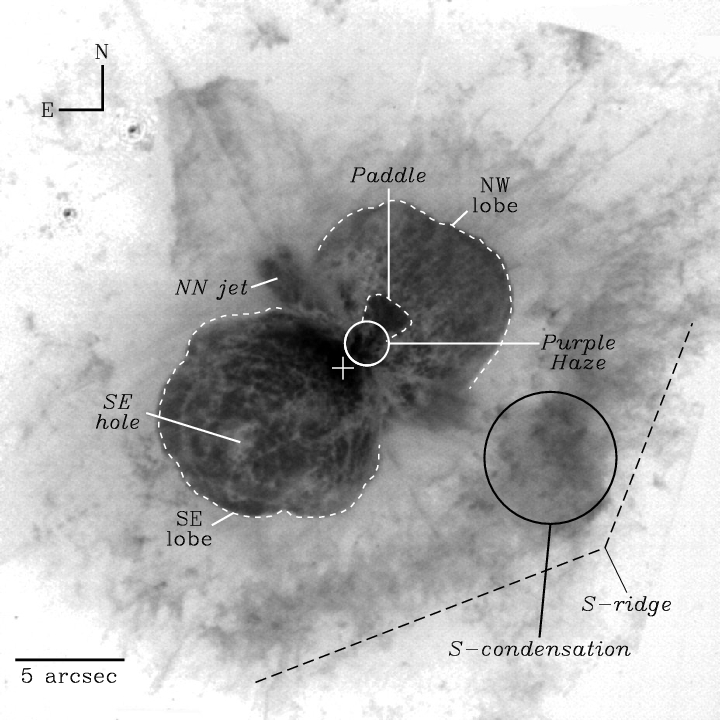
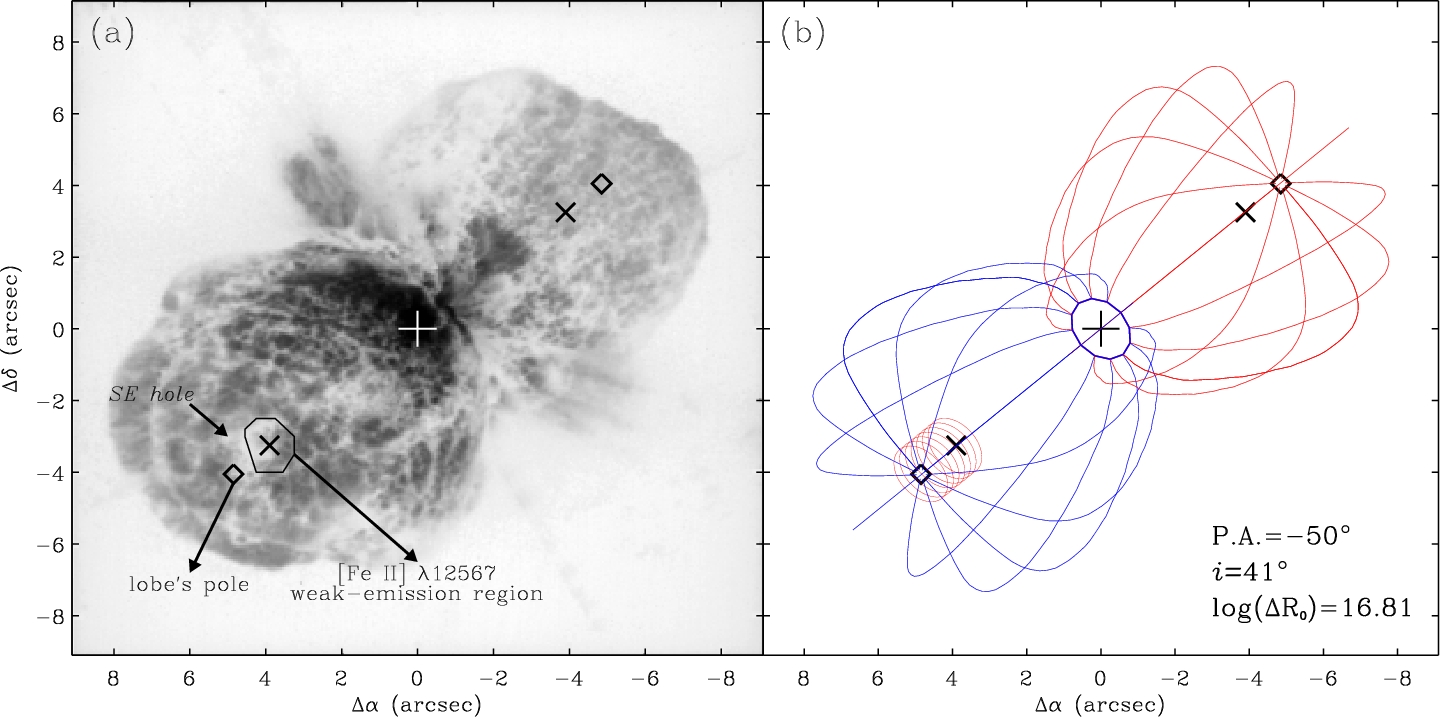
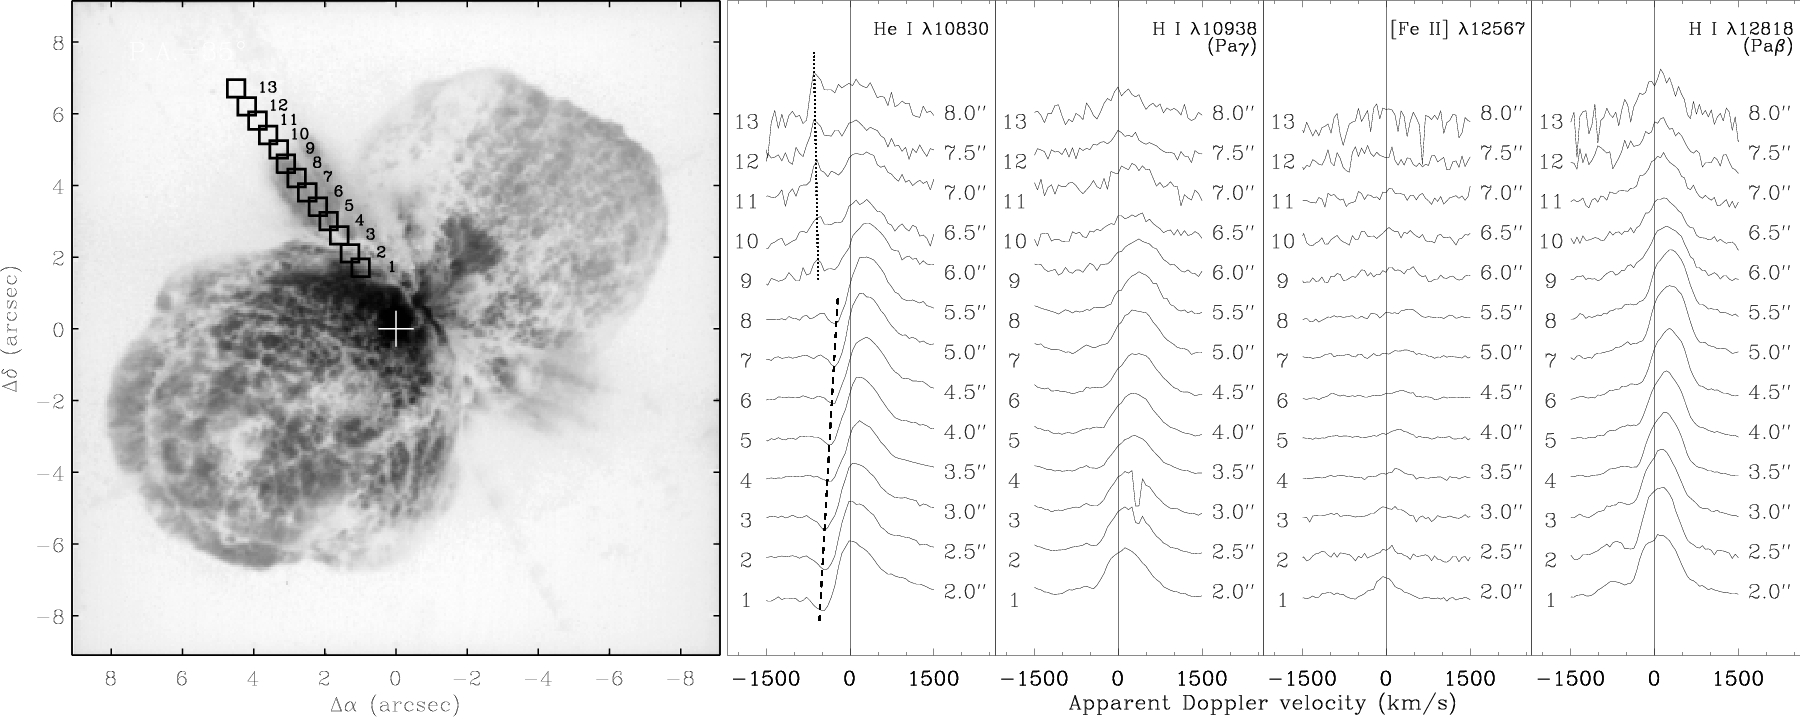
Fig. 1 is an image of the circumstellar environment of Car obtained with the Planetary Camera of the Wide Field Planetary Camera 2 (WFPC2) on board the HST. It is a negative of the image shown in fig. 3 of Morse et al. (1998), reproduced by permission of the AAS. This image is referred to throughout this paper for the location and standard nomenclature of specific regions in the ejecta of Car.
4.1.1 Identifying line components in the Homunculus spectrum
We used the kinematic model of the Homunculus proposed by Davidson et al. (2001) to identify reflected and intrinsic emission components. This model was built using long slit observations of forbidden spectral lines in the optical, mapping the emission coming from inside the Homunculus with spatial and spectral resolution of 0.1 arcsec and km s-1, respectively. Thus, as a first approximation, the Davidson et al. (2001) model is accurate enough (for our objectives) to classify the observed components of a given line as intrinsic or reflected.
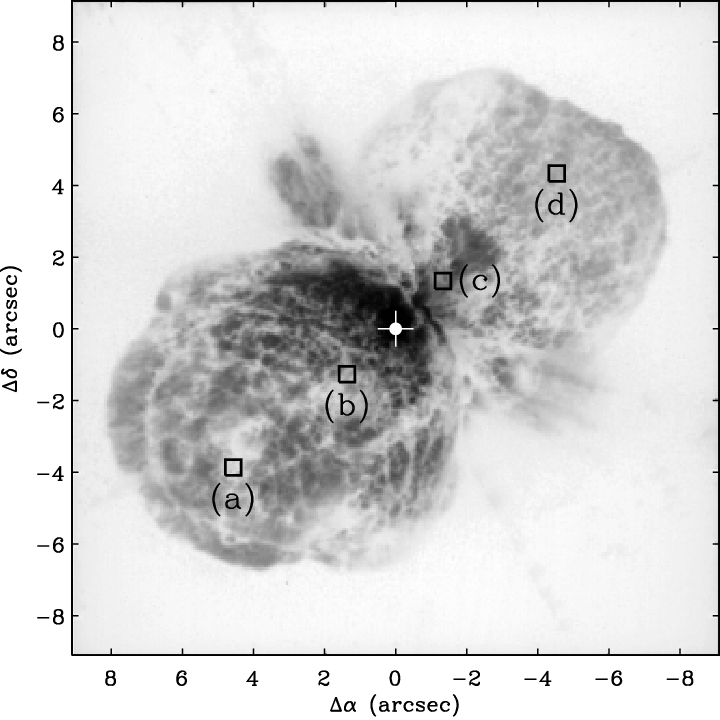
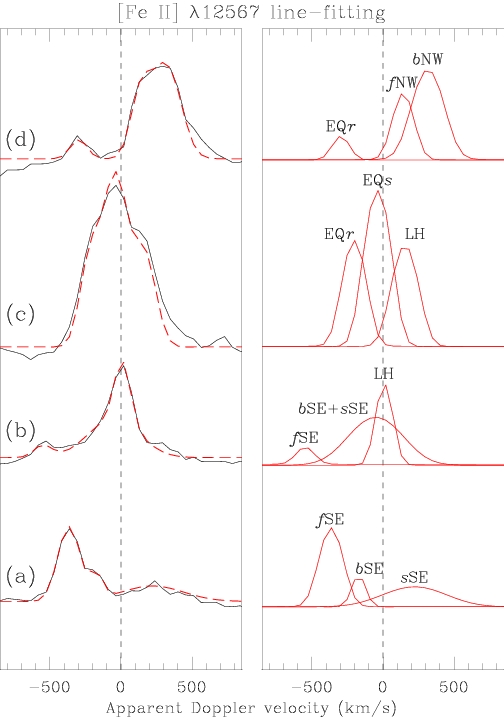
Typical spectra from the Homunculus are presented in Fig. 2. The adopted abbreviations are as follows: () means intrinsic emission coming from the front (back) wall of the SE or NW lobe and means scattered emission reflected in the SE or NW lobe. As usual, we refer to () wall as the near (far) side of each lobe of the Homunculus. Emission associated with the equatorial ejecta is labelled as either EQ or EQ, where , in this case, means slow- and , rapid-moving gas.
We identified all of the [Fe ii] 12567 components in order to map the emission structures of the Homunculus. The Doppler velocity of each component mentioned hereafter is heliocentric and was obtained by a multi-gaussian line fitting procedure. The components are as follows:
-
•
SE ( km s-1) is an intrinsic emission due to Balmer excitation to an upper level followed by recombination to a lower level (bound-bound transition) or recombination of Fe++ to Fe+ (free-bound transition) inside the SE lobe;
-
•
SE ( km s-1) is intrinsic emission coming from the back wall of the SE lobe and is due to recombination of Fe++ to Fe+ as well;
-
•
SE ( km s-1) is emission from the stellar wind scattered in the front wall of the SE lobe;
-
•
EQ ( km s-1) is due to intrinsic emission from slow-moving material located in the equatorial plane, which intercepts our line-of-sight towards the NW lobe. This component was also detected in [Ni II] 7380 by Davidson et al. (2001) and in many low-ionization emission lines such as [Mn ii], [Cr ii] and [Ti ii]. It is due to the ‘Sr-filament’ discussed in § 5.1;
-
•
EQ ( km s-1) is due to equatorial ejecta illuminated directly by ionizing radiation from the central source. This component comes from a region known by its strong continuum radio emission and variability. We will discuss this feature in § 5.1;
-
•
NW ( km s-1) is an intrinsic emission associated with the near wall of the NW lobe. It is due to the same mechanism as SE;
-
•
NW ( km s-1) is also intrinsic emission related to recombination at the polar region of the NW lobe;
-
•
LH is emission associated with the Little Homunculus.
4.1.2 The hole at the pole of lobes
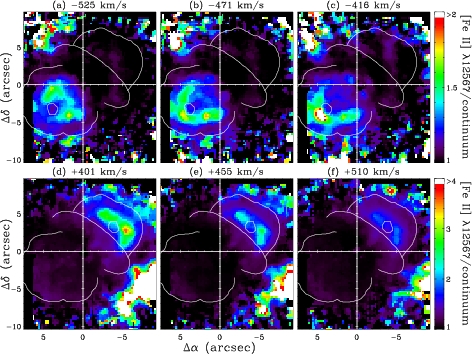
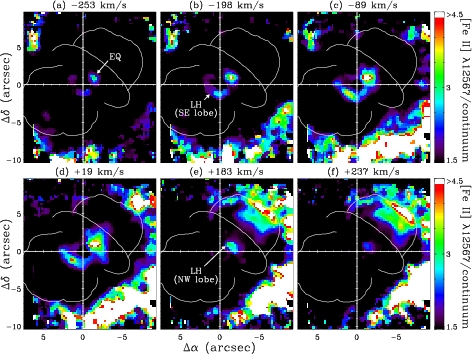
We detected two regions where emission due to recombinant Fe++ is nearly absent. These regions can be seen in Fig. 3, which shows velocity maps of [Fe ii] 12567 from km s-1 to km s-1. On both lobes, a small polar region with extremely reduced emission in this line can be identified (circular contour in each lobe in Fig. 3). The flux from these holes are typically per cent lower than its immediate surroundings. Moreover, such deficit of [Fe ii] and H2 emission at these locations was also reported by Smith et al. (1998) and Smith (2006).
It is tempting to associate the hole seen in the [Fe ii] 12567 velocity maps with the structure known as SE hole (see Fig. 1), observed in optical and near-infrared wavelengths (Smith et al., 1998). To investigate that hypothesis, we compared the relative position between the SE hole and the SE region with low emission of [Fe ii] 12567. Besides, we also compared the position of those regions with the location of the lobe’s pole333By the word ‘pole’ we mean to say the location in the lobe where the stellar latitude is . Obviously, this position is model-dependent.. To do so, we assumed the kinematic model of the Homunculus of Smith (2006), which was obtained by tracing the H2 emission along the nebula and gives a more accurate position for the location of the pole.
Our results give strong support to the idea that there indeed is a hole at the pole of each lobe. The facts that led us to this conclusion are mainly two:
-
•
the location of the SE region with lower emission of [Fe ii] 12567 does not match neither the position of the SE hole nor the pole of the lobe. Instead, they are shifted from one another by arcsec along the major axis of the Homunculus, i.e. the SE hole is half-way between the pole of the lobe and the region with weak emission of [Fe ii] 12567. Hence, the lack of Fe+ emission is not associated with either the SE hole or the pole.
-
•
the absence of thermal infrared emission from dust reported by Smith et al. (1998) is also a strong indication that those polar holes are indeed lower-density regions, and not shadows.
[Fe ii]12567 is most likely to arise from a warm, low-density region inside the lobe because when the stellar radiation field penetrates the wall of the lobes – which has a hydrogen density of about cm-3 – it gets more attenuated and then Fe+ recombines to Fe0 and we see no more emission from Fe ii (Smith & Ferland, 2007). Thus, the spatial distribution of this line represents the emission coming from the inner part of the lobes. Together with the fact that molecular hydrogen emission comes from a region of the lobe that is shielded from strong radiation – i.e. just outside it –, we could get a rough estimate of the lobes’ thickness.
A first approximation of the geometry of the hole is to consider it as a cylinder with linear diameter444To conversion between apparent and linear size, we adopted a distance of 2.25 kpc to Car (Davidson et al., 2001). d – the diameter of the [Fe ii] non-emitting region – and height R0 – the distance between the SE pole of the Homunculus and the [Fe ii] non-emitting region. Hence, considering an inclination angle of i=41°from the line-of-sight (Davidson et al., 2001; Smith, 2006), we obtained for the height and diameter of the cylinder, respectively, a linear size of and cm. The errors quoted here are due only to our uncertainty in position and do not include the uncertainty in distance, which is in the range of 0.1– cm for most studies (Davidson et al., 2001; Smith, 2006).
The right panel of Fig. 4 shows the adopted model for the height and radius of the hole in the lobes of the Homunculus. The coordinates of the non-emitting region in the NW lobe were obtained by considering the position of the same region in the SE lobe, mirrored relatively to the central star by 180°.
We also estimated the thickness of the lobes at lower latitudes by measuring the ‘limb-darkening’ profile seen in our velocity maps (cf. Fig. 3). Indeed, there is a clear separation between the [Fe ii]12567 emission and the optical limit of the Homunculus’ lobes because of the high-density medium inside the wall of the lobes. The observed mean separation in both lobes is 1.3 arcsec, which corresponds to a linear thickness of cm (here, the errors are due to the irregularity of the [Fe ii]12567 emission region). This result suggests that the thickness of the lobes also presents a latitude-dependent effect, which makes it almost 50 per cent thicker at polar regions than at lower latitudes.
Both holes – SE and NW – define an axis with position angle (P.A.) of , which coincides with that found by Smith (2002) based on symmetry arguments. We suggest that these holes must form a fundamental axis of the Homunculus, which could be created because of a low (or even inhibited) mass-loss rate within of the poles. Since about 75 per cent of the mass of the Homunculus is located at high stellar latitudes (Smith, 2006), when the lobes expand they might appear as two rings in the future, similar to those seen around other blue supergiants, such as HD168625 or Sher 25 (Smith, 2007).
An alternative explanation is that the central star has had a major blowout in the polar region, creating the holes. In this scenario, this ‘blowout’ would have been a greater manifestation of the same mechanism that produced the many fast-moving structures dubbed ‘strings’ or ‘whiskers’ or even ‘spikes’ (Weis et al., 1999; Morse et al., 1998; Meaburn et al., 1996). These high-density ( cm-3; Weis 2002) filamentar structures lie outside the Homunculus and are moving at nearly 1000 km s-1 but even so, they do not emit hard X-rays most likely because of its very small cross-section. Interestingly, they are only seen at high stellar latitudes (in the polar directions). One of the explanations for the observed velocity profile (a Hubble law) of these structures is that they could be formed in a presumably stellar explosion (Weis et al., 1999). Thus, if this scenario is correct, this explosion could be responsible for the formation of the hole in pole as well.
We also note that an explosion at the surface of the primary star was the physical mechanism used by Smith & Townsend (2007) in a simulation that creates, simultaneously, a bipolar nebula and an equatorial disc (as observed in the Homunculus). However, the physical mechanism that could start such stellar explosion remains unclear, and encourages further studies.
4.1.3 Spatial mapping of the Little Homunculus
Due to the long-slit spectroscopic technique employed by Smith (2005), the determination of the spatial extent and distribution of the Little Homunculus (hereafter LH) was restricted to the interpolation between the points where the emission associated with the LH was detected in the slit. In the present work, we show the 3D kinematics in the form of slices in velocity space, rather than slices along the major axis as in Smith (2005), but the results of the two independent methods are in agreement. Our velocity channel images may provide a better way to evaluate images from simulations of the formation of the LH (González et al., 2004), as we provide a complete, model-independent spatial map of the LH.
Our analysis of the velocity maps (Fig. 5) showed that the emission of the SE lobe of the LH begins at km s-1 and goes up to km s-1. The emission associated to the LH is seen blue-shifted near the centre in the SE lobe as indicated in Fig. 5(a) and (b), in line with the results of Smith (2005). Starting from negative and moving toward positive velocities, it is possible to see the emission from the equatorial disc (EQ in Fig. 5(a)) in the same line-of-sight of the NW lobe of the LH. However, based on geometric arguments, the components of the equatorial disc can only have negative velocities (Davidson et al., 1997). Thus, the component associated to the NW lobe of the LH was identified as the structure lying near the central region with velocities ranging from up to about km s-1 (see Fig. 5(d)–(f)).
4.2 The He i 10830 emission column
The He i 10830 line has a very complex velocity structure in the spectrum of the Homunculus (Smith, 2002). It is a combination of absorption, emission and reflection from different regions inside and outside the nebula and is, presumably, formed near the central source.
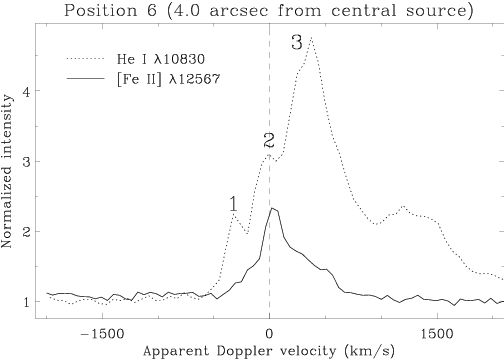
We detected an intrinsic emission component which appears restricted to a narrow azimuthal region in the line-of-sight to the NW lobe (Smith, 2002). It is labelled as 1 in Fig. 6, and is likely photo-excited by energetic photons (at least eV), since [Fe ii] 12567 does not show any component at the same velocity. Component 2 is associated with emission from the slow-moving equatorial ejecta555Note, however, that component 2 may also be associated with diffuse emission due to the H ii region in which Carinae is immersed., and component 3 is reflected emission from the central source in the NW lobe (see also fig. 12 and 13 of Smith 2002).
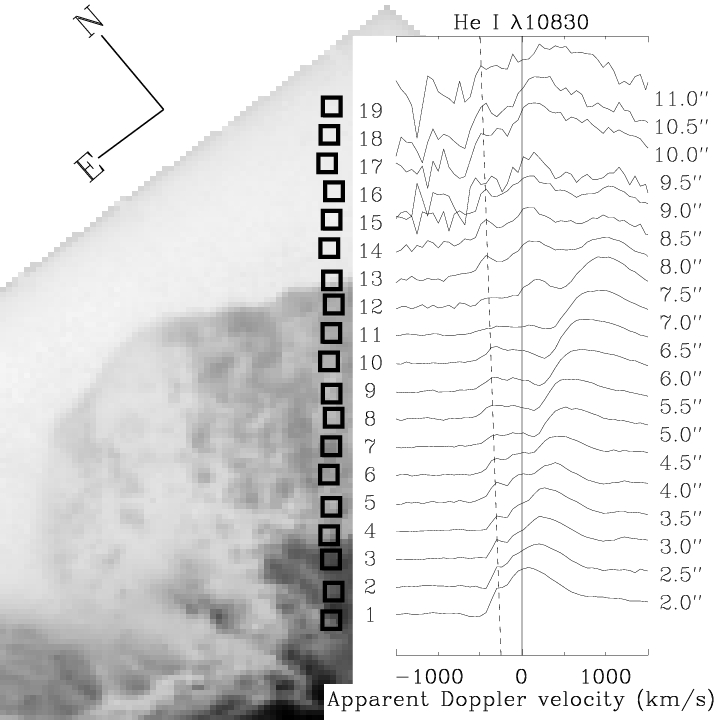
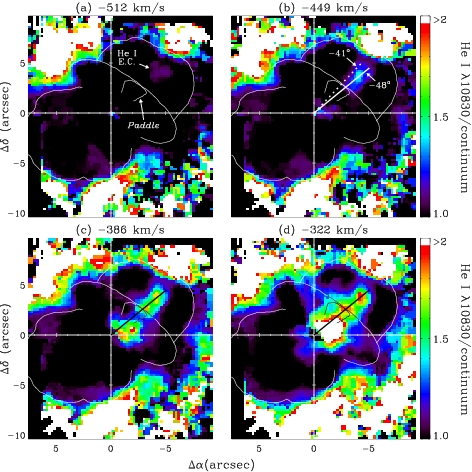
This narrow intrinsic emission of He i 10830 (hereafter He emission column) is likely formed when the UV radiation from the central source passes through the holes in the torus (Smith, 2002; Smith et al., 2002) and are free to excite He atoms at large radii from the central source. The apparent Doppler velocity of the He emission column changes, respectively, from to km s-1 when moving from a projected distance of 2 arcsec to 10.5 arcsec from the central source (see Fig. 7), suggesting that the emitting region has a Hubble-flow motion, i.e. . Note that such high projected velocity would suggest that the equatorial disc has ejecta moving as fast as the polar cap of the Homunculus. However, as will be discussed in the next section, given the errors associated to the determination of the inclination angle of the helium emission column (which indicates whether or not it is in the equatorial disc), it may be comfortably associated with the Great Eruption, which lasted about 20 yr with peak between 1843 and 1851 (Currie et al., 1996; Currie & Dowling, 1999; Morse et al., 2001).
4.2.1 Characteristics of the helium emission column and the detection of its twin brother
It is known that the Paddle is a dust-free region located at the equatorial disc (Smith et al., 1998). Its shape is well defined and seems symmetric regarding the major axis of the Homunculus666Although it is likely that this alignment occurs by chance. (see Fig. 1). Therefore, the Paddle would be a suitable candidate to be blamed for the escape of radiation. Indeed, free of any interaction, it is expected that radiation flowing through that region would follow a linear path centered on P.A.= – the position angle of the Paddle. However, the observed P.A. of the He i emission column is different of the Paddle, namely the He emission is at (see Fig. 8). We must stress that even with this discrepancy, the Hei10830 emission column can be weakly detected along P.A.= because of its roughly 3 arcsec wide but the bulk of emission comes indeed from P.A.=.
In order to analyse the kinematic structure of the He i10830, we adopted the same convention as in Davidson et al. (2001) and calculated the inclination angle777The inclination angle is defined such that means that the equatorial disc is seen face-on, while corresponds to an edge-on view. of the He emission column using the following equation
where is the age, in years, of the equatorial gas, is the heliocentric distance to Car measured in pc, is the apparent Doppler velocity (km s-1) measured at position (arcsec). Note that regarding the age of the equatorial disc, there is no consensus. Based on kinematics studies, Morse et al. (2001) suggested that the equatorial disc is coeval with the Homunculus lobes, although some material appears to be even younger presumably associated with posterior eruptions (Davidson et al., 1997, 2001; Smith & Gehrz, 1998; Dorland et al., 2004). In the present work, we assumed an age of 160 year for the equatorial disc. We also assumed that it is perpendicular to the major axis of the Homunculus (Davidson et al., 2001; Smith & Townsend, 2007).
From our data, the average value of was km s-1 arcsec-1, corresponding to , which in turn results an inclination angle of approximately from the plane of the sky toward us. Though the error in our result () is larger than that obtained with long-slit observations – typically less than 1°–, the lower end is consistent with , which is the assumed inclination angle of the equatorial disc obtained using long-slit observations. Even so, our range of values for the inclination angle of the helium emission column is coherent with the Great Eruption, which takes place between 1837 and 1860, with the peak occuring around 1843 and 1851 (Currie et al., 1996; Currie & Dowling, 1999; Morse et al., 2001).
Hence, we concluded that, if the He i10830 emission column is indeed in the equatorial disc and is caused by UV escaping through a hole in the torus, we should detect this same effect in other places, since it is known that there are many holes in the equatorial torus.
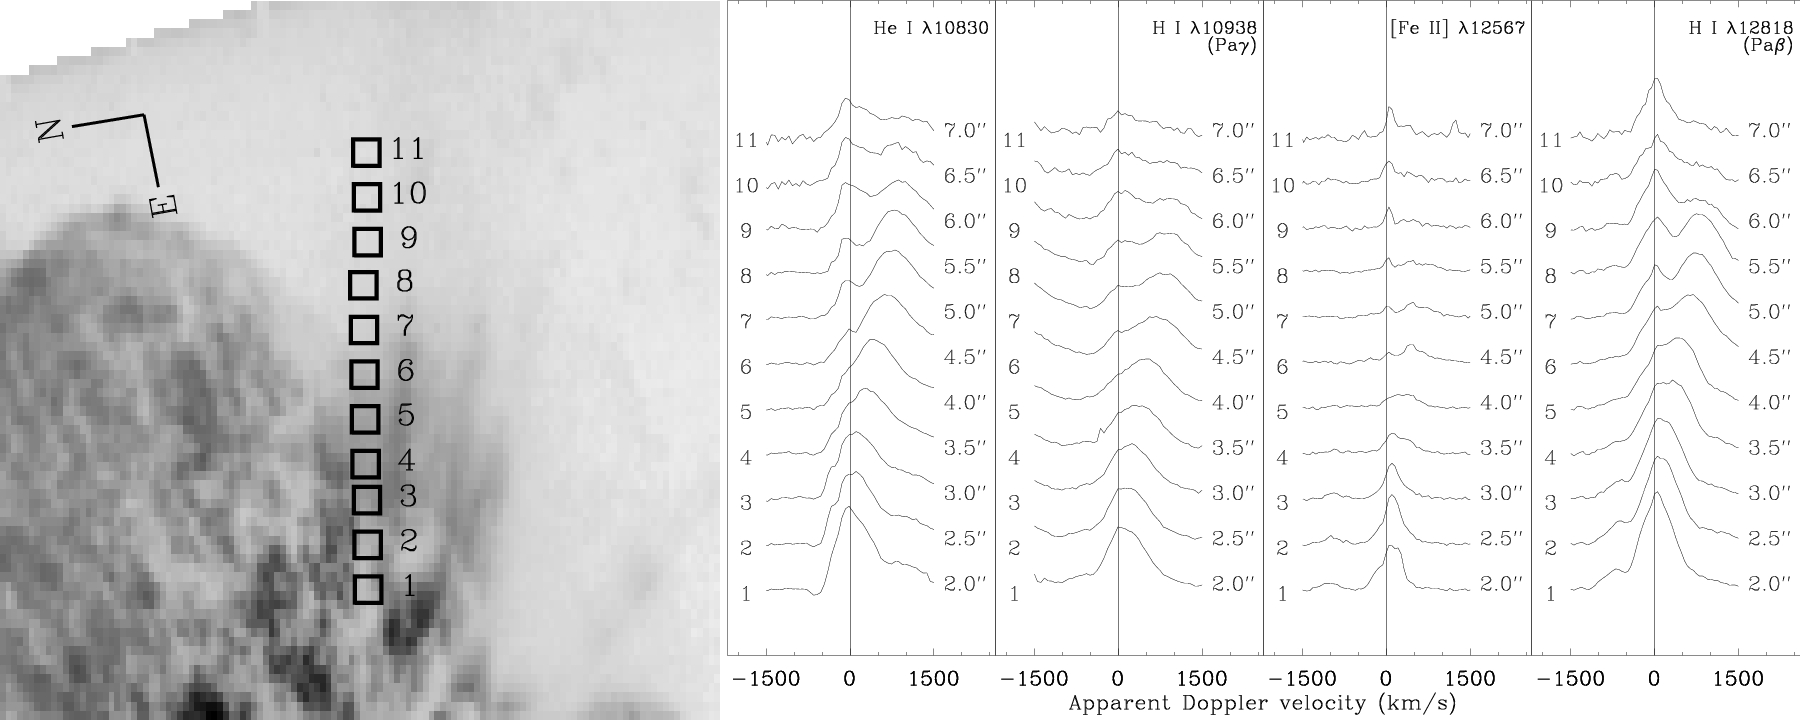
In fact, we also detected intrinsic emission of Hei10830 at the end of the NN jet (Fig 9). With a P.A. of +35°, the spectrum extracted from 2 up to 6 arcsec from the central source is likely reflected by dust in the NN jet, since they show a red-shifted velocity profile where it is expected to find only blue-shifted velocities (if they were due to intrinsic emission). Furthermore, He i10830 shows a velocity-variable P Cyg profile in that region (shown by the dashed line from position 1 to 8 in Fig. 9), which is also a strong suggestion of reflection. However, beyond 6 arcsec from the central source, the reflected profile disappears and a blue-shifted emission begins to raise at approximately km s-1 going up to km s-1 at 8 arcsec (see Fig. 9). Therefore, our results suggest that there are at least two regions where radiation is escaping to excite/ionize gas lying in the equatorial disc.
In a binary context, these regions could be produced by the high-energy radiation coming direct from the hot source of the system, which spends most of its orbital period near apastron, in a highly elliptical orbit. Thus, if the plane of the orbit is the same as the equatorial disc, then one would expect the UV from the secondary to escape through the holes in the torus and excite/ionize helium atoms along its way. It would be very interesting to observe these regions along the period of 5.52 year to see their behavior near the minimum, when the hot companion gets into the dense wind of the primary. Hence, if our assumption is correct, the He i10830 emission column would fade and then return.
We also noted that to the SW direction – toward the S-condensation –, we only detected reflected components as well as intrisic emission associated with the equatorial disc but no signal of another He i10830 emission column (see Fig 10).
5 Discussion
5.1 The 3-cm radio emission
| (Å) | Ion | Velocity (km s-1) |
| 11730.8 | [Ti ii] 11736 | |
| 11817.7 | [Ti ii] 11823 | |
| 11833.8 | [Ti ii] 11838 | |
| 11853.0 | [V ii] 11857 | |
| 11877.2 | [Fe ii] 11882 | |
| 11883.9 | ? | |
| 11890.8 | ? | |
| 11925.2 | [Ti ii] 11930 | |
| 11945.8 | [Cr ii] 11950 | |
| 12028.1 | [Ti ii] 12033 | |
| 12037.1 | [Ti ii] 12042 | |
| 12292.8 | [Ti ii] 12298 | |
| 12322.9 | ? | |
| 12383.5 | [Fe ii] 12388 | |
| 12416.6 | [Ti ii] 12422 | |
| 12469.7 | [Cr ii] 12476 | |
| 12482.8 | [Cr ii] 12488 | |
| 12490.5 | [Ti ii] 12496 | |
| 12521.8 | [Fe ii] 12521 | |
| 12556.3 | [Fe ii] 12567 | 250 |
| 12563.2 | 85 | |
| 12573.1 | +150 | |
| 12633.0 | [Ti ii] 12638 | |
| 12646.5 | [Ti ii] 12651 | |
| 12685.5 | [Ti ii] 12692 | |
| 12703.1 | ? | |
| 12713.7 | [Ti ii]/[Mn ii] 12719 | |
| 12787.3 | [Fe ii] 12787 | |
| mean velocity | ||
The radio monitoring performed by Duncan & White (2003) revealed that during the low-excitation phases (when the high-excitation lines weaken or vanish – Gaviola 1953; Rodgers & Searle 1967; Thackeray 1967; Zanella et al. 1984) the free-free emission is concentrated in a small region of arcsec in diameter. However, during the ‘normal’ state, a more extended 3-cm radio emission region of about 4 arcsec is present, which can be seen by the contours in Fig. 11.
It is often assumed that the structure seen at 3-cm radio continuum is the equatorial torus. In this context, during the high-excitation state, the surrounding torus absorbs the UV radiation and then is kept ionized throughout the most part of the orbital period. However, when the secondary star is at periastron, the ionizing flux is rapidly absorbed by the dense wind of the primary star and thus the previously-ionized 4 arcsec-wide region – namely, the torus – is allowed to recombine and therefore, the radio-continuum flux is reduced to a point-like source, i.e. restricted to a small Strömgren sphere around the hot companion.
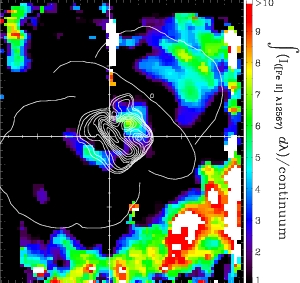
On the other hand, the ionizing flux could also be absorbed in the lobes of the LH. Duncan et al. (1997) showed that the H91 flux is composed of mainly two components: one bright and narrow feature (FWHM km s-1) with peak at km s-1 and a broad (FWHM km s-1), fainter emission with peak at approximately km s-1 (Duncan et al., 1997). The brightest component is presumably equatorial emission due to a turbulent gas cloud located at 1.6 arcsec NW of the central source. This cloud must be colder than the rest of the torus because of its high ratio of spectral-line to continuum, which is an indicator of the temperature of the emitting region (Duncan et al. 1997 and references therein).
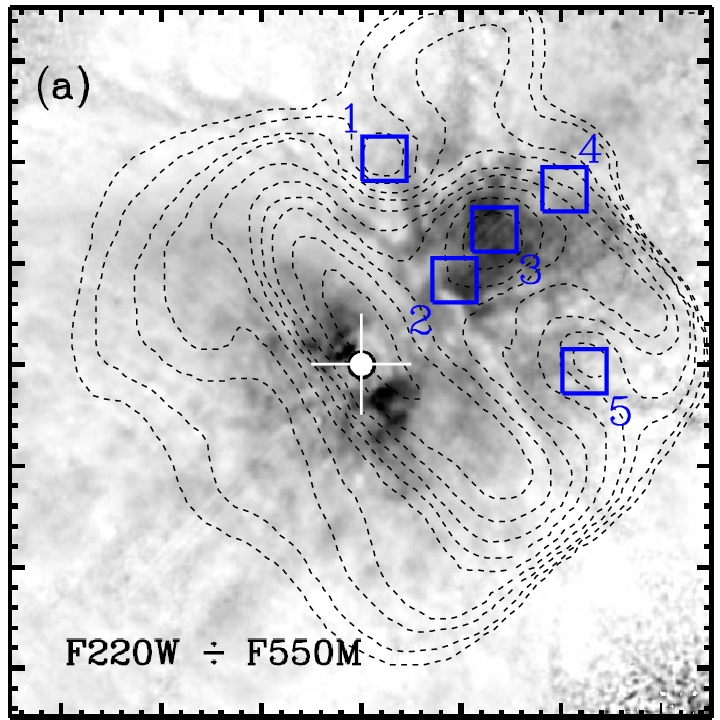
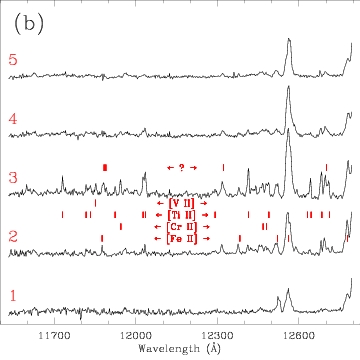
Although the projected position of this cold cloud (which we refer to as the radio spot) is the same as the ‘Sr-filament’ (see Fig. 12), they obviously do not occupy the same spatial region, since the radio spot must be ionized to be seen in radio frequencies while the ‘Sr-filament’ shows many lines of low-ionization ions such as [Srii], [Tiii], etc. (Zethson et al. 1999; Hartman et al. 2001; Hartman et al. 2004). Lines of these same ions were also present in our data, as shown in Fig. 12 and listed in Table 1. In addition, the kinematics of the ‘Sr-filament’ ( km s-1) does not match the observed velocity of the peak of the bright H91 component ( km s-1). We noted, though, that the He i10830 emission column does match the velocity of the radio peak. Moreover, they are located at roughly the same projected position, suggesting that they may be related to each other. There is no doubt that this relationship deserves further studies, since it could give important clues about the ionizing source.
Regarding the faint component of the H91 emission, it could arise from both the torus and the LH because of the spatial coincidence that exists between the low-level contours of the broad radio-emission and the extent of the LH (see Fig. 11). Moreover, the FWHM of this component is similar to the range of velocities observed in the LH ( km s-1; Smith 2005).
5.2 On the nature of Car B
Independently of where the radio emission is formed and assuming that the free-free emission discussed in § 5.1 is caused mainly by the UV radiation field of Car B, we estimated the number of Lyman continuum photons using the following relation (Mezger et al., 1974; Carpenter et al., 1990; Filipovic et al., 2003; Morgan et al., 2004)
where is the number of photons per second in the Lyman continuum, is a numeric constant (= 4.76 ), is a slowly varying function tabulated by Mezger & Henderson (1967), is the frequency at which the observation is made, is the electronic temperature, is the flux density, and is the distance to the source.
Using the observed radio continuum flux at 1.3 mm888At this wavelength the free-free emission is optically thin (Abraham et al., 2005). when the system is at high-excitation state (i.e., when Car B is out of dense wind of the primary star) Jy (Abraham, Z., private communication) and a value of for K (Mezger & Henderson, 1967), the ionising flux is log(. This corresponds to a star with the minimum spectral type of O5.5 III to O7 I star (Martins et al., 2005). As we can only put a lower limit to the number of Lyman continuum photons and to the spectral type, we can not rule out a late-type Wolf-Rayet companion, which also has log( (Crowther, 2007).
An O7 I presents stellar parameters compatible with other other works. The effective temperature for such a star is about 35,000 K (Martins et al., 2005), which is well within the range of 34,000–38,000 K determined by Verner et al. (2005) based on the observed ratio of [Ar iii] to [Ne iii] in the Weigelt blobs. Iping et al. (2005) also indicates an effective temperature near 35,000 K using spectra obtained with the Far Ultraviolet Spectroscopic Explorer (FUSE). Altough the flux of Car B is expected to dominate the spectra at wavelengths shortward of 1200 Å (Hillier et al., 2006), the quantitative analysis is rather complex (Hillier et al., 2006). An O5.5 III star presents stellar parameters that are also similar to those assumed for Car B. Following Martins et al. (2005), an O5.5 III star has an effective temperature of about 39,250 K, which is higher than the upper limit of Verner et al. (2005). Nevertheless, this effective temperature is rather acceptable since, there may be gas between the ionizing source and the Weigelt blobs responsible for absorbing the high energy part of the spectrum, and thus decreasing the estimating of the effective temperature.
It is worthwhile to note that Prinja et al. (1990) showed that early-type stars in the range from O5.5 ( K) to O7 ( K) present terminal velocities in the range from 1100 up to 3000 km s-1, which agrees with the values proposed for Car B by (Davidson, 1999; Pittard & Corcoran, 2003) based on hydrodynamic calculations.
6 Summary and conclusions
Near-infrared integral field spectroscopy has revealed additional details of the circumstellar ejecta around Car. The main results and conclusions are summarized below:
-
1.
We determined the dimensions and geometry of the hole present in both lobes of the Homunculus using our [Fe ii] 12567 velocity maps and the model of Smith (2006) for the Homunculus. The holes have a diameter of cm and is cm-thick at the polar region. They are located within from the pole, suggesting an inhibited mass loss at stellar latitudes during the Great Eruption. These holes are seen in the H2 and [Fe ii] 16435 lines as well (Smith, 2006);
-
2.
The feature known as the SE hole in optical images is a region with a local minimum column density towards the SE lobe caused by the fact that we are looking through the borders of the hole;
-
3.
We confirmed the claim of Smith (2005) and also suggested that the broad component of the 3-cm continuum radio-emission originates both in the torus and the LH because of the spatial coincidence between the low-level contours of the radio emission and the extent of the LH, though the bulk of emission is due to the torus. Moreover, the width of the broad radio-emission is also consistent with the kinematics of the LH.
-
4.
The Hei10830 emission column presents a Hubble flow from km s-1 (at 2 arcsec from the central source) to km s-1 (at 10.5 arcsec). Its position angle is and based on symmetry and kinematic arguments, we suggested that the Hei10830 emission column is not related to the Paddle, which shows P.A.=. Nonetheless, our results suggest that it is indeed in the equatorial disc (with inclination angle of ) and is most likely related to the radio spot (the narrow component of the 3-cm continuum radio-emission reported by Duncan et al. 1997).
-
5.
We also detected another He i 10830 emission column at P.A.=, confirming the suggestion that such structure is indeed caused by high-energy photons (far-UV from Car B) escaping through holes in the equatorial disc.
-
6.
The radio spot and the ‘Sr-filament’ are in the same line-of-sight but disconnected spatially. While the former is an ionized region with peak at km s-1, the latter is characterized by low-ionization lines with typically km s-1, presumably shielded from high-energy radiation by H0 and a forest of Fe+ (Bautista et al., 2002, 2006).
-
7.
From the observed 1.3-mm radio flux we estimated that the ionising flux, which comes from Car B, is consistent with an O-type star hotter than O5.5 III to O7 I, though we can not rule out a Wolf-Rayet nature to the companion at this point.
7 Acknowledgments
M. Teodoro, A. Damineli, J. H. Groh and C. L. Barbosa are grateful to the Brazilian agencies CNPq and FAPESP for continuous financial support. We would like to thank Dr. Nathan Smith for his extensive comments and suggestions on the earlier stages of this manuscript. We are grateful to the referee Dr. Theodore Gull for his fruitful comments that have improved the content and presentation of our results. M. Teodoro also would like to thank Michelle Doherty for her efforts in obtaining all the calibration data as well as Dr. Jon Morse for kindly granting the permission to use the HST/WFPC2 images of the Homunculus shown in this paper. M. Teodoro is supported by FAPESP through grant 05/00190-8.
References
- Abraham et al. (2005) Abraham Z., Falceta-Gonçalves D., Dominici T., Caproni A., Jatenco-Pereira V., 2005, MNRAS, 364, 922
- Allen & Hillier (1991) Allen D., Hillier J., 1991, Proceedings of the Astronomical Society of Australia, 9, 120
- Allen & Hillier (1993) Allen D. A., Hillier D. J., 1993, Proceedings of the Astronomical Society of Australia, 10, 338
- Bautista et al. (2002) Bautista M. A., Gull T. R., Ishibashi K., Hartman H., Davidson K., 2002, MNRAS, 331, 875
- Bautista et al. (2006) Bautista M. A., Hartman H., Gull T. R., Smith N., Lodders K., 2006, MNRAS, 370, 1991
- Carpenter et al. (1990) Carpenter J. M., Snell R. L., Schloerb F. P., 1990, ApJ, 362, 147
- Crowther (2007) Crowther P. A., 2007, ARA&A, 45, 177
- Currie & Dowling (1999) Currie D. G., Dowling D. M., 1999, in Morse J. A., Humphreys R. M., Damineli A., eds, Eta Carinae at The Millennium Vol. 179 of Astronomical Society of the Pacific Conference Series, Astrometric Motion and Doppler Velocity. pp 72–+
- Currie et al. (1996) Currie D. G., Dowling D. M., Shaya E. J., Hester J., Scowen P., Groth E. J., Lynds R., O’neil Jr. E. J., Wide Field/Planetary Camera Instrument Definition Team 1996, AJ, 112, 1115
- Damineli (1996) Damineli A., 1996, ApJ, 460, L49
- Damineli et al. (2000) Damineli A., Kaufer A., Wolf B., Stahl O., Lopes D. F., de Araújo F. X., 2000, ApJ, 528, L101
- Davidson (1999) Davidson K., 1999, in Morse J. A., Humphreys R. M., Damineli A., eds, Eta Carinae at The Millennium Vol. 179 of Astronomical Society of the Pacific Conference Series, Why the Binary Hypothesis Isn’t a Panacea. pp 304–+
- Davidson et al. (1997) Davidson K., Ebbets D., Johansson S., Morse J. A., Hamann F. W., 1997, AJ, 113, 335
- Davidson et al. (2001) Davidson K., Smith N., Gull T. R., Ishibashi K., Hillier D. J., 2001, AJ, 121, 1569
- Davidson et al. (1997) Davidson K., Zethson T., Johansson S., Ishibashi K., Ebbets D., 1997, in Bulletin of the American Astronomical Society Vol. 29 of Bulletin of the American Astronomical Society, Strange velocities in the equatorial ejecta of Eta Carinae. pp 1261–+
- Dorland et al. (2004) Dorland B. N., Currie D. G., Hajian A. R., 2004, AJ, 127, 1052
- Duncan & White (2003) Duncan R. A., White S. M., 2003, MNRAS, 338, 425
- Duncan et al. (1997) Duncan R. A., White S. M., Lim J., 1997, MNRAS, 290, 680
- Duschl et al. (1995) Duschl W. J., Hofmann K.-H., Rigaut F., Weigelt G., 1995, in Niemela V., Morrell N., Feinstein A., eds, Revista Mexicana de Astronomia y Astrofisica Conference Series Morphology and Kinematics of Eta Carinae. p. 17
- Filipovic et al. (2003) Filipovic M. D., Jones P. A., White G. L., 2003, Serbian Astronomical Journal, 166, 31
- Gaviola (1950) Gaviola E., 1950, ApJ, 111, 408
- Gaviola (1953) Gaviola E., 1953, ApJ, 118, 234
- González et al. (2004) González R. F., de Gouveia Dal Pino E. M., Raga A. C., Velazquez P. F., 2004, ApJ, 600, L59
- Gull et al. (2000) Gull T., Zethson T., Hartman H., Johansson S., Davidson K., Ishibashi K., 2000, in Bulletin of the American Astronomical Society Vol. 32 of Bulletin of the American Astronomical Society, [Sr II] Detected in a Nebular Filament Near Eta Carinae. pp 682–+
- Gull et al. (2001) Gull T. R., Hartman H., Zethson T., Johansson S., Ishibashi K., Davidson K., 2001, in Bulletin of the American Astronomical Society Vol. 33 of Bulletin of the American Astronomical Society, The Strontium Filament within the Homunculus of Eta Carinae. pp 1505–+
- Gull et al. (2005) Gull T. R., Vieira G., Bruhweiler F., Nielsen K. E., Verner E., Danks A., 2005, ApJ, 620, 442
- Hamaguchi et al. (2007) Hamaguchi K., Corcoran M. F., Gull T., Ishibashi K., Pittard J. M., Hillier D. J., Damineli A., Davidson K., Nielsen K. E., Kober G. V., 2007, ApJ, 663, 522
- Hartman et al. (2004) Hartman H., Gull T., Johansson S., Smith N., HST Eta Carinae Treasury Project Team 2004, A&A, 419, 215
- Hartman et al. (2001) Hartman H., Zethson T., Johansson S., Gull T., Ishibashi K., Davidson K., Smith N., 2001, in Gull T. R., Johannson S., Davidson K., eds, Eta Carinae and Other Mysterious Stars: The Hidden Opportunities of Emission Spectroscopy Vol. 242 of Astronomical Society of the Pacific Conference Series, Identification of Lines in the Strontium Region of Eta Carinae. pp 107–+
- Hillier & Allen (1992) Hillier D. J., Allen D. A., 1992, A&A, 262, 153
- Hillier et al. (2006) Hillier D. J., Gull T., Nielsen K., Sonneborn G., Iping R., Smith N., Corcoran M., Damineli A., Hamann F. W., Martin J. C., Weis K., 2006, ApJ, 642, 1098
- Iping et al. (2005) Iping R. C., Sonneborn G., Gull T. R., Massa D. L., Hillier D. J., 2005, ApJL, 633, L37
- Ishibashi et al. (2003) Ishibashi K., Gull T. R., Davidson K., Smith N., Lanz T., Lindler D., Feggans K., Verner E., Woodgate B. E., Kimble R. A., Bowers C. W., Kraemer S. et al.., 2003, AJ, 125, 3222
- Martins et al. (2005) Martins F., Schaerer D., Hillier D. J., 2005, A&A, 436, 1049
- Meaburn et al. (1996) Meaburn J., Boumis P., Walsh J. R., Steffen W., Holloway A. J., Williams R. J. R., Bryce M., 1996, MNRAS, 282, 1313
- Meaburn et al. (1993) Meaburn J., Walsh J. R., Wolstencroft R. D., 1993, A&A, 268, 283
- Mezger & Henderson (1967) Mezger P. G., Henderson A. P., 1967, ApJ, 147, 471
- Mezger et al. (1974) Mezger P. G., Smith L. F., Churchwell E., 1974, A&A, 32, 269
- Morgan et al. (2004) Morgan L. K., Thompson M. A., Urquhart J. S., White G. J., Miao J., 2004, A&A, 426, 535
- Morris et al. (1999) Morris P. W., Waters L. B. F. M., Barlow M. J., Lim T., de Koter A., Voors R. H. M., Cox P., de Graauw T., Henning T., Hony S., Lamers H. J. G. L. M., Mutschke H., Trams N. R., 1999, Nature, 402, 502
- Morse et al. (1998) Morse J. A., Davidson K., Bally J., Ebbets D., Balick B., Frank A., 1998, AJ, 116, 2443
- Morse et al. (2001) Morse J. A., Kellogg J. R., Bally J., Davidson K., Balick B., Ebbets D., 2001, ApJ, 548, L207
- Parry et al. (2004) Parry I., Bunker A., Dean A., Doherty M., Horton A., King D., Lemoine-Busserole M., Mackay C. D., McMahon R., Medlen S., Sharp R. G., Smith J., 2004, in Moorwood A. F. M., Iye M., eds, Ground-based Instrumentation for Astronomy. Edited by Alan F. M. Moorwood and Iye Masanori. Proceedings of the SPIE, Volume 5492, pp. 1135-1144 (2004). CIRPASS: description, performance, and astronomical results. pp 1135–1144
- Pittard & Corcoran (2003) Pittard J. M., Corcoran M. F., 2003, in Arthur J., Henney W. J., eds, Revista Mexicana de Astronomia y Astrofisica Conference Series The Wind Properties of Eta Carinae. pp 81–81
- Prinja et al. (1990) Prinja R. K., Barlow M. J., Howarth I. D., 1990, ApJ, 361, 607
- Ringuelet (1958) Ringuelet A. E., 1958, Zeitschrift fur Astrophysik, 46, 276
- Rodgers & Searle (1967) Rodgers A. W., Searle L., 1967, MNRAS, 135, 99
- Smith (2002) Smith N., 2002, MNRAS, 337, 1252
- Smith (2004) Smith N., 2004, MNRAS, 351, L15
- Smith (2005) Smith N., 2005, MNRAS, 357, 1330
- Smith (2006) Smith N., 2006, ApJ, 644, 1151
- Smith (2007) Smith N., 2007, AJ, 133, 1034
- Smith & Davidson (2001) Smith N., Davidson K., 2001, ApJ, 551, L101
- Smith et al. (2003) Smith N., Davidson K., Gull T. R., Ishibashi K., Hillier D. J., 2003, ApJ, 586, 432
- Smith & Ferland (2007) Smith N., Ferland G. J., 2007, ApJ, 655, 911
- Smith & Gehrz (1998) Smith N., Gehrz R. D., 1998, AJ, 116, 823
- Smith & Gehrz (2000) Smith N., Gehrz R. D., 2000, ApJ, 529, L99
- Smith et al. (2003) Smith N., Gehrz R. D., Hinz P. M., Hoffmann W. F., Hora J. L., Mamajek E. E., Meyer M. R., 2003, AJ, 125, 1458
- Smith et al. (2002) Smith N., Gehrz R. D., Hinz P. M., Hoffmann W. F., Mamajek E. E., Meyer M. R., Hora J. L., 2002, ApJ, 567, L77
- Smith et al. (1998) Smith N., Gehrz R. D., Krautter J., 1998, AJ, 116, 1332
- Smith & Morse (2004) Smith N., Morse J. A., 2004, ApJ, 605, 854
- Smith et al. (2004) Smith N., Morse J. A., Gull T. R., Hillier D. J., Gehrz R. D., Walborn N. R., Bautista M., Collins N. R., Corcoran M. F., Damineli A., Hamann F., Hartman H., Johansson S., Stahl O., Weis K., 2004, ApJ, 605, 405
- Smith & Townsend (2007) Smith N., Townsend R. H. D., 2007, ApJ, 666, 967
- Thackeray (1967) Thackeray A. D., 1967, MNRAS, 135, 51
- Verner et al. (2005) Verner E., Bruhweiler F., Gull T., 2005, ApJ, 624, 973
- Weis (2002) Weis K., 2002, ArXiv Astrophysics e-prints
- Weis et al. (2004) Weis K., Corcoran M. F., Bomans D. J., Davidson K., 2004, A&A, 415, 595
- Weis et al. (2001) Weis K., Duschl W. J., Bomans D. J., 2001, A&A, 367, 566
- Weis et al. (1999) Weis K., Duschl W. J., Chu Y.-H., 1999, A&A, 349, 467
- Zanella et al. (1984) Zanella R., Wolf B., Stahl O., 1984, A&A, 137, 79
- Zethson et al. (2001) Zethson T., Gull T. R., Hartman H., Johansson S., Davidson K., Ishibashi K., 2001, AJ, 122, 322
- Zethson et al. (1999) Zethson T., Johansson S., Davidson K., Humphreys R. M., Ishibashi K., Ebbets D., 1999, A&A, 344, 211