Oscillations in the expression of a self-repressed gene
induced by a slow transcriptional dynamics.
Abstract
We revisit the dynamics of a gene repressed by its own protein in the case where the transcription rate does not adapt instantaneously to protein concentration but is a dynamical variable. We derive analytical criteria for the appearance of sustained oscillations and find that they require degradation mechanisms much less nonlinear than for infinitely fast regulation. Deterministic predictions are confirmed by stochastic simulations of this minimal genetic oscillator.
pacs:
87.18.-h 87.18.Vf 87.16.Yc 82.40.BjNetworks of genes interacting via regulatory proteins modulating their activities are highly nonlinear systems which display a variety of dynamical behaviors Goldbeter (1996); Fall et al. (2002); Tiana et al. (2007). Their modeling has generally assumed that gene activation is fast compared to other processes so that transcription rate reacts instantaneously to protein concentration. However, transcription is a complex process Darzacq et al. (2007). In the last years, it has been increasingly recognized that gene activity fluctuations can be slow and that this can affect the behavior of gene regulatory networks. In particular, slow transcriptional bursting and transcriptional memory have been observed experimentally Golding et al. (2005); Chubb et al. (2006); Raj et al. (2006). Theoretically, it has been shown that slow activation dynamics can lead to bursts in expression Hornos et al. (2005); van Zon et al. (2006), induce bistability Lipshtat et al. (2006) or modify the flipping rate of a genetic switch Walczak et al. (2005); Morelli et al. (2008).
In this Letter, we show that slow promoter dynamics can also lead to oscillations by investigating how transcriptional dynamics modifies the behavior of a single gene repressed by its own protein Goodwin (1965); Griffith (1968); Bliss et al. (1982); Goldbeter (1995); Leloup et al. (1999); Jensen et al. (2003); Monk (2003); Lewis (2003). This old problem of theoretical biology has been recently revived by the study of the Hes1 gene involved in the somite clock Hirata et al. (2002). The usual view is that oscillations appear in this genetic circuit only when additional steps are inserted in the feedback loop Griffith (1968); Tiana et al. (2007). In the Goodwin and Bliss oscillators Goodwin (1965); Griffith (1968); Bliss et al. (1982), the gene protein catalyzes synthesis of the actual repressor. In early circadian models, transport of the repressor into the nucleus Goldbeter (1995); Leloup et al. (1999) is a key oscillatory ingredient. In fact, the mere introduction of a time delay in the one-gene circuit model (accounting for protein transport or more generally a cascade of intermediate steps Morelli and Jülicher (2007)) can destabilize it Jensen et al. (2003); Monk (2003); Lewis (2003); Tiana et al. (2007). As will be of particular interest here, oscillations may also be induced by strongly nonlinear degradation mechanisms Tyson et al. (1999).
For simplicity, we study the case of an elementary kinetic equation describing regulation through protein-DNA binding François and Hakim (2005), which we however prefer to view as a minimal description of transcriptional memory in more complex mechanisms. We derive an analytical expression of the oscillation threshold, and show that when the gene response time is appropriately tuned, the one-gene circuit can be destabilized (and oscillations induced) by degradation mechanisms much less nonlinear than for infinitely fast regulation. This result provides new insights into the interplay of nonlinearity and time delay. Stochastic simulations confirm that the main results of our analysis carry over to low copy number situations.
Our study is based on the following three-variable model describing the genetic circuit represented in Fig. 1:
| (1a) | |||||
| (1b) | |||||
| (1c) | |||||
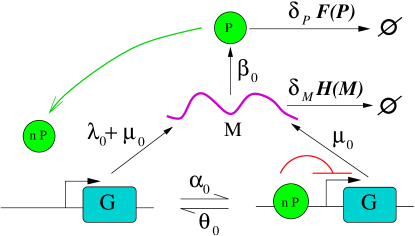
where , and represent gene activity, protein and RNA copy numbers. Eq. (1a) formally describes the kinetics of protein-DNA binding at rate and unbinding at rate François and Hakim (2005). Possible cooperativity effects are taken into account via the function and the number of proteins binding DNA. Single-protein regulation corresponds to , . More generally, Eq (1a) is a minimal model for the dynamics of an effective gene activity slowly relaxing towards an equilibrium value given by the gene regulation function , with the half-expression threshold. Such a model can be obtained as the leading approximation of a mechanistic model of transcription including all processes concurring to gene expression (e.g., protein-DNA interaction, formation of open complex, polymerase recruitment, chromatin remodeling,…) when there is a dominant limiting step. Eq. (1a) causes gene activity to lag fast changes in protein level, and plays a dynamical role similar to explicit time delays Jensen et al. (2003); Monk (2003); Lewis (2003) or to transport equations Leloup et al. (1999). In Eq. (1b), the three terms correspond to binding/unbinding, translation and degradation. Eq. (1c) describes transcription at rate and RNA degradation. In order to understand how oscillations can be induced by tuning protein and RNA degradation, we derive the oscillation criterion for arbitrary degradation functions and with unit derivative at zero, and being the low-copy-number degradation rates.
By renormalizing time, variables, parameters, cooperativity and degradation functions according to:
| (2a) | |||
| (2b) | |||
| (2c) | |||
| (2d) | |||
Eqs. (1) can be rewritten in dimensionless form
| (3a) | |||||
| (3b) | |||||
| (3c) | |||||
where . When and are monotonous and , model (3) has a single steady state satisfying the fixed point equations:
| (4) |
Note that the steady state depends only on parameters and as well as on functions , and , whereas parameters , , control time scales. The behavior of the degradation and cooperativity functions in the neighborhood of the steady state is described by the slopes
In the case of linear degradation [, ], we have . Small or even negative values of the slopes and generally denote strongly nonlinear degradation mechanisms Fall et al. (2002); Tyson et al. (1999), including saturation.
To assess whether Eqs. (3) can display oscillations, we have searched for parameter values where the fixed point specified by (4) loses stability to a periodic solution via a Hopf bifurcation (i.e., a pair of conjugate eigenvalues of the linearized problem cross the imaginary axis). For simplicity, we assume perfect repression () and a large threshold (). Under this approximation, the Routh-Hürwitz stability criterion Gradshteyn and Ryzhik (2000) indicates that a Hopf bifurcation occurs when the quantity
| (5) |
crosses zero to become negative, where is the gene response time, and the sum and product are symmetric functions of degradation rates and . At bifurcation, the oscillation period is where and satisfy . Cooperativity essentially changes feedback strength from to , thus we assume for simplicity single-protein regulation [, ] thereafter.
Eq. (5) shows that a strong feedback destabilizes the system while high degradation rates (large and ) tend to stabilize it. In the single protein case, when both protein and RNA are linearly degraded and no oscillations occur. Conversely, when protein and RNA degradations are completely saturated (), , indicating that oscillations then appear systematically. The behavior in intermediate cases depends on the value of the response time .
In the classical case , and oscillations appear only for . It is indeed known that negative effective degradation rates can lead to oscillations Fall et al. (2002); Tyson et al. (1999). We thus restrict ourselves to showing that at finite , oscillations can occur for . More precisely, we want to understand how oscillations arise away from the saturated cases or . To this end, we use the geometric slope average as an index ( in the linear case), seeking to determine the maximum value of at which oscillations can be observed, and for which values of this extremum is achieved.
The quantities and play complementary roles. The total degradation rate controls instability onset for small to moderate . Moreover, Eq. (5) indicates that when , a necessary condition for oscillations is
| (6) |
where is the time during which a fully active gene synthesizes the amount of protein corresponding to half-repression threshold. The degradation rate product is relevant only for large , blocking oscillations if it is too large. In particular, guarantees the onset of oscillations for sufficiently large whenever (6) holds. For and a given value of , can take any value between and depending on whether the two degradation rates are equal or completely unbalanced, one being equal to zero and the other to . We use below as a balance indicator.
Remarkably, we note that under the rescaling
| (7) |
the oscillation condition can be rewritten without explicit parameter dependence:
| (8) |
and defines a series of curves such that given a balance index and a response time , oscillations are found for . Fig. 2 shows the limit curves and which are important to understand the bifurcation diagram: regardless of the value of , the circuit always (resp., never) oscillates when [resp., ]. To support our analysis, we have searched the parameter space of Eqs. (3) for oscillatory behavior for , assuming for definiteness allosteric protein degradation and Michaelis-Menten RNA degradation:
| (9) |
Points in the plane associated with oscillating parameter sets are shown as black dots in Fig. 2. Agreement is excellent: all dots are below the curve and the few significantly above have one small degradation rate. We are thus confident that our analysis allows us to understand the behavior of Eqs. (3).
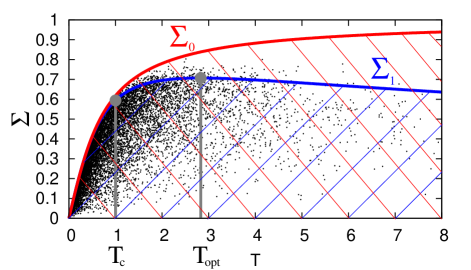
Two regions can be distinguished in Fig. 2. For , the instability threshold is practically independent of and increases rapidly with . For small , (thus, the oscillation criterion is ). In the region, reaches its maximum value at , and then decreases as for , except for where it monotonously increases towards . At fixed , oscillations are thus found in a finite range of , which widens gradually, and is eventually infinite, as .
In the oscillation region, the index measuring distance from saturated degradation reaches its maximal value for and , at the maximum of the curve. Our analysis thus unveils a resonance phenomenon in the dynamics of a self-regulated gene with dynamical transcription rate: this circuit bifurcates most easily to periodic behavior, or more generally is least stable, at a finite value of the gene relaxation time given by where
| (10) |
The quantity gives the time scale at which dynamical behavior departs from the fast regulation case. Because is determined by (4), computing precise lower bounds on with (10) requires specifying the degradation mechanisms. Fixing mn-1, , and , provides an estimate mn which is not unrealistically larger than typical gene induction times. At resonance, the oscillation period is (about 20 mn in the example above).
Since a common interpretation of the diagram of Fig. 1 is that there are only two gene states (bound or unbound) Kepler and Elston (2001), one may wonder whether our deterministic analysis is relevant. If is viewed as a temporal average of gene activity, our results are valid when the response time is small compared to the oscillation period so that there are many binding/unbinding events by cycle Forger and Peskin (2005). Moreover, transcription is a complex process involving a number of distinct steps Darzacq et al. (2007), and Eq. (1a) is the simplest way to model memory effects arising from cooperativity in the transcription machinery Chubb et al. (2006).
Anyhow, we now show that even when is a stochastic variable jumping between and , our main result still holds: there is a time scale near at which oscillations are enhanced. To this end we have carried out stochastic simulations of the reaction network of Fig. 1 using the Gillespie algorithm Gillespie (1977), varying the response time at fixed . Instead of regular oscillations, a sequence of irregularly spaced peaks in protein concentration is observed. A natural question is then whether protein peaks occur more regularly at parameter values where the deterministic model oscillates, in particular when .

We define interpeak times as the time intervals between two crossings of separated by at least one crossing of , with the mean protein level (thus imposing a minimum amplitude of 40%). Their distribution is characterized by the coefficient of variation . A typical variation of with in our system is shown in Fig. 3. It definitely suggests that the deterministic analysis remains relevant in the stochastic regime, since there is clearly a time scale near where interpeak time fluctuations are minimal.
In conclusion, we have shown that a nontrivial transcriptional dynamics can destabilize a self-regulated gene. Although it is known that nonlinear degradation mechanisms can induce oscillations in this system, we observe a resonance-like effect such that a much weaker nonlinearity is required when the gene response time matches a characteristic time. Its expression can be computed analytically, which allows us to identify the parameter regions where this effect cannot be neglected. Stochastic simulations confirm the relevance of this time scale in the dynamics of the self-regulated gene. This shows that transcriptional dynamics is a possible source of oscillatory behavior besides other deterministic Goldbeter (1996); Fall et al. (2002); Tiana et al. (2007); Goldbeter (1995); Leloup et al. (1999); Jensen et al. (2003); Monk (2003); Lewis (2003); Tyson et al. (1999) and stochastic Loinger and Biham (2007); Blossey et al. (2008) effects.
A natural question is whether our conclusions remain valid when more detailed transcriptional mechanisms or multiple sources of delay are taken into account. It can be shown that adding an explicit delay to Eqs. (3) only further destabilizes the circuit and thus does not essentially interfere with the effect of a gene response delay. Future studies should thus focus on cases where the transcriptional dynamics is more complex and features more than one limiting step.
References
- Goldbeter (1996) A. Goldbeter, Biochemical Oscillations and Cellular Rhythms (Cambridge University Press, Cambridge, 1996).
- Fall et al. (2002) C. P. Fall, E. S. Marland, J. M. Wagner, and J. J. Tyson, Computational Cell Biology (Springer, New York, 2002).
- Tiana et al. (2007) G. Tiana, S. Krishna, S. Pigolotti, M. H. Jensen, and K. Sneppen, Phys. Biol. 4, R1 (2007).
- Darzacq et al. (2007) X. Darzacq, Y. Shav-Tal, V. de Turris, Y. Brody, S. M. Shenoy, R. D. Phair, and R. H. Singer, Nat. Struct. Mol. Biol. 14, 796 (2007).
- Golding et al. (2005) I. Golding, J. Paulsson, S. M. Zawilski, and E. C. Cox, Cell 113, 1025 (2005).
- Chubb et al. (2006) J. R. Chubb, T. Trcek, S. M. Shenoy, and R. H. Singer, Curr. Biol. 16, 1018 (2006).
- Raj et al. (2006) A. Raj, C. S. Peskin, D. Tranchina, D. Y. Vargas, and S. Tyagi, PLoS Biol. 4, e309 (2006).
- Hornos et al. (2005) J. E. M. Hornos, D. Schultz, G. C. P. Innocentini, J. Wang, A. M. Walczak, J. N. Onuchic, and P. G. Wolynes, Phys. Rev. E 72, 051907 (2005).
- van Zon et al. (2006) J. S. van Zon, M. J. Morelli, S. Tanase-Nicola, and P. R. ten Wolde, Biophys. J. 91, 4350 (2006).
- Lipshtat et al. (2006) A. Lipshtat, A. Loinger, N. Q. Balaban, and O. Biham, Phys. Rev. Lett. 96, 188101 (2006).
- Walczak et al. (2005) A. M. Walczak, J. N. Onuchic, and P. G. Wolynes, Proc. Natl. Acad. Sci. USA 102, 18926 (2005).
- Morelli et al. (2008) M. J. Morelli, S. Tanase-Nicola, R. J. Allen, and P. R. Wolde, Biophys. J. 94, 3413 (2008).
- Goodwin (1965) B. C. Goodwin, Adv. Enzyme Regul. 3, 425 (1965).
- Griffith (1968) J. S. Griffith, J. Theor. Biol. 20, 202 (1968).
- Bliss et al. (1982) R. D. Bliss, P. R. Painter, and A. G. Marr, J. Theor. Biol. 97, 177 (1982).
- Goldbeter (1995) A. Goldbeter, Proc. R. Soc. Lond. B 261, 319 (1995).
- Leloup et al. (1999) J.-C. Leloup, D. Gonze, and A. Goldbeter, J. Biol. Rhythms 14, 433 (1999).
- Jensen et al. (2003) M. H. Jensen, K. Sneppen, and G. Tiana, FEBS Lett. 541, 176 (2003).
- Monk (2003) N. A. M. Monk, Curr. Biol. 13, 1409 (2003).
- Lewis (2003) J. Lewis, Curr. Biol. 13, 1398 (2003).
- Hirata et al. (2002) H. Hirata, S. Yoshiura, T. Ohtsuka, Y. Bessho, T. Harada, K. Yoshikawa, and R. Kageyama, Science 298, 840 (2002).
- Morelli and Jülicher (2007) L. G. Morelli and F. Jülicher, Phys. Rev. Lett. 98, 228101 (2007).
- Tyson et al. (1999) J. J. Tyson, C. I. Hong, C. D.Thron, and B. Novak, Biophys. J. 77, 2411 (1999).
- François and Hakim (2005) P. François and V. Hakim, Phys. Rev. E 72, 031908 (2005).
- Gradshteyn and Ryzhik (2000) I. S. Gradshteyn and I. M. Ryzhik, Tables of Integrals, Series, and Products (Academic Press, San Diego, 2000).
- Kepler and Elston (2001) T. B. Kepler and T. C. Elston, Biophys. J. 81, 3116 (2001).
- Forger and Peskin (2005) D. B. Forger and C. S. Peskin, Proc. Nat. Acad. Sci. 102, 321 (2005).
- Gillespie (1977) D. T. Gillespie, J. Phys. Chem. 81, 2340 (1977).
- Loinger and Biham (2007) A. Loinger and O. Biham, Phys. Rev. E 76, 051917 (2007).
- Blossey et al. (2008) R. Blossey, L. Cardelli, and A. Phillips, HFSP Journal 2, 17 (2008).