Central K-band kinematics and line strength maps of NGC 1399 ††thanks: Based on observation collected at the ESO Paranal La Silla Observatory, Chile, during the Science Verification of SINFONI.
In this paper we present for the first time high spatial resolution K-band maps of the central kinematical and near-infrared spectral properties of the giant cD galaxy in the Fornax cluster, NGC 1399. We confirm the presence of a central velocity dispersion dip within seen in previous long-slit studies. Our velocity dispersion maps give evidence for a non-symmetric structure in this central area by showing three peaks to the north-east, south-east and west of the galaxy centre. Additionally we measure near-IR line strength indices at unprecedented spatial resolution in NGC 1399. The most important features we observe in our 2-dimensional line strength maps are drops in Na I and CO (2–0) line strength in the nuclear region of the galaxy, coinciding spatially with the drop in . The observed line strength and velocity dispersion changes suggest a scenario where the centre of NGC 1399 harbours a dynamically cold subsystem with a distinct stellar population.
Key Words.:
Galaxies: elliptical and lenticular, cD – Galaxies:individual: NGC 1399 – Galaxies: kinematics and dynamics – Galaxies: stellar content – Galaxies: nuclei1 Introduction
The centres of giant early-type galaxies are interesting laboratories for exploring important questions about the physics of early-type galaxy assembly and star formation history. In particular, the ultimate goal is to tie the formation of global properties to such central properties as nuclear stellar populations, super-massive black holes, and active galactic nuclei.
The recently developed technique of near-infrared integral field spectroscopy in conjunction with adaptive optics offers a new window into these astrophysical questions by probing spatial scales (01 or better) heretofore only accessible to the instruments on the Hubble Space Telescope (HST). At the distance of the Fornax cluster ( 20 Mpc) this corresponds to a spatial resolution of about 10 pc, which can be achieved over a field-of-view with e.g., VLT/SINFONI. Although with limited field of view, this setup can be used to scrutinise compact stellar subsystems such as globular clusters or the nuclear regions of galaxies.
Today it is widely accepted that many massive and bright early-type galaxies contain super-massive central black holes (SMBH) with masses reaching up to M⊙, which tightly correlate with the physical properties of the host galaxies (Kormendy & Richstone 1995; Gebhardt et al. 2000; Ferrarese & Merritt 2000). Recently, it was shown that the nuclei of low- and intermediate luminosity early-type galaxies in the Fornax and Virgo clusters exhibit a (often blue) central (0.02 effective radii) light excess in contrast with high-luminosity galaxies (), which usually show a flat luminosity profile (core) at the same spatial scales (Côté et al. 2006, 2007). The mass fraction contributed by the central light excess is similar to the relative contribution of SMBH in giant galaxies, which could suggest a common formation path (Wehner & Harris 2006; Côté et al. 2006). The nature of these central light anomalies is still uncertain since until recently their spatial scales were typically reachable only by HST imaging and in a few cases HST/STIS spectroscopy.
In this paper we present for the first time high spatial resolution two-dimensional maps of the velocity profile and the distribution of two near-IR spectral features in NGC 1399 – the central giant elliptical galaxy in the Fornax cluster (). This galaxy is known to harbour a SMBH (Saglia et al. 2000; Houghton et al. 2006; Gebhardt et al. 2007), weak nuclear activity (O’Connell et al. 2005) and shows a classical core in the luminosity profile (Côté et al. 2007).
The paper is organised as follows: in Section 2 we present the observations and data reduction steps. Section 3 is devoted to the analysis of the kinematics in NGC 1399, while Section 4 presents the measurements of near-IR line strength indices. The main observed features and potential explanations are discussed in Section 5. Our concluding remarks are given in Section 6.
2 Observations and data reduction
2.1 Observations
The observations were made with SINFONI - a near-infrared Integral Field Unit (IFU) spectrograph, mounted in the Cassegrain focus of Unit Telescope 4 (Yepun) of VLT at Paranal La Silla Observatory (Eisenhauer et al. 2003; Bonnet et al. 2004). The instrument’s field of view on the sky is divided into 32 slices. The pre-slit optics allow us to chose between three different spatial samplings: 025, 01 or 0025, yielding a total field of view of 8, 3 or 08 08, respectively. On the detector each slitlet is imaged over 64 pixels in a brick-wall pattern and thus each one is well separated from the neighbouring slitlets on the sky. The Science Verification detector used during our observations had a blemish affecting wavelengths between 2.37 and 2.40 m of the spectrum from slitlet number 17. This defect had no impact on our investigation since it lay outside of the wavelength region of interest.
| UT date | t (s) | O+S Frames | Total t (s) | OB ID |
|---|---|---|---|---|
| (1) | (2) | (3) | (4) | (5) |
| 2004 Oct 05 | 2x300 | 4+4 | 2400 | A |
| 2004 Nov 25 | 2x300 | 4+4 | 2400 | B |
| 2004 Nov 26 | 2x300 | 4+4 | 2400 | C |
| 2004 Nov 26 | 2x300 | 4+4 | 2400 | D |
| 2004 Nov 26 | 2x300 | 4+4 | 2400 | E |
Notes: (1) Date of observation, (2) exposure time per object pointing, (3) number of Object + Sky frames, (4) total on source exposure time per observing block, (5) observing block ID.
Our study makes use of the 01 scale with a grism covering the K-band from 1.95 to 2.45 m at a dispersion of 2.45 Å/pix. In this mode, SINFONI delivers a spatial sampling of . However, during data processing the observations were re-sampled to as allowed by our dithering strategy. The spectral resolution around the centre of the band is R3800, measured from arc lamp frames. NGC 1399 was observed on 5 October, 25 November, and 26 November 2004 as part of the SINFONI Science Verification program. Observing conditions were generally good with free-air optical seeing measurements ranging from 04 to 07, except in the night of October , where they reached 1.
Observing in the near-IR spectral domain implies several challenges. One of them is the very bright night sky consisting of many strong emission lines. To remove the night sky signature we used the standard near-IR technique of consecutively taking object (O) and sky (S) frames. Our target was observed in five observing blocks (OBs) each containing a OSSOOSSO sequence (see Table 1). Each individual object pointing had two 300 s integrations, the sky pointings only one. The various on source pointings were dithered by 005 to reject bad pixels and assure better spatial sampling. In the course of the data reduction we decided to exclude OB A, because of highly variable sky conditions resulting in a poor sky subtraction.
In order to improve upon natural seeing the observations were carried out using adaptive optics (AO) in natural guide star assisted mode. We used the same guide star (2MASS J03382914-3526442) as in the study of Houghton et al. (2006) which is located 176 to the North of the galaxy centre.
Together with the science observations appropriate telluric standard stars were observed, as well as four velocity template stars covering the spectral range K4III to K7III (see Table 2).
| Name | spectral type | Source |
|---|---|---|
| (1) | (2) | (3) |
| HD 0005425 | K4III | this paper |
| HD 0025211 | K4/5III | this paper |
| BD -15 1319 | K5III | this paper |
| BD -16 1418 | K7III | this paper |
| 2MASS J20411845+0016280 | M0III | 075.B-0495(A) |
| HD 0141665 | M5III | 075.B-0490(A) |
| 2MASS J17093801-2718559 | M5II-III | 075.B-0490(A) |
Notes: (1) star name, (2) spectral type, (3) origin of data.
2.2 Basic data reduction and telluric correction
The observations were reduced with the ESO SINFONI Pipeline v. 1.6 (Modigliani et al. 2007). Calibration files such as distortion maps, flat fields and bad pixel maps, were obtained with the help of the relevant pipeline tasks (“recipes”). Finally, for each data set contained in one OB the jitter recipe extracts the raw data, applies distortion, flat-field corrections, wavelength calibration and stores the combined sky-subtracted spectra in a 3-dimensional data cube. The same pipeline steps were also used to reduce the observations of the telluric and velocity template stars. The jitter recipe also provides a one-dimensional spectrum extracted from an optimal aperture, which worked well for our star observations.
The accuracy of the wavelength calibration was checked by comparing the position of known sky emission lines to the wavelength calibrated sky spectra. Where needed small shifts of up to one pixel ( Å) were applied to our galaxy observations.
The next step is to correct the observations for telluric absorption lines, which are especially deep at the blue end of the K-band. These spectral lines may vary with time and position on the sky. For each observing block, one solar-type telluric standard star at a similar air-mass was observed. Each telluric star was divided by a scaled and Gaussian broadened solar spectrum to match the resolution of our observations. In this way we removed the spectral features typical for solar type stars as well as ensuring a relative flux calibration. The last step before applying the telluric correction was to scale and shift the telluric spectrum for each individual data cube by a small amount ( 0.5 pix) to minimise the residuals of the telluric lines (for details of the procedure see Silva, Kuntschner & Lyubenova 2008). Finally, each data cube for the galaxy and velocity template stars was divided by the optimised telluric spectrum to yield fully calibrated data.
In order to achieve the best signal-to-noise ratio we combined four individual data cubes (OB ID: B, C, D, E). For this purpose we identified the centre of the galaxy in each data cube with an accuracy of one pixel (″) and re-centred them. The final combination was performed using a sigma-clipping pixel reject algorithm.
The next step was to spatially bin the final data cube to a roughly constant signal-to-noise ratio which allows us to measure reliable kinematics and line strengths. This was done using the adaptive binning method of Cappellari & Copin (2003). Using our velocity template stars we first performed Monte Carlo simulations to determine the minimum S/N needed to recover the higher order moments and of the line-of-sight velocity distribution (LOSVD) to a precision of about 0.04. This also means that the recession velocity and velocity dispersion can be recovered with an error of about 17 . This accuracy is comparable with or better than what was achieved in previous studies, while we also preserve a good spatial resolution. For our data set and the spectral region 2.2 - 2.3 m we found that a S/N of about 100 is needed (see also Section 3.1). The resulting bins have a typical size of 015 (5-6 spaxels combined) in the central regions, and approximately 02 (10 spaxels combined) for radii 1″. Bins which contain more than 30 spaxels (a few bins at the edges of the field of view) are excluded from the analysis, because of higher systematic effects, and are marked with black colour on the kinematical and line strength maps. During the binning procedure we derive pseudo error spectra by determining the standard deviation at each wavelength. While this procedure is not fully correct since not all spaxels in a given bin are independent (e.g., seeing effects) it takes into account other error sources such as sky-subtraction and telluric correction residuals.
2.3 Effective spatial resolution
A key parameter to characterise our data is the effective spatial resolution, which was achieved in the combined data cube before binning. Direct measurements of the effective point spread function were not obtained during the nights of our observations. Therefore, we estimate the effective seeing in two other ways.
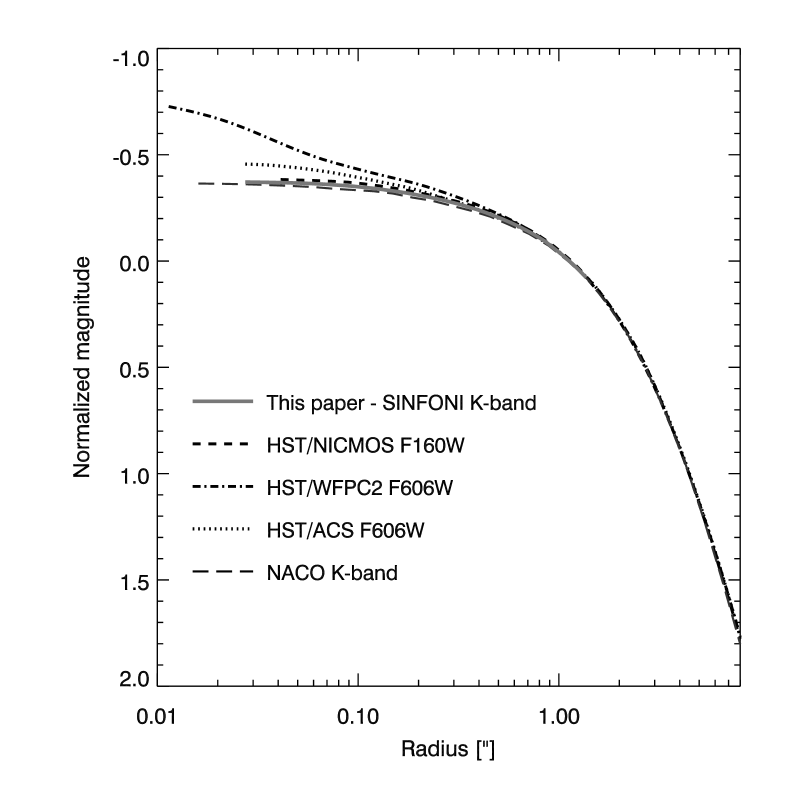
First, we compared the reconstructed and radially averaged luminosity profile from our data cube with the results from a HST/NICMOS image (GO 7453, PI Tonry; camera NIC2, sampled at 00755 per pixel). We found that the two luminosity profiles agree very well even without any further broadening of the NICMOS data suggesting roughly similar PSF sizes with a FWHM (see Fig. 1).
Secondly, we independently confirmed the above estimate from our own data cube by measuring the FWHM of a point source like object (presumably a globular cluster) located at about 145 south-east from the NGC 1399 nucleus. Globular clusters at the distance of the Fornax cluster might be extended. However, here we assume it to be a point source and thus obtain a conservative estimate for the seeing. A simple Gaussian fit yields a FWHM , very much in agreement with the results from the comparison of the luminosity profiles.
We conclude that the effective spatial resolution of our data can be described with having a FWHM of about 015.
3 Kinematics
In this section we present our kinematical analysis of the central region of NGC 1399. Our K-band IFU spectroscopy is used to probe the velocity profile of the galaxy’s centre to HST like spatial resolution.
3.1 Extraction of the kinematics and comparison with earlier studies
The extraction of the kinematical information from the final galaxy data cube was performed with the help of the Penalised Pixel-Fitting method (pPXF) developed by Cappellari & Emsellem (2004). The success of this method relies on the provision of a good set of template spectra, which match the galaxy spectra as well as possible. We found that the template stars observed in conjunction with the NGC 1399 observations (covering K4III to K7III) did not yield fully satisfactory fits and thus we searched the VLT/SINFONI archive for further template stars particularly covering later spectral types. We found three suitable stars with spectral type M0III, M5III and M5II-III. Fully reduced spectra were kindly provided by M. Cappellari (private communication). In our final analysis seven velocity template stars (see Table 2) were used in the fitting procedure to determine the recession velocity, velocity dispersion and the and Gauss-Hermit coefficients for each bin in the data cube.
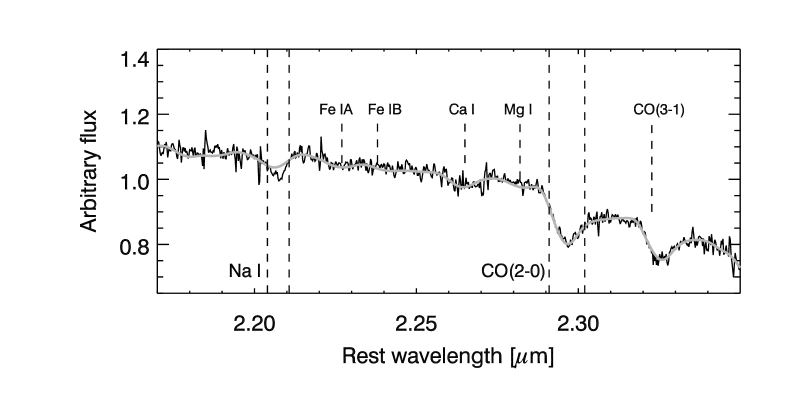
The fitting was performed in the spectral range between 2.18 m and 2.35 m where several prominent absorption features allow fitting (see Fig. 2). However, we excluded the region 2.20 m– 2.22 m (around the Na I feature), because none of the template stars was able to match the strength of the Na I absorption in NGC1399. This is not surprising, since Silva et al. (2008) showed that the Na I absorption strength is typically stronger in early-type galaxies compared with Galactic open cluster stars. In the fitting procedure typically only 3-4 stars were used to achieve a good fit over the full wavelength extent. The stars which received the highest weighting were of spectral type M0III and M5III.
We derive one-sigma error estimates from the pPXF code, based on our error spectra (see Sect. 2.2). The validity of our error spectra is confirmed since the reduced values derived by the code were typically close to unity. Furthermore, we performed an empirical error estimation by assuming spherical symmetry in the galaxy and deriving the standard deviation for v, , and measurements in a ring of radius 08 to 1″. The errors derived with this procedure agree well with the pPXF internal error estimates and are 17.2 , 19.4 , 0.03 and 0.05 for v, , and , respectively.
The kinematics of NGC 1399 have been studied several times in the past using long-slit spectroscopy, mainly for the purpose of determining the mass of the super-massive black hole in its centre. Velocity dispersions as high as 450 make this galaxy an extreme and very interesting case in the -black hole mass relation (Ferrarese & Merritt 2000; Gebhardt et al. 2000).
Saglia et al. (2000) used ground based optical observations and reported little rotation ( 30 ) and compatibility with the presence of a central black hole of M 5 108 M⊙. Houghton et al. (2006) studied NGC 1399 with ground based adaptive optics assisted observations in the near-IR using the ESO VLT instrument NACO. Their analysis reveals a kinematically decoupled core and double-peaked velocity dispersion across the centre. The modelling requires a central black hole with M 1.2 109 M⊙ and a strongly tangentially biased orbit distribution. The most recent study is the one by Gebhardt et al. (2007). They analysed HST/WFPC2 optical imaging and HST/STIS spectroscopy in combination with the Saglia et al. (2000) data. They see a dramatic increase in the velocity dispersion at about 05 on both sides of the galaxy and a central drop, which they interpret as tangentially biased orbital distribution. Their best fit model requires a black hole with mass 108 M⊙.
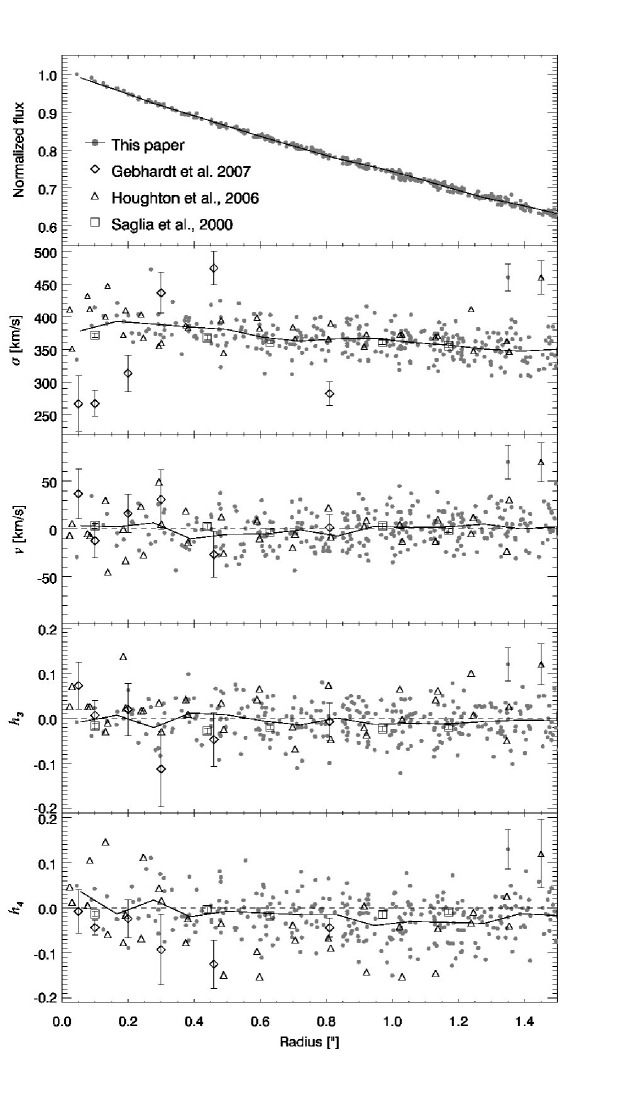
In Fig. 3 we show our kinematical measurements together with data from previous studies. We use radial plots for this first-order comparison, since the observations in the earlier studies were obtained with long-slits at different position angles (110° in Saglia et al. (2000), 117° in Gebhardt et al. (2007) and 5.06° in Houghton et al. (2006)). We plot data from the full two-dimensional region covered by our observations.
For radii 03 we find in general good agreement between our measurements and previously published results. However, we cannot confirm the large negative values seen by Houghton et al. (2006) although we also measure negative values at these radii. We also cannot confirm the velocity dispersion measurements of Gebhardt et al. (2007) for their two outermost data points.
For radii 02 our measurements appear to be between the measurements of Houghton et al. (2006) and Gebhardt et al. (2007). Although the studies do not agree well for the inner velocity dispersion gradient, all three of them show a pronounced drop in the very centre. In this comparison the HST/STIS data probably have the best spatial resolution (; Gebhardt et al. (2007)), however, even accounting for seeing differences it is difficult to reconcile the data sets. Similarly, we cannot find any evidence in our data for the extreme, positive values seen in the Houghton et al. (2006) study.
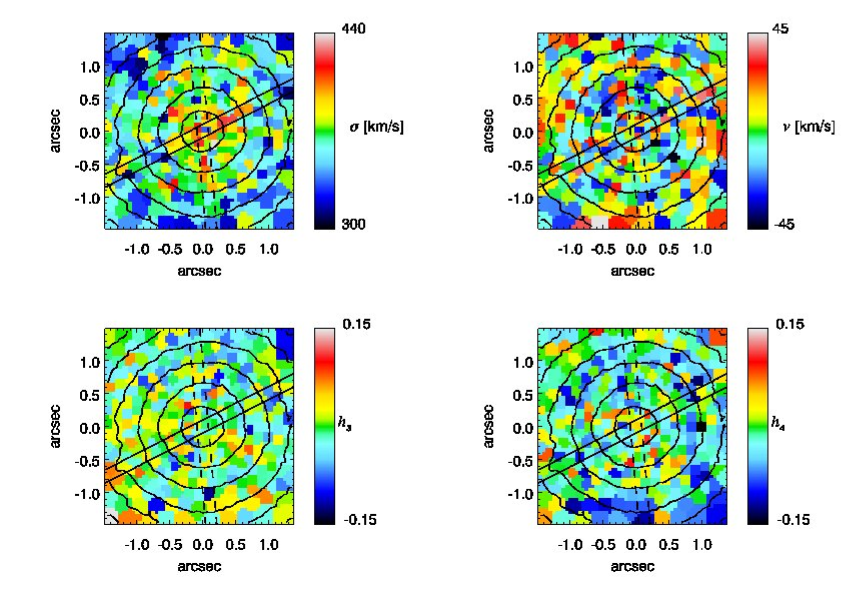
3.2 Kinematical maps
Given that we have full two-dimensional kinematic maps, we can explore if there is a more complex kinematical structure in the centre of NGC 1399, which might explain the measurement differences reported above. In Fig. 4 we present our maps of , , and . We also overplot the slit orientations and widths of Houghton et al. (2006) and Gebhardt et al. (2007) studies for better illustration. The Saglia et al. (2000) slit covers almost our full field of view, thus it is not shown in Fig. 4
The velocity dispersion map shows rising values towards the centre with a distinct drop in the middle. However, the inner 05 appear to be asymmetric, and show three peaks to the north-east, south-east and west of the centre. Fig. 4 shows that the Gebhardt et al. (2007) slit intersects two of the high- features, which can potentially explain the disagreement with Houghton et al. (2006), whose slit does not cover any of them. If confirmed, the velocity dispersion structures presented in this work may imply the need for more detailed dynamical modelling for the nuclear parts of the galaxy.
Our velocity map does not show any significant ordered motion within our errors (17 ). The map is consistent with a value of zero and thus no structure, while the map is mildly positive in the very centre and mostly negative for radii 04.
4 Near-IR line strengths
In this section we discuss the two-dimensional distribution of two near-IR absorption features – Na I close to 2.2 m and CO (2–0) at 2.3 m (see Fig. 2) – at a spatial resolution and scale only accessible by HST observations in the past.
4.1 Index definitions and measurements
Index definitions for Na I and CO (2–0) were taken from Frogel et al. (2001). The line strength of Na I is measured in Å, identical to the method used by the optical indices in the Lick/IDS system (Worthey et al. 1994), where the central bandpass is flanked to the blue and red by pseudo-continuum band passes. CO (2–0) is measured in a similar way but due to the lack of a well defined continuum on the red side of the CO feature, Frogel et al. (2001) define four pseudo-continuum band passes on the blue side. Thus the continuum used to derive the value of the CO (2–0) index is an extrapolation from the blue wavelength region.
The observed spectrum of a galaxy is the convolution of the integrated spectrum of its stellar population(s) by the instrumental broadening and line-of-sight velocity dispersion (LOSVD) of the stars. These effects broaden the spectral feature and in general reduce the observed line strength compared to the intrinsic value. In order to compare our observations with other studies, often obtained with different instruments, and eventually with population synthesis models, one needs to calibrate the data to a common system. Since an averaged spectrum of the observations reported in this study was already used in the Silva et al. (2008) VLT/ISAAC study of early-type galaxies, we decided to use that spectral resolution here as well. Therefore, all galaxy spectra were broadened to a spectral resolution of 6.9 Å (FWHM) matching the resolution of ISAAC in the K-band.
Using our measurements of the velocity for each bin (see Sect. 3.1) we can determine line strength values. However, before we can analyse the line strength maps we need to account for line broadening due to the internal motion of stars in the galaxy. In order to compare the index measurements for regions with different LOSVD or between different galaxies, we calibrate the indices to a zero velocity dispersion. Our LOSVD corrections were derived by broadening the velocity template stars to velocity dispersions ranging up to 440 and , values between and . For each index we parametrised the LOSVD corrections following the method by Kuntschner (2004). Using our own kinematical measurements we calculated for each bin and index a correction factor which is applied to the raw line strength measurements. At (, ) the correction factor is 1.53 and 1.16 for Na I and CO (2–0), respectively. The typical error on the correction factor as derived from the differences between the template stars is 3.3% for Na I and 1.3% for CO (2–0).
Using our error spectra we compute index errors via Monte Carlo simulations, where we take into account photon noise, recession velocity errors, and LOSVD correction errors. Following the procedure applied for the kinematics (see Sect. 3.1) we also derive empirical error estimates by computing the standard deviation of index values in a region with radius between 08 and 1″. For the Na I index, the empirical estimate is 0.5 Å, and thus slightly higher than our internal estimate of 0.38 Å. For the CO (2–0) index we find a much larger difference with an empirical error of 0.6 Å as compared to 0.17 Å for the internal value. Line strength indices can be very sensitive to continuum shape effects, especially if they cover large wavelength ranges as is the case for the CO (2–0) index. We consider this the main reason for increased errors (see also Silva et al. 2008). In the following we adopt the empirical error estimates in our analysis.
Silva et al. (2008) present a more complete set of spectral features in the K-band, including the Ca I and two Fe indices (see Fig. 2). Here we will not discuss these additional, weak features, because our chosen SNR per bin in combination with the very high velocity broadening of NGC 1399 makes them very difficult to measure.
4.2 Line strength maps
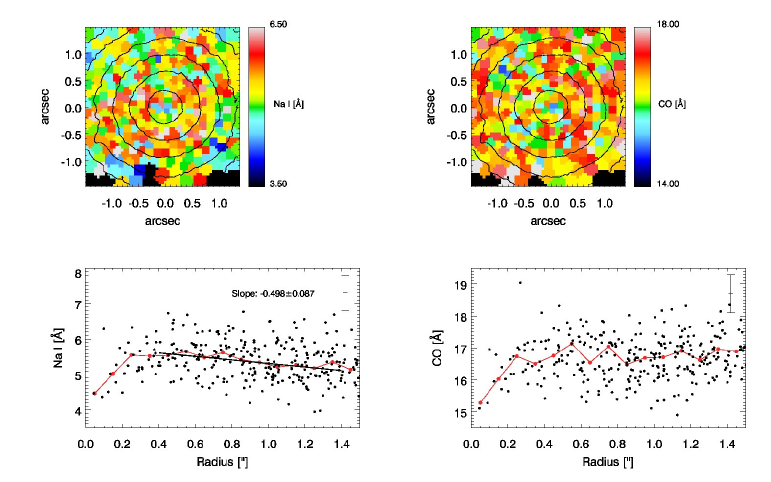
In Fig. 5 we show the distribution of Na I and CO (2–0) over the central of NGC 1399. In the central 02 we see a well pronounced drop of about 1 Å and 1.5 Å in Na I and CO (2–0), respectively. Below the maps we show the radial distribution of both indices for better illustration. The red line shows the median value of each index in 01 wide bins. We note, that Houghton et al. (2006) also found some evidence for a central CO drop in their data, although their measurements were not conclusive. Outside the nuclear region we find evidence for line strength gradient in Na I. The index decreases with radius with a slope of within 04 and 14 (the Spearman correlation coefficient is with a probability of 0.09% that there is no correlation). The linear fit to the data is overplotted in Fig. 5. For CO (2–0) we do not find a significant line strength gradient over the observed radial range.
5 Discussion of the central velocity dispersion and line strength drops
In this section we will discuss the significance of the central and line strength drops we described in Section 3.2 and 4.2 and explore a few possible scenarios that could explain their origin.
5.1 Technical aspects
Firstly, we investigate the statistical significance of the central drops in absorption strength of the Na I and CO (2–0) indices. Using a two-dimensional Kolmogorov-Smirnov test we can reject the null-hypothesis that the innermost five data points () are drawn from the same distribution as the data points between 03 and 1″ with a significance level of 3.4% and 0.4% for the Na I and CO (2–0) indices, respectively. While for the Na I index the significance is only marginal, both index drops taken together are believable. Another test we performed is to fit a simple two component model, where we fit the data with two linear functions with a break radius at . The steep slopes measured for the central component are different from zero at four and nine sigma level for the Na I and CO (2–0) indices, respectively.
Secondly, we explore the possibility that the line strength drops could be caused by wrong kinematics (e.g., too low velocity dispersion) which would lead to wrong (e.g., too low) LOSVD corrections. Due to the large velocity broadening seen in the centre of NGC 1399 we have to apply significant LOSVD corrections (see Sect. 4). However, even if we assume the extreme case of a LOSVD ( , and ) constant with radius we still find highly significant drops for both indices.
In summary we find that the line strength drops are significant at least at the 3- level and are unlikely to be produced by technical/calibration problems or by a chance statistical effect. Furthermore the observed features in the velocity dispersion and line strengths are present also when one performs the same analysis with the individual data cubes before combination, although the noise level raises.
5.2 Astrophysical explanations
Central velocity dispersion drops have so far been observed mainly in spiral galaxies (e.g. Bottema & Gerritsen 1997; Emsellem et al. 2001; Márquez et al. 2003; Falcón-Barroso et al. 2006). -drops have also been found in a few early type galaxies (e.g. Graham et al. 1998; Simien & Prugniel 2002; Pinkney et al. 2003; Emsellem et al. 2004). For spiral galaxies Wozniak et al. (2003) suggested that these -drops are the result of gas accretion followed by star formation and are therefore indicative of a recent in-fall of dissipative material. In a follow up study Wozniak & Champavert (2006) showed that the life time of such -drops can be long ( 1 Gyr), however this requires continuous star formation in the nuclear region at least on a level of . Without continued star-formation, the amplitude of the -drops decreases rapidly.
Velocity dispersion drops were found in about half of the sample of spiral galaxies, studied by Peletier et al. (2007). Their stellar populations analysis, however, shows that the ages of these inner components are not significantly younger than the centres of spiral galaxies without -drops as would be expected from the above scenario. This may indicate that the central, dynamically cold components can be more long lived.
Typically the observed -drops in spiral galaxies have spatial scales of a few hundreds parsecs. For NGC 1399 such a large scale -drop is not observed (Graham et al. 1998). The -drop we observe in NGC 1399 has a diameter of only 30 pc (corresponding to 03). Similar size -drops have been seen with HST/STIS spectroscopy in the elliptical galaxies NGC 4649 and NGC 4697 by Pinkney et al. (2003) indicating that these small scale drops may be a more wide spread phenomenon in early-type galaxies.
On the basis of their dynamical modelling Gebhardt et al. (2007) state that NGC 1399 possesses extremely tangentially biased orbital distribution for radii between 01 and 05 which is responsible for the -drop, consistent with the findings of Houghton et al. (2006). Both studies explore various possibilities for the progenitor of these extreme orbits, ranging from nuclear activity, an eccentric disc, a torus to a stellar cluster having fallen in on a purely radial orbit.
We can empirically test the hypothesis for the presence of a low velocity dispersion subsystem in the nucleus of NGC 1399 causing the -drop. We performed simple simulations by combining an averaged galaxy spectrum taken at radii between 02 and 03 ( ) with a velocity template star, broadened to velocity dispersions from 15 to 150 and a range of luminosity weightings. We can reproduce our measurements for the inner 015 of NGC 1399 ( 360 and positive ) with 15% of the light originating from a central stellar subsystem with up to 100 . Using the surface brightness profile of NGC 1399 (e.g. from Gebhardt et al. 2007) we can estimate the surface brightness of such a subsystem. We find that a central, low velocity dispersion ( ) stellar subsystem with is able to explain the central drop in velocity dispersion for NGC 1399. Such a V-band luminosity is comparable to the brightest globular clusters in NGC 1399 or bright nuclei of dwarf galaxies in the Fornax cluster (e.g. Dirsch et al. 2003; Mieske et al. 2006).
If such a subsystem is present in the nucleus, we can expect that it will not have the same stellar population properties as the underlying galaxy since it might have been formed in different time scales, under different physical conditions or in a different environment. Thus we can expect that it will have some influence on the line strengths in the same region. Indeed, as shown in Sect. 4.2, we find line strength changes with the same extent as the -drop. Nevertheless, index changes might be due to different reasons than stellar population effects. A plausible explanation for the reduced line strengths of Na I and CO (2–0) in the central regions could be the presence of nuclear activity causing the continuum level to be raised. Oliva et al. (1999) show that the nuclear continuum in the near-IR spectral domain in galaxies with active galactic nuclei (AGN) is mainly due to reprocessed radiation, coming from the AGN UV-continuum heated dust. This radiation has a black body spectrum with temperatures typically between 100 and 1000 K. O’Connell et al. (2005) report an ultraviolet light outburst in the nucleus of NGC 1399 with a maximal far-UV luminosity of erg s-1 reached in January 1999. Thus they claim NGC 1399 to harbour a low-luminosity active galactic nucleus (LLAGN). We tested this hypothesis by subtracting black body spectra with different temperatures in the above mentioned range from our innermost spectra with the goal to match the line strengths seen at radii 02. The results from this test were unfavourable for a scenario in which the LLAGN induced non-stellar continuum causes the observed line strength changes, since we were unable to model the index changes for both Na I and CO (2–0) simultaneously with one single black body spectrum of a given temperature. We can go even further and force the indices to drop by the right amount by subtracting a continuum with a very steep slope (in comparison with the already mentioned black body spectra). However, when we use this steeper slope to match the index drops, the effective velocity dispersion measured from such a spectrum ( = 384 ) does not agree well with our results from Sect. 3.1. Moreover, the resulting spectrum does not resemble the observed central galaxy spectrum (i.e. different continuum shape and slope), which it is supposed to model. Therefore, we conclude that the presence of an AGN-like continuum is not very likely to be the reason for the central line strength and velocity dispersion changes observed in NGC 1399.
Coming back to the stellar population issue it is very interesting to note that the Gebhardt et al. (2007) imaging data of NGC 1399 (HST/WFPC2 PC chip) show a blue nucleus () with weak evidence for a central light excess at the same radii (see Fig.1). Their (B – V) colour drops by about 0.1 mag in comparison with the surrounding region, which appears to be constant in colour (their Figure 1, bottom panel). Recent HST/ACS observations of NGC 1399 in and bands (Côté et al. 2007, also Andres Jordán, private communication) show very weak evidence for a central light excess and also very mild evidence for a bluer colour, but exhibit prominent PA and ellipticity changes within consistent with the HST/WFPC2 data. We note, that the core region of NGC 1399 with a break radius of about 2″ (see Fig. 1) is much larger than the scales discussed here.
The information from the imaging, combined with the observed and line strength drops at similar radii provide good evidence for the scenario of a central dynamically cold stellar subsystem with different stellar populations as compared to the surrounding galaxy.
Until stellar population models in the near-IR become available we can only perform a limited stellar population analysis by using the empirical relations found in the Silva et al. (2008) study (their Figure 14). For early-type galaxies with old stellar populations they found a good linear correlation between the Na I index and the optical metallicity indicator [MgFe]′ as well as CO (2–0) and [MgFe]′. If the central index drops are caused by a metallicity change alone (i.e. lower metallicity), we would expect to see near-IR index changes consistent with the relations seen in Silva et al. (2008). However, this is not the case. The index change seen for Na I is much too weak compared to CO (2–0), or vice versa. Silva et al. (2008) show also that centres of Fornax ellipticals with optical signatures of a younger population (i.e. strong H, indicating luminosity weighted ages of around 2 Gyr) have a stronger Na I index in comparison with old galaxies at the same central velocity dispersions. Also CO (2–0) is expected to increase for intermediate ages ( 1-2 Gyr) since the fraction of thermally pulsating asymptotic giant branch stars near or above the tip of the first ascent giant branch goes up (Maraston 2005, and references therein). A scenario which is then more consistent with the empirical relations from Silva et al. (2008) is a drop in metallicity combined with a younger age where the Na I index reacts stronger to the age change than the CO (2–0) index. Alternatively, one can consider – in addition to a drop in metallicity, abundance ratio differences between the main body of NGC 1399 and the proposed central stellar subsystem, which would explain the relative changes of CO (2–0) and Na I. While a combination of metallicity, age and abundance ratio changes are an attractive explanation for the observed line strength maps, a confirmation of the above scenarios clearly awaits the more detailed predictions of stellar population models.
6 Concluding remarks
In this paper we present for first time high spatial resolution K-band maps for the kinematical and near-IR spectral properties of the centre of the giant cD galaxy in the Fornax cluster, NGC 1399. We confirm the presence of a central velocity dispersion dip within previously seen in the long-slit studies of Houghton et al. (2006) and Gebhardt et al. (2007). Our velocity dispersion map gives evidence for a non-symmetric structure towards the centre by showing three peaks to the north-east, south-east and west of the galaxy centre. Such a complex structure in the velocity dispersion has not been seen earlier in other early-type galaxies. The west – south-east peaks seem to be symmetric about the galaxy centre, while the north-east peak is essentially off-centred, nevertheless within our error analysis we consider it to be real. We note that the nuclear region of NGC 1399 does not seem to be obscured by dust (Andres Jordán, private communication).
Additionally we measure two near-IR line strength indices at unprecedented spatial resolution. The most important features we observe in our 2-dimensional line strength maps are drops in Na I and CO (2–0) line strength in the nuclear region of the galaxy, coinciding spatially with the drop in .
As an explanation for the line strength and velocity dispersion drops observed in the central region we discuss a scenario where NGC 1399 harbours a dynamically cold subsystem with a distinct stellar population. Dynamically this can be realised by a central stellar disc or a globular cluster (even a dwarf galaxy) having fallen into the centre of NGC 1399 on a purely radial orbit (Gebhardt et al. 2007). The near-IR index changes observed in our data suggest that the spectral properties of this subsystem are directed by some mixture of metallicity, age and abundance ratios effects. More precise constraints on the nature of the stellar population within this cold component awaits more detailed stellar population models.
Acknowledgements.
We would like to thank the Garching and Paranal astronomers who provided support during the SINFONI Science Verification runs. Special thanks go to Ryan Houghton for valuable help on preparing the observations and providing us with the NGC 1399 NACO luminosity profile. We are especially grateful to Michele Cappellari for supporting our project with additional velocity template stars. The comparison between different kinematics studies in NGC 1399 could not have been possible without assistance from Roberto Saglia and Karl Gebhardt. We also would like to thank Andrea Modigliani for valuable help with the SINFONI pipeline and Karina Kjær for multiple discussions on 3D spectroscopy data reduction. Finally, we thank the anonymous referee for his/her important suggestions which certainly made this paper more complete.References
- Bonnet et al. (2004) Bonnet, H., Abuter, R., Baker, A., et al. 2004, in The ESO Messenger, Vol. 117
- Bottema & Gerritsen (1997) Bottema, R. & Gerritsen, J. P. E. 1997, MNRAS, 290, 585
- Cappellari & Copin (2003) Cappellari, M. & Copin, Y. 2003, MNRAS, 342, 345
- Cappellari & Emsellem (2004) Cappellari, M. & Emsellem, E. 2004, PASP, 116, 138
- Côté et al. (2007) Côté, P., Ferrarese, L., Jordán, A., et al. 2007, ApJ, 671, 1456
- Côté et al. (2006) Côté, P., Piatek, S., Ferrarese, L., et al. 2006, ApJS, 165, 57
- Dirsch et al. (2003) Dirsch, B., Richtler, T., Geisler, D., et al. 2003, AJ, 125, 1908
- Eisenhauer et al. (2003) Eisenhauer, F., Abuter, R., Bickert, K., et al. 2003, in Proceedings of the SPIE, ed. M. Iye & A. F. M. Moorwood
- Emsellem et al. (2004) Emsellem, E., Cappellari, M., Peletier, R. F., et al. 2004, MNRAS, 352, 721
- Emsellem et al. (2001) Emsellem, E., Greusard, D., Combes, F., et al. 2001, A&A, 368, 52
- Falcón-Barroso et al. (2006) Falcón-Barroso, J., Bacon, R., Bureau, M., et al. 2006, MNRAS, 369, 529
- Ferrarese & Merritt (2000) Ferrarese, L. & Merritt, D. 2000, ApJ, 539, L9
- Frogel et al. (2001) Frogel, J. A., Stephens, A., Ramírez, S., & DePoy, D. L. 2001, AJ, 122, 1896
- Gebhardt et al. (2000) Gebhardt, K., Bender, R., Bower, G., et al. 2000, ApJ, 539, L13
- Gebhardt et al. (2007) Gebhardt, K., Lauer, T. R., Pinkney, J., et al. 2007, ApJ, 671, 1321
- Graham et al. (1998) Graham, A. W., Colless, M. M., Busarello, G., Zaggia, S., & Longo, G. 1998, A&AS, 133, 325
- Houghton et al. (2006) Houghton, R. C. W., Magorrian, J., Sarzi, M., et al. 2006, MNRAS, 367, 2
- Kormendy & Richstone (1995) Kormendy, J. & Richstone, D. 1995, ARA&A, 33, 581
- Kuntschner (2004) Kuntschner, H. 2004, A&A, 426, 737
- Maraston (2005) Maraston, C. 2005, MNRAS, 362, 799
- Márquez et al. (2003) Márquez, I., Masegosa, J., Durret, F., et al. 2003, A&A, 409, 459
- Mieske et al. (2006) Mieske, S., Hilker, M., Infante, L., & Jordán, A. 2006, AJ, 131, 2442
- Modigliani et al. (2007) Modigliani, A., Hummel, W., Abuter, R., et al. 2007, ArXiv Astrophysics e-prints
- O’Connell et al. (2005) O’Connell, R. W., Martin, J. R., Crane, J. D., et al. 2005, ApJ, 635, 305
- Oliva et al. (1999) Oliva, E., Origlia, L., Maiolino, R., & Moorwood, A. F. M. 1999, A&A, 350, 9
- Peletier et al. (2007) Peletier, R. F., Falcón-Barroso, J., Bacon, R., et al. 2007, MNRAS, 379, 445
- Pinkney et al. (2003) Pinkney, J., Gebhardt, K., Bender, R., et al. 2003, ApJ, 596, 903
- Saglia et al. (2000) Saglia, R. P., Kronawitter, A., Gerhard, O., & Bender, R. 2000, AJ, 119, 153
- Silva et al. (2008) Silva, D., Kuntschner, H., & Lyubenova, M. 2008, ApJ, 674, 194
- Simien & Prugniel (2002) Simien, F. & Prugniel, P. 2002, A&A, 384, 371
- Wehner & Harris (2006) Wehner, E. H. & Harris, W. E. 2006, ApJ, 644, L17
- Worthey et al. (1994) Worthey, G., Faber, S. M., Gonzalez, J. J., & Burstein, D. 1994, ApJS, 94, 687
- Wozniak & Champavert (2006) Wozniak, H. & Champavert, N. 2006, MNRAS, 369, 853
- Wozniak et al. (2003) Wozniak, H., Combes, F., Emsellem, E., & Friedli, D. 2003, A&A, 409, 469