Effect of static and dynamic disorder on electronic transport of RCo2 compounds: a study of Ho(AlxCo1-x)2 alloys
Abstract
We present experimental results on thermoelectric power (S) and electrical resistivity () of pseudobinary alloys Ho(AlxCo1-x)2 (), in the temperature range 4.2 K to 300 K. The work focuses on the effects of static (induced by alloying) and dynamic (induced by temperature) disorder on the magnetic state and electronic transport in a metallic system with itinerant metamagnetic instability. Spatial fluctuations of the local magnetic susceptibility in the alloys lead to the development of a partially ordered magnetic ground state of the itinerant 3d electron system. This results in a strong increase of the residual resistivity and a suppression of the temperature-dependent resistivity. Thermopower exhibits a complex temperature variation in both the magnetically ordered and in the paramagnetic state. This complex temperature variation is attributed to the electronic density of states features in vicinity of Fermi energy and to the interplay of magnetic and impurity scattering. Our results indicate that the magnetic enhancement of the Co 3d band in RCo2–based alloys upon a substitution of Co by non-magnetic elements is mainly related to a progressive localization of the Co – 3d electrons caused by disorder. We show that the magnitude of the resistivity jump at the Curie temperature for RCo2 compounds exhibiting a first order phase transition is a non-monotonic function of the Curie temperature due to a saturation of the 3d–band spin fluctuation magnitude at high temperatures.
pacs:
71.27.+a, 72.15.Gd, 72.15.Jf, 75.10.Lp, 75.30.KzHoCo2 belongs to the family of intermetallic RCo2 cubic Laves phases (R stands for rare earth elements) which are well known for their outstanding magnetic properties associated with itinerant 3d electron subsystem Lemaire66 ; Levitin88 ; Gratz95 . Long-range magnetic order of the 3d electron subsystem of paramagnetic YCo2 and LuCo2 can be induced by external magnetic field exceeding a certain critical value . This critical field was found to be about 70 T for YCo2 Goto89 and about 77 T for LuCo2 Goto90 . Partial replacement of cobalt by aluminium leads to a decrease of and to the appearance of weak itinerant ferromagnetism in Y(AlxCo1-x)2 for 0.12 Aleksandryan85 ; Yoshimura85 . In the case of magnetic RCo2 compounds, long-range magnetic order of the 3d electron subsystem is induced by ordering of the localized magnetic moments of the rare earths. A substitution of Al on Co-sites of the magnetic RCo2 compounds, results in a considerable increase of the Curie temperature Aleksandryan84 .
This behavior was interpreted within the framework of the itinerant magnetism by an increase of the density of states (DOS) at the Fermi level as Co is replaced by Al. However, the mechanism, responsible for the increase of DOS at the Fermi level, remains obscure. Mainly two scenarios have been proposed: in the first, DOS increases due to de-population of 3d-Co band when Co is replaced by Al Aleksandryan85 ; Ballou93 ; in the second, the DOS increase is caused by a narrowing of the 3d band due to an expansion of the crystal lattice in the alloys Yoshimura85 ; Ishiyama86 .
In the present work we use the temperature dependent thermopower to study the mechanism of the DOS enhancement in Al-substituted RCo2 compounds. It has been shown that high-temperature minimum, observed in of nearly all RCo2 compounds in a range from 150 K to 400 K, is associated with a sharp peak in the density of states related mainly to the Co 3d-electron density rem1 . Particularly, it was shown that the temperature , at which the thermopower has this minimum, is a measure of the DOS peak width Burkov88 ; Gratz95 .
Another unsolved problem, related to metamagnetism and charge transport in RCo2 compounds is the different order of the phase transition at Curie temperature () and a non-monotonic variation of the resistivity jump () at . Among the RCo2 compounds, ErCo2, HoCo2 and DyCo2 undergo a first order phase transition at , whereas it is generally accepted that in TbCo2, GdCo2, TmCo2 and SmCo2 the magnetic ordering is via second order transition. The kind of the phase transition at in PrCo2 and NdCo2 has been a subject of recent discussion forker2003 ; forker2007 ; herrero2006 ; herrero2007 . In this context the Ho(AlxCo1-x)2 alloys are proper materials to study, since this alloy system includes compounds with both, first order, and second order transition at .
I Experimental procedures
The samples of Ho(Co1-xAlx)2 alloys were prepared from pure components by melting in an induction furnace under a protective Ar atmosphere and were subsequently annealed in vacuum at 1100 K for about one week. The X-ray analysis showed no traces of impurity phases.
A four–probe dc method was used for the electrical resistivity measurements; for the thermopower measurements a differential method was applied. Typical size of the samples was about 1 1 10 mm3. The estimated error in the absolute value of the electrical resistivity is 10%. This is mainly due to uncertainty in the sample geometry which is closely related to the mechanical quality of the samples. The thermopower was measured with an accuracy of 0.2 VK-1.
II Experimental results.
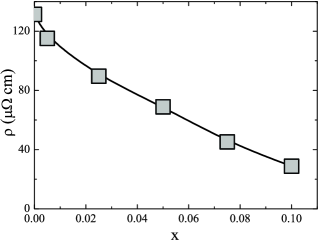
The resistivity temperature dependencies are depicted in Figure 1. The residual resistivity, shown in the inset, rapidly increases with Al content. Simultaneously, the temperature dependent part of the resistivity decreases, so that the high temperature total resistivity shows a comparatively small change with composition. Room temperature values are in the range of 130 to 150 cm.
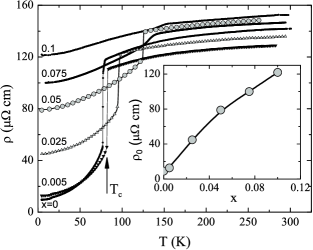
The Curie temperature is marked by an abrupt change of the resistivity of the samples with =0, 0.005, 0.025, and 0.05, whereas samples with =0.075 and 0.1 clearly show a second order-like variation of the resistivity at . Data of Fig. 1 indicate that the boundary between first-order and second-order transitions is between =0.05 and =0.075. These results agree with the data of Duc et al. Duc92 .
Figure 2 presents experimental results for the thermopower from 5 K to 300 K. Dramatic changes of with the alloy composition are clearly seen in both, the paramagnetic and in the magnetically ordered state of the alloys. At high temperatures the minimum temperature , observable for pure HoCo2 at 250 K, and the absolute values decrease with increasing Al content. In the low temperature region, (), is also strongly dependent on the Al-content.
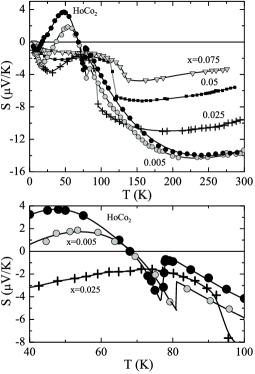
At the lowest temperatures all compounds exhibit a minimum with negative values; its temperature gradually increases with Al concentration. The minimum, as well at the following maximum, become suppressed for =0.05 and they almost disappear for =0.075. The Curie temperatures are associated with the discontinuous changes of for =0, 0.005, 0.025, whereas the sample with =0.075 clearly shows a second order-like variation of the thermopower at .
III Discussion.
III.1 Variation of the 3d-DOS upon substitution of cobalt by non-magnetic elements.
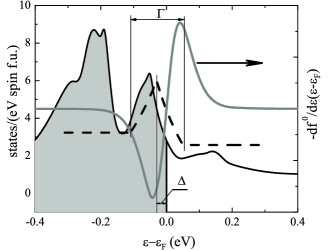
The temperature variation of the thermopower in the paramagnetic temperature region can be understood within the model proposed in Burkov88 ; Burkov93 ; Gratz95 . Calculations of the density of states, for YCo2 Cyrot79 ; Yamada84 ; Yamada88 ; Tanaka98 revealed the Fermi level, , lying near a sharp peak of DOS, primarily composed of 3d states of Co (Figure 3).
Since Co is present in all RCo2 compounds, it is assumed, that has the same general features throughout the RCo2 series.
It has been shown that the high-temperature minimum, observed in of nearly all RCo2 compounds (with the exception of GdCo2, DyCo2, and SmCo2 where falls into the temperature range where these compounds order magnetically), is associated with the 3d peak of the DOS, being the measure of the peak width Gratz95 ; Burkov88 .
Since the width of an itinerant electronic band depends on the extent of the corresponding atomic orbital overlapping, one should expect that the 3d peak width increases when the lattice parameter decreases. The lattice parameter within RCo2 compounds reveals considerable variation, being smallest for ScCo2 and largest for NdCo2. This implies that the 3d DOS peak width is largest in case of ScCo2 and smallest for NdCo2 with corresponding variation of . This assumption has been confirmed by a good correlation between and the lattice constants of the RCo2 compounds Gratz95 . Figure 4a reproduces, in part, this correlation.
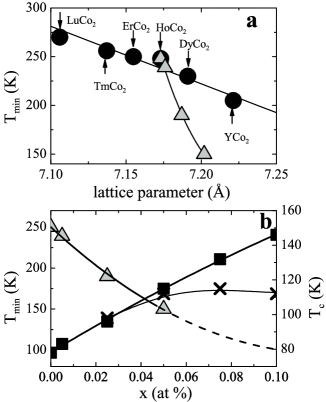
The decrease of with increasing Al content in Ho(Co1-xAlx)2 alloys (Fig. 4b) indicates a narrowing of the 3d DOS peak. Partially this narrowing can be connected with the increase of the lattice parameter in the alloys. However, the expansion of the crystal lattice is insufficient to entirely account for the narrowing of the DOS peak and the observed increase of the Curie temperature. If the decrease of was related only to the lattice expansion, then one would expect that in the alloys decreases roughly at the same rate as in pure RCo2 compounds. However, the results for Ho(Co1-xAlx)2 reveal a much stronger dependence of on the lattice parameter (Fig.4a), implying that some additional factor is responsible for the narrowing of the peak width and increase of .
Literature results on Y1-tLut(Co1-xAlx)2 Gabelko91 alloys with invariable lattice parameter show, that at small x (up to about x=0.06–0.1) the critical field for metamagnetic transition in these alloys decreases at the same rate as in Lu(Co1-xMx)2 (M = Ga, Sn, Al) Murata91 ; Murata93 and Y(Co1-xAlx)2 Michels90 ; Wada90 alloys, where lattice parameter varies considerably. Similarly, in Ho(Co1-xSix)2 diluted alloys Duc97 with ivariable lattice parameter and in Ho(Co1-xAlx)2 alloys increases with at the same rate, see Fig. 4b. This indicates, in agreement with our results, that lattice expansion can not be the main cause for the magnetic enhancement of the alloys. On the other hand, the 3d band de-population model also can not explain these results since the substituting elements have different configurations of the outer electronic shells.
The results show that the mechanism, which causes the decrease of in non-magnetic compounds (or increase of in the magnetic ones) does depend at small x neither on the type of substituting element nor on the lattice expansion. What all above mentioned alloys have in common, is disorder within the Co-sublattice due the substitution of Co by other elements. We therefore conclude, that the principal reason for the narrowing of the 3d band in Ho(Co1-xAlx)2 for low Al contents, is the increasing localization of the 3d electrons caused by disorder within Co-sublattice. Experimental results on transport in Y(Co1-xAlx)2 alloys has led us to a similar conclusion Nakama2000 . A different situation takes place when the impurity element has unfilled 3d-shell, like Ni and Fe, in that case the effects of the change of 3d electron concentration play a dominant role Goto94 .
Of course, one can not exclude a change of the 3d electron concentration upon the Co-substitution in Ho(Co1-xAlx)2. Moreover, the decrease of values in the paramagnetic temperature region, as will be demonstrated later, implies such a change. It also follows from literature that the behavior of Y(Co1-xMx)2 alloys at large x (above about 0.1), such as the stabilization of a ferromagnetic ground state, depends on the kind of substituting elements, suggesting a hybridization of s–p and 3d states. However, our analysis shows that the change of the 3d electron concentration does not play major role in magnetic enhancement of diluted alloys.
To summarize this part, our experimental results on transport properties of Ho(Co1-xAlx)2 alloys and analysis of the results, reported in the literature, led us to the conclusion that the principal mechanism, responsible for the increase of in magnetic alloys, or a decrease of in paramagnetic alloys, is the narrowing of the 3d DOS peak due to localization of Co 3d electron states, induced by disorder in Co sublattice of the alloys.
III.2 Electrical resistivity.
The rapid increase of the residual resistivity and the modest variation of high temperature resistivity with Al content are the most characteristic features observed in the resistivity of the alloys. The temperature dependent part of the resistivity systematically decreases with x as it is shown in Fig. 5. We should note that such behavior is common for many RCo2 - based alloys Steiner78 ; Gratz87 ; Michels90 ; Duc92b ; Duc95 ; Gratz95a ; Duc97 , which include both, R(Co1-xMx)2 and Y1-xRxCo2 systems.
However, there has been no commonly accepted model, able to account for the observed variation of the temperature dependent resistivity. The independence of the phenomenon on the constituents of the alloys implies a common mechanism. As in the case of the above discussed Co-localization, disorder and metamagnetism of the magnetic Co subsystem are the natural candidates. Baranov et al. Baranov95 ; Baranov2003 were probably the first to emphasize the important role, which disorder can play in RCo2 - based alloys. In a certain range of alloy composition, 3d magnetic subsystem can be in ”partially” ordered ground state, i.e. in the alloy there are spatial regions with high and low 3d magnetization. This static magnetic disorder originates from a combination of fluctuating exchange field (in (Y1-xRx)Co2 alloys), or fluctuating local susceptibility (in R(Co1-xMx)2 alloys), and of the metamagnetism of 3d electron system. Scattering of conduction electrons of this static magnetic disorder gives contribution to the alloy resistivity, which is comparable to the high temperature limit of 3d spin fluctuation (SF) resistivity (the resistivity due to scattering on dynamic, i.e. temperature-induced, fluctuations of local 3d magnetization) in RCo2 compounds Burkov2004 . The static magnetic disorder can be viewed as ”frozen” SF. When temperature increases this frozen disorder melts and is replaced by the dynamic disorder. Since the corresponding contributions to resistivity are of similar magnitude, the temperature variation of the total resistivity is considerably reduced.
Figure 6 shows the resistivity of Ho(Co1-xAlx)2, DyCo2 and TbCo2 rem2 , normalized to its value at T=300 K, plotted against to account for the different width of the 3d band. Since for the Ho(Co1-xAlx)2 with 0.075 the high–temperature minimum in is not observable due to the high , we use an interpolation of , as it is shown in Fig. 4b by the broken line, to obtain of these alloys.
The other two interesting features of the resistivity can be seen
from Figure 6:
1. The kind of the phase transition at Curie point is changed from
first to second order around =.
This is another manifestation that is an
essential physical parameter, directly
reflecting DOS features. The relation between and
the change of the transition order follows from the model of the metamagnetic
transition of Co subsystem Levitin88 as a consequence of the
temperature
smearing of DOS features at the Fermi
level Levitin88 ; Duc92 .
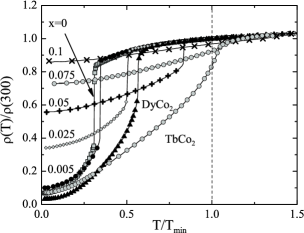
Essentially the same mechanism leads to the development of the
minima in Burkov88 .
There is, however, an alternative theoretical model,
in which the order of a magnetic phase transition depends basically on the lattice
constant value Khmelevskyi2000 .
Since the width of the DOS peak (and, therefore, ) is
determined in pure RCo2 compounds
by the lattice parameter,
represents a more general
condition for
the boundary between second and first order phase transition in these compounds.
2. The magnitude of the resistivity drop at the Curie temperature
decreases as approaches . This
last feature is also present in binary RCo2 compounds,
as it can be seen comparing the resistivities of HoCo2 and DyCo2,
shown in Fig. 6. The resistivity drop at
of heavy RCo2 compounds, which exhibit a
first-order
transition, has been attributed to a
sudden suppression of SF by strong molecular field
of the ordered 4f moments Gratz95 . This,
however, does not explain the decrease of
with increasing .
We propose that the origin of this decrease is the same as the origin of resistivity saturation of nearly magnetic compounds at high temperatures Ueda75 ; Moriya .
In the model, put forth in Ueda75 ; Moriya by Ueda and Moriya, the
SF contribution to the resistivity () is determined
by the d band dynamical susceptibility, which is enhanced due to
d band SF. It has been shown that the
saturation tendency, which is characteristic for the temperature
dependent resistivity of nearly magnetic materials, originates
from the strong decrease of the d band enhancement owing to
interactions among SF at high temperatures.
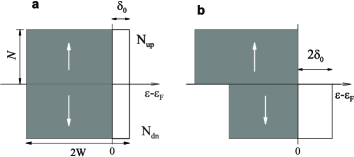
We use here a very simplified model with a rectangular approximation for the Co 3d DOS (Fig. 7) to illustrate the essential physics of the resistivity saturation and of the decrease of .
We consider an enhanced 3d band paramagnetic compound (such as YCo2). At T=0 K, without external field, the spin-up and spin-down sub-bands are equally occupied, Fig. 7a, and there are no SF. At a nonzero temperature thermal fluctuations of the 3d sub-band occupation, amplified by exchange interaction, result in fluctuations of local magnetization, i.e. SF. According to Moriya the magnitude of the local magnetization fluctuations increases with temperature, however it saturates at a constant value in a high temperature limit. Both, the saturation value and cross-over temperature, are determined by the 3d band parameters.
In magnetic RCo2 compounds the 3d system at T=0 K is in high magnetization state. In the following we consider 3d band in this case as fully polarized by the exchange field of ordered 4f moments, as it schematically shown in Fig. 7b, with saturation magnetic moment . As temperature increases, there will be also temperature-induced fluctuations of the 3d magnetization around this polarized state.
For our qualitative model we assume that the SF resistivity is determined by the spin–spin correlation function
where and are the local 3d magnetization at lattice point with coordinates and , respectively, and is distance of order of conduction electron (s–electron) mean free path. The scattering magnitude of conduction electron by a magnetic fluctuation is proportional to its squared magnitude, measured relative to the local background at a distance of order of conduction electron mean free path. Therefore, the most effective will be the scattering on correlated magnetic fluctuations with largest difference of local magnetization at points and . For the paramagnetic state, this corresponds to fluctuations at and with the opposite magnetization. While for a system in ferromagnetic ground state with fully polarized 3d band, the largest difference is between this fully polarized state moment and local fluctuation with a reduced moment. Basing on the above arguments, we define the effective SF magnitude ( - paramagnetic state, - ferromagnetic state), determining the SF resistivity, as:
| (1) |
where
and
| (2) |
with
and
The definitions of , and are given in Fig. 7. and are local spin-up and spin-down density, is the Fermi distribution function, and is the exchange enhancement factor.
Due to the charge neutrality condition (), the magnitude of the SF has an upper limit. Both and have maximum value of . For the unpolarized 3d band the SF attain the maximum amplitude at a temperature satisfying condition , whereas for the fully polarized 3d band the corresponding condition is . At higher temperatures the itinerant SF behave as localized magnetic moments with fixed magnitude.
The corresponding SF resistivity follows from Eqns. 1 and 2:
for the non-polarized (paramagnetic) state, and
for the polarized (magnetically ordered) 3d band. Expression for gives a roughly correct representation of the overall temperature dependence of the SF resistivity of paramagnetic RCo2 compounds: it increases as at low temperatures and saturates to a temperature-independent value at high temperatures Gratz95 .
Both, and are displayed in Fig. 8.
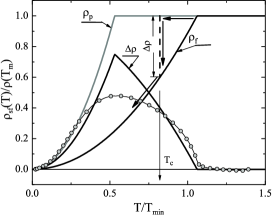
In RCo2 compounds with a first-order magnetic phase transition, the 3d band undergoes at a transition from the non-polarized to the polarized state (shown schematically by the arrows in Fig. 8), with corresponding change of the SF resistivity: which is also presented in Fig. 8. For comparison the experimental difference between the normalized resistivity of paramagnetic YCo2 rem2 (a representative of a non-polarized state of the 3d band) and of ferrimagnetic TbCo2 rem2 (a representative of the polarized state of the 3d band) is shown on this figure too. In spite of very schematic model, used to calculate , there is close correspondence between theoretical and experimental curve.
The experimental resistivity jump observed at of RCo2 and Ho(Co1-xAlx)2 is presented in Fig. 9. is shown for pure TmCo2 nakama99 , ErCo2, HoCo2, DyCo2 rem2 compounds and for Ho(Co1-xAlx)2 alloys. Also shown are the results for ErCo2, HoCo2 and DyCo2 under pressure up to 16 kbar Hauser98 . The resistivity drop is plotted against to account for the different width of Co-3d band.
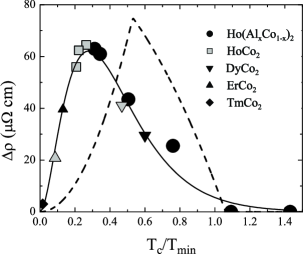
We do not have experimental data on thermopower of all RCo2 under pressure, therefore the same value of K/kbar was used to calculate for compounds under pressure, shown in Fig. 9. was obtained experimentally for a (Gd0.01Y0.99)Co2 alloy NakamaP . As it can be seen from the Fig. 9 there is qualitative agreement between theoretical and experimental values of The model shows two important features in the resistivity behavior: the saturation at high temperatures, and the decrease of with increasing . The important parameters of the model are the bandwidth 2 and the distance from the Fermi level to band edge . They can be estimated in the following way. The empty portion of the 3d band can be evaluated from the experimentally observed saturation Co-moment M=1 /Co for RCo2 compounds. From this value it follows that . Using the experimentally observed temperature range in which is non-zero (Fig. 9) as the measure for (200 K), and taking Tanaka98 (which gives eV), we get for Co–3d bandwidth 2W about 2.4 eV, in a very reasonable agreement with the value of 2.5 eV, according to the result of Ref. Tanaka98 .
The model DOS used here to demonstrate the mechanism of decrease with increasing , is obviously too oversimplified to account for the very details of and . The omission of 4f – 3d exchange interaction is less obvious. This effect, however, is clearly visible, if one compares of paramagnetic and magnetic RCo2 compounds, depicted in Fig. 10.
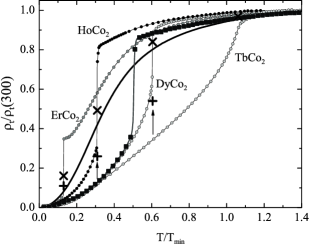
For a hypothetical magnetic RCo2 compound, whose resistivity includes only SF, phonon, and impurity contributions, its normalized resistivity above would coincide with the normalized resistivity of paramagnetic YCo2, while below it should be similar to the normalized resistivity of TbCo2. However, as we can see from Fig. 10, the normalized resistivity of the other magnetic RCo2 compounds deviates on approach to from the resistivity of TbCo2 at and from the resistivity of YCo2 at . In part, this deviation refers to additional contributions owing to scattering on 4f magnetic moments in magnetic RCo2. At , the corresponding contribution, , is independent of temperature. Therefore, the normalized resistivity of a magnetic compound:
differs from the normalized resistivity of YCo2.
Below , instead of there is a temperature–dependent 4f spin-wave contribution to the resistivity, . It increases with temperature, reaching at a maximum value. In ferromagnetic metals with second-order phase transition, , however in RCo2 with first-order transition it should be strongly suppressed by the 3d exchange field just below the transition. The estimated resistivity at , including contributions of or is shown in Fig. 10. For these estimations we use , with from Ref. Gratz95 . Corrections due to are certainly overestimated. Nevertheless, it is clear from Fig. 10 that these corrections can not account for the observed deviations, especially above . The origin of these deviations is the mutual interaction between the 4f and the 3d magnetic systems. Below , the spin-wave excitations in the 4f system amplify the itinerant SF of the 3d polarized band, leading to strong increase of the resistivity on approaching . In the paramagnetic state there is a similar mutual amplification of 4f and 3d SF on approach to from higher temperatures. This amplification increases with decreasing since the susceptibility of the localized 4f moments increases with decreasing temperature.
III.3 Thermopower.
above is related to DOS features in vicinity of the Fermi energy. Results for Ho(Co1-xAlx)2 alloys provide further support to the model outlined in our previous publications Burkov88 ; Burkov93 .
We use similar approach and the model DOS, depicted in Fig. 3 by the dotted line, to explore the dependence of the thermopower on Co 3d band parameters. According to Mott’s s–d model, the conductivity is due to high mobility s–electron states, from which the charge carriers are scattered into 3d states with low mobility and, effectively, are eliminated from conduction process. The scattering probability of conduction electrons is proportional to the state density value, into which an electron is scattered. Therefore, within s–d model, the s–electron scattering probability is expected to depend on the electron energy as:
| (3) |
where is due to other than s–d scattering transitions. This relation is valid for elastic or quasi-elastic scattering.
Thermopower is expressed as Burkov93 ; Barnard72 :
| (4) |
where
| (5) |
and
| (6) |
where is the velocity of conduction electrons, is the cross-sectional area of the Fermi surface, perpendicular to the electrical field direction. is the relaxation time. In the s–d model approximation
| (7) |
Using equations (4–7) is calculated with the model DOS, shown in Fig. 3. The results of the calculations are shown in Fig. 11. The calculations were performed using different values of two parameters describing the model DOS: is the width of the 3d DOS peak, and - is the distance from Fermi energy to the center of the peak.

Two important conclusions follow from these results:
1. The
position of the thermopower minimum depends mainly on the
3d peak width;
2. The de-population of the 3d band affects the
magnitude of the high–temperature thermopower, however has
almost no effect on the position of the thermopower minimum.
Comparison of the theoretical result of Fig. 11c and experimental data on thermopower (Fig. 2) indicates that both effects – de-population and narrowing of 3d band, play an important role determining in the paramagnetic temperature range. Both also lead to an increase of 3d DOS at Fermi level. From the variation of parameters and we can roughly estimate that the narrowing of 3d band increases DOS at Fermi level by more than 50%, while de-population – by less than 20%. Therefore, this estimation support our conjecture, that narrowing of 3d band due to disorder plays dominant role in the magnetic enhancement of R(Co1-xMx)2 alloys.
The calculations of thermopower were made under assumption of elastic scattering, which is valid at high temperatures, i.e. above about 100 K. At lower temperatures scattering on SF is non–elastic. The distinction between elastic and non-elastic scattering is essential in case of thermopower (however it is not important for resistivity). For elastic scattering the change of conduction electron energy satisfies the condition: where and denote the final and initial states, respectively. In non-elastic scattering the change of the electron energy in a scattering event is of order of . On average, an electron from a state above will be scattered into a state below and vice versa. Therefore, while for elastic scattering (due to negative values at Fermi energy) , for the non-elastic scattering it can be reversed: , leading to a positive thermopower, instead of negative values for elastic scattering. The effect of these different scattering regimes is clearly visible in of paramagnetic RCo2 compounds Gratz95 : with decreasing temperature below about 100 K shows a clear tendency to change sign, which, however, is interrupted by another process, leading to large negative thermopower values at low temperatures. This another process is likely caused by SF drag effect.
of Ho(Co1-xAlx)2 at exhibits a complicated variation as obvious from Fig. 12.
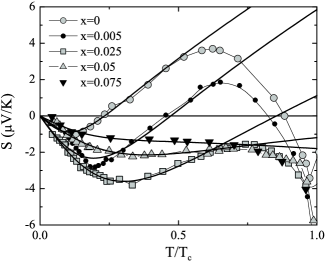
Data imply that these temperature dependencies result from an interplay between impurity (elastic) and spin wave (non-elastic) scattering. For diluted alloys at low temperatures, the impurity scattering constitutes the main contribution to thermopower. This gives rise to negative values, exhibiting an almost linear temperature variation. At higher temperatures, non-elastic scattering on spin waves becomes important and results in the pronounced positive peak, especially at lower Al content. According to the Nordheim-Gorter rule Barnard72 , thermopower of a conductor with two dominating scattering processes, can be expressed as:
with The subscripts refer to impurity and spin-wave scattering contributions. The resistivity related to scattering on spin-waves follows from We assume that both, and , are linear at low temperatures: and Based on these assumptions we obtain for the total thermopower:
| (8) |
where is temperature, defined from the condition:
| x | |||
|---|---|---|---|
| 0 | -0.18 | 0.12 | 15 |
| 0.005 | -0.25 | 0.1 | 24 |
| 0.025 | -0.22 | 0.05 | 39 |
| 0.05 | -0.09 | 0.0037 | 49 |
| 0.075 | -0.055 | -0.001 | 40 |
Expression (8) was fitted to the low temperature experimental thermopower, using , and as free parameters. The results are shown in Fig. 12 by solid lines, and the parameter values are listed in Table 1. For diluted alloys (x=0, x=0.005) the parameters are reasonable and show expected dependencies on : and increase with , while is independent of . At larger values of , however, the dominant low-temperature scattering mechanism is due to static magnetic disorder, related to the formation of a partially-ordered ground state of the 3d electron system. This scattering is not temperature independent, which leads to a decrease of and in concentrated alloys.
IV Conclusion
In conclusion, we have studied electrical resistivity and thermoelectric power of Ho(Co1-xAlx)2 alloys () for temperatures from 4.2 K to 300 K. The experimental temperature dependencies of thermopower indicate that the width of the Co 3d band decreases with Al content. This decrease can not be accounted for only by the increasing lattice parameter of the alloys. The analysis of experimental results on magnetic and transport properties of Ho(Co1-xAlx)2 and other R(Co1-xMx)2 alloys led us to the conclusion that the principal mechanism, responsible for the narrowing of the 3d DOS peak is the localization of the Co 3d electron states, induced by disorder in Co sublattice of the alloys. The narrowing of the 3d DOS gives main contribution to enhancement of DOS at Fermi energy and to increase of in magnetic alloys, or a decrease of in paramagnetic alloys. This new mechanism of a magnetic enhancement of the Co 3d band in RCo2-based alloys upon substitution of Co by non-magnetic elements reconciles two previous, apparently conflicting, models.
The magnitude of the resistivity jump at Curie temperature, observable in Ho(Co1-xAlx)2 and RCo2 compounds, exhibiting first order magnetic phase transition, is a non-monotonic function of . Our simple model shows that the non-monotonous variation of the resistivity jump with is due to the saturation of the 3d band SF magnitude at high temperatures.
We postulate that fluctuations of the local magnetic susceptibility in Ho(Co1-xAlx)2 leads to development of partially ordered ground state of the 3d magnetic subsystem, as it was shown previously for Y1-xRxCo2 alloys (R are magnetic rare earth elements). Static magnetic disorder, associated with this partially ordered ground state, induces the huge residual resistivities observed. With increasing temperature the static magnetic disorder is replaced by dynamic, temperature-induced SF. The corresponding contributions to the resistivity have similar magnitude. Therefore, the overall temperature variation of the resistivity in the alloys is strongly suppressed.
Our analysis demonstrate that the temperature behavior of the thermopower above 100 K is determined by a narrow peak in the 3d DOS at the Fermi energy. The complex behavior of the thermopower at low temperatures results from an interplay of elastic impurity scattering and non-elastic temperature-induced SF scattering.
V Acknowledgments
We want to thank Dr. A.Yu.Zyuzin for stimulating discussions.
This work was supported by Russian Foundation for Basic Research under Grants 05-02-17816-a and 06-02-17047-a.
References
- (1) R. Lemaire, Cobalt 32 (1966) 132; 33 201 (1966).
- (2) R. Z. Levitin, A. S. Markosyan, Sov. Phys. - Usp. 31 730 (1988).
- (3) E. Gratz, R. Resel, A. T. Burkov, E. Bauer, A. S. Markosyan, A. Galatanu, J. Phys.: Condens. Matter 7 6687 (1995).
- (4) T. Goto, K. Fukamishi, T. Sakakibara, H. Komatsu, Solid State Commun. 72 945 (1989).
- (5) T. Goto, T. Sakakibara, K. Murata, K. Komatsu, K. Fukamichi, J. Magn. Magn. Mater. 90/91 700 (1990).
- (6) V. V. Aleksandryan, A. S. Lagutin, R. Z. Levitin, A. S. Markosyan, V. V. Snegirev, Sov.Phys.-JETP 62 153 (1985).
- (7) K. Yoshimura, Y. Nakamura, Solid State Commun. 56 767 (1985).
- (8) V. V. Aleksandryan, K. P. Belov, R. Z. Levitin, A. S. Markosyan, V. V. Snegirev, JETP Letters 40 815 (1984).
- (9) R. Ballou, Z. M. Gamishidze, R. Lemaire, R. Z. Levitin, A. S. Markosyan, V. V. Snegirev, Sov. Phys. JETP 75 1041 (1993).
- (10) K. Ishiyama, K. Endo, J. Phys. Soc. Japan 55 2535 (1986).
- (11) This DOS feature is responsible for the itinerant metamagnetism of RCo2 compounds.
- (12) A. T. Burkov, M. V. Vedernikov, E. Gratz, Solid State Commun. 67 1109 (1988).
- (13) M. Forker, S. Müller, P. de la Presa, A. F. Pasquevich, Phys. Rev. B 68 014409 (2003).
- (14) M. Forker, S. Müller, P. de la Presa, A. F. Pasquevich, Phys. Rev. B 75 187401 (2007).
- (15) J. Herrero-Albillos, F. Bartolomè, L. M. García, F. Casanova, A. Labarta, X. Batlle, Phys. Rev. B 73 134410 (2006).
- (16) J. Herrero-Albillos, F. Bartolomè, L. M. García, F. Casanova, A. Labarta, X. Batlle, Phys. Rev. B 75 187402 (2007).
- (17) N. H. Duc, T. D. Hien, R. Z. Levitin, A. S. Markosyan, P. E. Brommer, J. J. M. Franse, Physica B 176 232 (1992).
- (18) A. T. Burkov, E. Gratz, E. Bauer, R. Resel, J. Alloys Compd. 198 117 (1993).
- (19) M. Cyrot, M. Lavagna, J.Physique 40 763 (1979).
- (20) H. Yamada, J. Inoue, K. Terao, S. Kanda, M. Shimizu, J. Phys. F: Metal Physics 14 1943 (1984).
- (21) H. Yamada, Physica B 149 390 (1988).
- (22) S. Tanaka and H. Harima, J. Phys. Soc. Japan 67 2594 (1998).
- (23) N. H. Duc, T. K. Oanh, J. Phys.: Condens. Matter 9 1585 (1997).
- (24) K. Murata, K. Fukamichi, H. Komatsu, T. Sakakibara, T. Goto, J. Phys.: Condens. Matter 3 2515 (1991).
- (25) K. Murata, K. Fukamichi, T. Sakakibara, T. Goto, K. Suzuki, J. Phys.: Condens. Matter 5 1525 (1993).
- (26) D. Michels, J. Timlin, T. Mihhlisin, J. Appl. Phys. 67 5289 (1990).
- (27) H. Wada, M. Hada, K. N. Ishihara, M. Shiga, Y. Nakamura, J. Phys. Soc. Japan 59 2956 (1990).
- (28) I. L. Gabelko, R. Z. Levitin, A. S. Markosyan, V. I. Silantiev, V. V. Snegirev, J. Magn. Magn. Mater. 94 287 (1991).
- (29) T. Nakama, K. Shintani, M. Hedo, H. Niki, A. T. Burkov, K. Yagasaki, Physica B281&282 699 (2000).
- (30) T. Goto, H. Aruga Katori, T. Mitamura, K. Fukamichi, K. Murata, J. Appl. Phys. 76 6682 (1994).
- (31) W. Steiner, E. Gratz, H. Ortbauer, H. W. Gamen, J.Phys. F: Metal Physics 8 1525 (1978).
- (32) E. Gratz, N. Pillmayr, E. Bauer, , G. Hilscher, J. Magn. Magn. Mater. 70 159 (1987).
- (33) N. H. Duc, V. Sechovski, D. T. Hung, N. H. K. Ngan, Physica B 179 111 (1992).
- (34) N. H. Duc, P. E. Brommer, X. Li, F. R. de Boer, J. J. M. Franse, Physica B 212 83 (1995).
- (35) E. Gratz, R. Hauser, A. Lindbaum, M. Maikis, R. Resel, G. Schaudy, R. Z. Levitin, A. S. Markosyan, I. S. Dubenko, A. Yu. Sokolov, S. W. Zochowski, J.Phys.: Condens. Matter 7 597 (1995).
- (36) N. V. Baranov, A. N. Pirogov, J. Alloys Compd. 217 31 (1995).
- (37) N. V. Baranov, A. A. Yermakov, A. Podlesnyak, J. Phys.: Condens. Matter 15 5371 (2003).
- (38) A. T. Burkov, A. Yu. Zyuzin, T. Nakama, K. Yagasaki, Phys. Rev. B 69 144409 (2004).
- (39) We measured resistivity of pure RCo2 compounds (except TmCo2) using new samples, prepared according to the same procedure as the samples of Ho(AlxCo1-x) alloys. These new results agree within experimental uncertainty with earlier data from Refs. Gratz95 ; Hauser98 .
- (40) S. Khmelevskyi, P. Mohn, J. Phys.: Condens. Matter 12 9453 (2000).
- (41) K. Ueda, T. Moriya, J. Phys. Soc. Japan 39 605 (1975).
- (42) T. Moriya, Spin Fluctuations in Itinerant Electron Magnetism. Springer Series in Solid State Sciences 56, Ed. M. Cardona, P. Fulde, H.-J. Quisser. Springer-Verlag, Berlin, Heidelberg, 1985.
- (43) R. Hauser, E. Bauer, E. Gratz, Phys. Rev. B 57 2904 (1998).
- (44) T. Nakama, K. Shintani, K. Yagasaki, A. T. Burkov, Y. Uwatoko, Phys. Rev. B 60, 511 (1999).
- (45) T. Nakama, et al., unpublished.
- (46) R. D. Barnard, Thermoelectricity in metals and alloys, London: Tailor & Frances, 1972.