Galileo In-Situ Dust Measurements in Jupiter’s Gossamer Rings
Harald Krüger1,2, Douglas P. Hamilton3, Richard Moissl1, and Eberhard Grün2,4
1
Max-Planck-Institut für Sonnensystemforschung,
Max-Planck-Str. 2,
37191 Katlenburg-Lindau,
Germany
E-Mail: krueger@mps.mpg.de
2
Max-Planck-Institut für Kernphysik,
Postfach 103980, 69029 Heidelberg, Germany
3
Astronomy Department,
University of Maryland,
College Park,
MD 20742-2421,
USA
4 Laboratory for Atmospheric and Space Physics, University of Colorado,
Boulder, CO, 80303-7814, USA
| Manuscript pages: | 62 |
| Figures: | 13 |
| Tables: | 4 |
Icarus, submitted
Proposed Running Head:
IN-SITU DUST MEASUREMENTS IN JUPITER’S GOSSAMER RINGS
Corresponding author:
Harald Krüger
Max-Planck-Institut für Sonnensystemforschung,
Max-Planck-Str. 2,
37191 Katlenburg-Lindau, Germany
E-mail: krueger@mps.mpg.de
Abstract
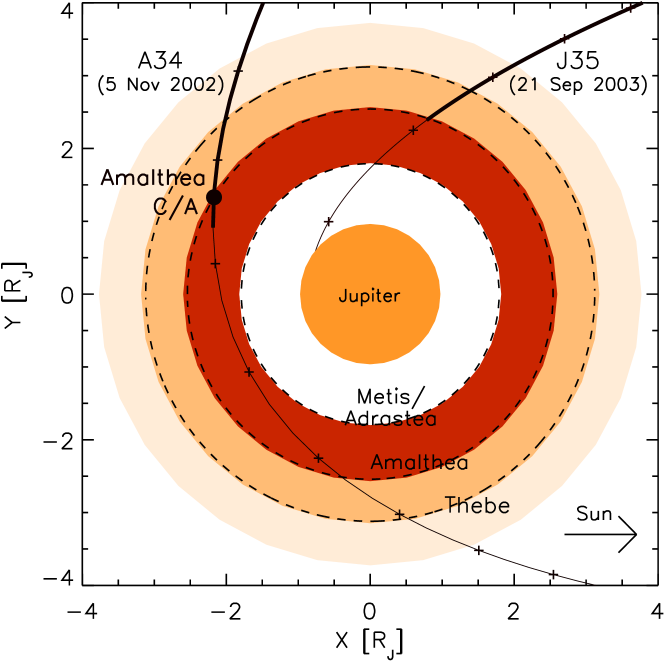
Galileo was the first artificial satellite to orbit Jupiter. During its late orbital mission the spacecraft made two passages through the giant planet’s gossamer ring system. The impact-ionization dust detector on board successfully recorded dust impacts during both ring passages and provided the first in-situ measurements from a dusty planetary ring. During the first passage – on 5 November 2002 while Galileo was approaching Jupiter - dust measurements were collected until a spacecraft anomaly at (Jupiter radii) just 16 min after a close flyby of Amalthea put the spacecraft into a safing mode. The second ring passage on 21 September 2003 provided ring dust measurements down to about and the Galileo spacecraft was destroyed shortly thereafter in a planned impact with Jupiter. In all, a few thousand dust impacts were counted with the instrument accumulators during both ring passages, but only a total of 110 complete data sets of dust impacts were transmitted to Earth. Detected particle sizes range from about 0.2 to , extending the known size distribution by an order of magnitude towards smaller particles than previously derived from optical imaging (Showalter et al.,, 2008). The grain size distribution increases towards smaller particles and shows an excess of these tiny motes in the Amalthea gossamer ring compared to the Thebe ring. The size distribution for the Amalthea ring derived from our in-situ measurements for the small grains agrees very well with the one obtained from images for large grains. Our analysis shows that particles contributing most to the optical cross-section are about in radius, in agreement with imaging results. The measurements indicate a large drop in particle flux immediately interior to Thebe’s orbit and some detected particles seem to be on highly-tilted orbits with inclinations up to . Finally, the faint Thebe ring extension was detected out to at least , indicating that grains attain higher eccentricities than previously thought. The drop interior to Thebe, the excess of submicron grains at Amalthea, and the faint ring extension indicate that grain dynamics is strongly influenced by electromagnetic forces. These findings can all be explained by a shadow resonance as detailed by Hamilton and Krüger, (2008).
Keywords:
dust
Jupiter, satellites
Jupiter, rings
planetary rings
1 Previous Imaging Results
All four giant planets of our Solar System are surrounded by huge tenuous ring systems which contain mostly micrometer- and submicrometer-sized dust particles (Burns et al.,, 2001). In these rings, dust densities are so low that particle collisions are negligible, and grain dynamics is substantially perturbed by non-gravitational forces. The ’dusty’ rings are interesting and valuable counterpoints to the collisionally dominated opaque and dense rings of Saturn and Uranus which are populated primarily by macroscopic centimeter- to meter-sized objects.
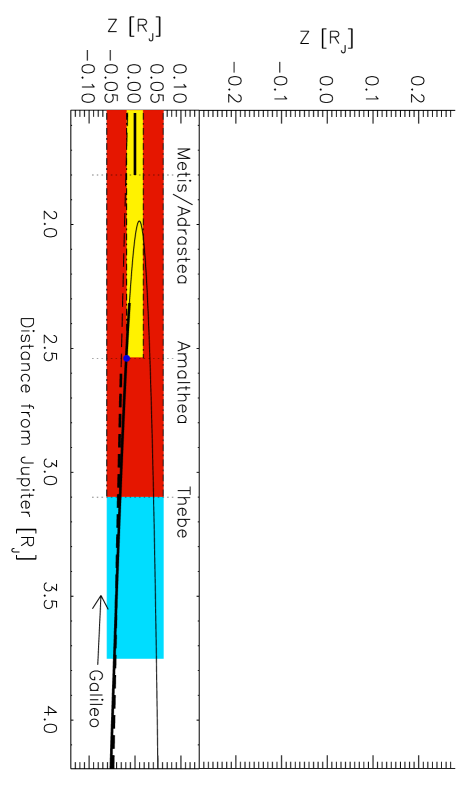
Jupiter’s ring system was investigated with remote imaging from the Earth and from the Voyager, Galileo and Cassini spacecraft, revealing significant structure in the ring: at least four components have been identified (Ockert-Bell et al.,, 1999; Burns et al.,, 1999; de Pater et al.,, 1999): the main ring, interior halo and two gossamer rings. The small moons Metis, Adrastea, Amalthea and Thebe are embedded in the ring system and act as sources of ring dust via meteoroid impact erosion of their surfaces (Burns et al.,, 1999). The faint gossamer rings appear to extend primarily inward from the orbit of Amalthea and Thebe (Figures 1 and 2). In addition, the vertical limits of each moon’s slightly inclined orbit very closely match the vertical extensions of these two rings (Ockert-Bell et al.,, 1999). These observations imply a close relationship between the rings and embedded moonlets. Outside the orbit of Thebe, a swath of faint material is seen out to about (Jupiter radius, ) distance from the planet. Beyond this distance, the rings fade slowly into the background. Normal optical depths are about for the main ring and halo, and about 100 – 1000 times less for the Amalthea ring and Thebe rings. Analysis of the few gossamer ring images implies particle radii of with additional contributions from larger material (Showalter et al.,, 2008). In this paper, we show that smaller grains are also present in large numbers.
The simplest picture of particle dynamics in the ring implies that dust grains ejected from the surfaces of each moon would rapidly disperse in longitude and nodal angles while maintaining their initial inclinations (Burns et al.,, 1999). As such material evolves inward under Poynting-Robertson drag, it would naturally produce the two overlapping rings with rectangular profiles. Support for this interpretation comes from the fact that both gossamer rings show concentrations at the vertical extremes, where particles on inclined orbits spend most of their time. The extension of Thebe’s gossamer ring beyond Thebe’s orbit, however, violates this simple and elegant picture and has been attributed to an electromagnetic process involving Jupiter’s intense magnetic field by Hamilton and Krüger, (2008).
2 Galileo In-Situ Dust Measurements
The Galileo spacecraft was the first artificial satellite of Jupiter, circling the giant planet between 1996 and 2003. Near the end of the mission, the spacecraft passed directly through the rings twice, on 5 November 2002 and 21 September 2003, offering a unique opportunity for in-situ studies of planetary rings. The in-situ dust detector on board (Grün et al.,, 1992) counted several thousand dust impacts during both ring passages, and the full data sets, consisting of impact direction, charge amplitudes, rise times, etc., for 110 separate impacts were transmitted to Earth. The first ring passage included a close flyby at Amalthea with a closest approach distance of 244 km, just outside the Hill sphere of this jovian moon. The flyby provided an improved mass estimate for the satellite, with an implied density of g cm-3 (Anderson et al.,, 2005).
Galileo’s traversal of Jupiter’s gossamer rings provided the first in-situ measurements of a dusty planetary ring. In-situ dust measurements nicely complement imaging, providing important additional information about the physical properties of the dust environment. In particular, in-situ measurements constrain dust spatial densities along the spacecraft trajectory as well as grain masses, size distributions, impact speeds and grain dynamics.
In this paper we present and analyse the complete in-situ dust measurements obtained during both Galileo gossamer ring passages. We analyse grain impact directions and impact rates and derive dust number densities and grain size distributions from the measurements. We interpret results in terms of the gossamer rings’ structure and the dynamics of charged ring particles.
2.1 Dust Detection Geometry
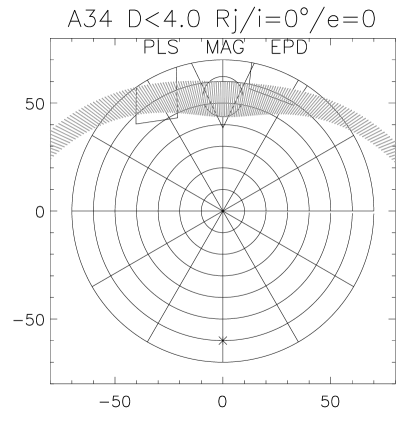
Galileo was a dual spinning spacecraft with an antenna that pointed antiparallel to the positive spin axis. The antenna usually pointed towards Earth. The Dust Detector System (DDS) was mounted on the spinning section of Galileo underneath the magnetometer boom (Kivelson et al.,, 1992), with the sensor axis offset by from the positive spin axis. Figure 3 shows a schematic view of the Galileo spacecraft and the geometry of dust detection.
The rotation angle, , measured the viewing direction of the dust sensor at the time of a dust impact. During one spin revolution of the spacecraft, scanned through a complete circle of . At and the sensor axis lay nearly in the ecliptic plane, and at it was close to the ecliptic north direction. Rotation angles are taken positive around the negative spin axis of the spacecraft which points towards Earth. This is done to easily compare Galileo spin angle data with those taken by Ulysses, which, unlike Galileo, has its positive spin axis pointed towards Earth (Grün et al.,, 1995).
The field-of-view (FOV) of the dust sensor target was . Due to the offset of between the sensor axis and the spacecraft spin axis, over one spacecraft spin revolution, the sensor axis scanned the surface of a cone with opening angle centered on the anti-Earth direction. Dust particles that arrived from within of the positive spin axis (anti-Earth direction) could be detected at all rotation angles , whereas those that arrived with angles between and from the positive spin axis could be detected over only a limited range of rotation angles. In the frame fixed to the spacecraft, we define the impact angle between the impact velocity and the sensor axis as , and the angle between the impact velocity and the spacecraft’s anti-Earth spin axis as .
Figure 3 shows that the magnetometer boom (MAG; Kivelson et al.,, 1992) was in the field of view of the dust sensor. The Energetic Particles Detector (EPD; Williams et al.,, 1992) and the Plasma Instrument (PLS; Frank et al.,, 1992) partially obscured the FOV of the dust sensor as well (Figure 4). In other words, at certain spacecraft rotation angles , particles approaching at angles with respect to the spacecraft spin axis hit the boom and these Galileo instruments instead of the sensor target. The effect of this obscuration was first recognized in measurements of the jovian dust stream particles (Krüger et al., 1999b, ).
2.2 Dust Impact and Noise Identification
Dust grains hitting the sensor target generated a plasma cloud of evaporating grain and target material. For each impact, three independent measurements of the resulting plasma cloud were used to derive the impact speed and the mass of the particle: the electron signal, an ion signal, and a channeltron signal (Grün et al.,, 1992). The charge released upon impact onto the target is roughly described by the relation (Göller and Grün,, 1989)
| (1) |
The dust instrument was empirically calibrated in the speed range 2 to . Furthermore, the coincidence times of the three charge signals together with the charges themselves are used to sort each impact into one of four classes. Class 3 impacts have three charge signals, two are required for class 2 and class 1 events, and only one for class 0 (Baguhl,, 1993; Grün et al.,, 1995; Krüger et al., 1999a, ). In addition to the four classes, the dust data were categorised into six amplitude ranges of the impact-generated ion charge, each range covering one order of magnitude in charge (here denoted by AR1 to AR6; Grün et al.,, 1995). Hence, taking the classes and amplitude ranges together, the dust data were grouped into categories.
Class 3 signals, our highest quality, are real dust impacts while class 0 events are mostly noise. Class 1 and class 2 events were true dust impacts in interplanetary space (Baguhl et al.,, 1993; Krüger et al., 1999a, ). However, during Galileo’s entire Jupiter mission from 1996 to 2002 – while the spacecraft was in the inner jovian magnetosphere – energetic particles from the jovian plasma environment caused enhanced noise rates in class 2 and the lower quality classes. By analysing the properties of the Io stream particles and comparing them with the noise events, the noise could be eliminated from the class 2 data (Krüger et al., 1999b, ; Krüger et al.,, 2005). In particular, most class 0 and class 1 events detected in the jovian environment are probably noise.
Before the two ring flybys that are the subject of this paper, Galileo had only once been within of the planet, on approach in December 1995. Due to uncertainty about the effects of Jupiter’s harsh radiation environment, the dust instrument was switched to a less sensitive mode to protect it (Grün et al.,, 1996). Accordingly, a very low noise rate was measured. The instrument’s sensitivity was later increased, and for the duration of the mission, it recorded an increasing noise level with decreasing distance to the planet.
We have tested the applicability of the noise identification scheme, described in detail by Krüger et al., 1999b ; Krüger et al., (2005), to the near-Jupiter region and improved upon it. A modified noise identification scheme was derived for the gossamer ring data (Moissl,, 2005), showing that class 1 also contains likely candidates for real dust impacts. For class 2, AR1 only the target-ion grid coincidence was used as a criterion for noise events (EIC = 0) while for the higher amplitude ranges (AR2-6) the scheme of Krüger et al., (2005) was applied unchanged (i.e. [ or ] and ; EA, IA and CA are the digital values of the charge amplitudes measured on the target, ion grid and channeltron, respectively – see Grün et al., (1995) for a description of these parameters). For class 1 the following criterion for noise events was used independent of the amplitude range of the event: [ or ] and . More details of the noise identification in the gossamer ring data are described by Krüger et al. (in prep.).
We use this scheme throughout this paper to separate noise events from true dust impacts. Note that this noise removal technique uses statistical arguments and is applicable to large data sets only; individual dust impacts may be erroneously classified as noise and vice versa.
2.3 Instrument Operation and Data Transmission
Galileo had a very low data transmission capability because of the failure of its high-gain antenna to open completely. For the dust measurements this meant that the full set of parameters measured during a dust particle impact or noise spike could only be transmitted to Earth for a limited number of events. The data sets of all other events (whether noise or true impacts) were lost. All events (dust and noise), however, were always counted with one of the 24 accumulators (Grün et al.,, 1995) as described in Section 2.2. This allows us to correct the dust measurements for incomplete data transmission and to derive reliable event rates. In particular, no indications for unrecognized accumulator overflows were seen in the data from both gossamer ring passages as has been problematic for some other stages of the mission.
Galileo dust data could be read out from the instrument memory with different rates (see Krüger et al.,, 2001, for a description). In order to maximise the data transmitted from the two gossamer ring passages, the read-out cycle was set to the fastest useful mode during the respective passage. For the ring passage on 5 November 2002 this meant that dust data were read-out from the instrument memory and written to the Galileo tape recorder in so-called record mode which started at 02:44 UTC, i.e. 18 min before Galileo crossed Io’s orbit during approach to Jupiter. The latest data set measured in each amplitude range was read-out at approximately one-minute intervals and written to the onboard tape recorder for later transmission to Earth. Hence, for impact rates up to in each amplitude range, all data sets could be transmitted to Earth. For higher rates, a fraction of these data sets were lost. This mode gave the highest time resolution of the dust measurements at any time during the mission; about 1 minute. The completeness of the transmitted data sets varied between 100 % in the highest amplitude ranges (AR2-4) in the faint ring extension beyond Thebe’s orbit down to only 4 % for the lowest amplitude range (AR1) in the more populated Amalthea ring.
Dust data were obtained in record mode during Galileo’s approach to Jupiter until a spacecraft anomaly (safing) on 5 November 2002 at 06:35 UTC prevented the collection of further data. This anomaly occurred at a distance of from Jupiter, 16 min after closest approach to Amalthea (at ) and limited the total period of dust measurements obtained from the gossamer rings to about 100 min. Although the instrument continued to measure dust impacts after the spacecraft anomaly, the data were not written to the tape and, hence, most of them were lost. Only the data sets of a few impact events which occurred in the ring region traversed by Galileo after the spacecraft anomaly were obtained from a full memory readout on 18 November 2002. These data, however, have only a low time resolution of about 4.3 hours which is on the order of the duration of the entire gossamer ring passage. Only the total number of events (dust plus noise) in each amplitude range can be derived from the accumulators for the ring region traversed after the spacecraft anomaly.
During Galileo’s second gossamer ring passage on 21 September 2003, the dust data had to be transmitted to Earth immediately because the spacecraft struck Jupiter and was destroyed less than an hour later. Therefore, the dust instrument memory was read-out in the fastest mode that allowed data to be transmitted in real time (realtime science mode; see Krüger et al.,, 2001). Unfortunately, time resolution in this mode was only 7 minutes. The completeness of the transmitted data was about 10% in the faint Thebe ring extension and about 5% in the Thebe ring. The last data set from the Galileo dust instrument received on Earth was read out from the dust instrument memory at 17:59 UTC when the spacecraft was at a jovicentric distance of about . Thus, data from this ring passage provided in-situ dust measurements from the gossamer rings for a total period of about 60 min with no measurements coming from within Amalthea’s orbit.
The motion of Galileo through the gossamer rings together with the readout frequency of the dust instrument memory defined the maximum spatial resolution achievable with the ring measurements. During the first ring passage, with 1 min readout frequency in record mode, Galileo moved through the ring along its trajectory between two adjacent instrument readouts. This corresponds to a motion in radial distance of about 1,100 km (or ). For the second ring passage the spatial resolution was only about 14,000 km or (radial). The ring and the Galileo trajectory are sketched in Figures 1 and 2 and the characteristics of both ring passages are summarized in Table 1.
During the entire first ring passage a total of several thousand dust impacts were counted. Approximately 330 of these happened before the spacecraft safing at inbound to Jupiter. With the optimised noise identification scheme described in Section 2.2 complete data sets of 90 true dust impacts were identified in the Galileo recorded data from the region between and . During the second ring passage approximately 260 dust impacts were counted down to inbound to Jupiter. At this distance dust data transmission ceased before Galileo hit Jupiter. 20 data sets of dust impacts detected between and were transmitted to Earth.
2.4 Mass and Speed Calibration
Grain impact speeds and masses were usually derived from Equation 1 and an empirical calibration obtained in the laboratory (Grün et al.,, 1995). Analysis of the dust data measured during Galileo’s entire Jupiter mission, however, revealed strong degradation of the instrument electronics which affected the speed and mass calibration. The degradation was most likely caused by the harsh radiation environment in the inner jovian magnetosphere, and a detailed analysis was published by Krüger et al., (2005). Here we recall only the most significant results which are relevant for the gossamer ring measurements: i) the sensitivity of the instrument for dust impacts and noise dropped with time, ii) the amplification of the charge amplifiers degraded, leading to reduced measured impact charge values, iii) drifts in the charge rise times measured at the target and the ion collector lead to prolonged rise time measurements, iv) degradation of the channeltron required five increases of the channeltron high voltage during the Galileo Jupiter mission, v) no impact or noise event was registered in the highest ion charge amplitude ranges AR5 and AR6 after July 1999. In particular, ii) and iii) affect the mass and speed calibration of the dust instrument. For dust measurements taken after the year 2000, masses and speeds derived from the instrument calibration must be taken with caution because the electronics degradation was severe. Only in cases where impact speeds are known from other arguments, such as exist here in the gossamer rings, can reliable particle masses be derived. This will be discussed in more detail in Section 3.3.
3 Results
3.1 Dust Impact Rates
In Figure 5 we show examples of the impact rates measured during either gossamer ring passage of Galileo as derived from the accumulators of the dust instrument. We show the rates for the classes and amplitude ranges for which a sufficiently large number of events were counted so that meaningful rate curves could be derived.
The rates measured in all categories (i.e. classes and ion amplitude ranges) increased during approach to Jupiter. From the outer edge of the Thebe ring extension until the time when the dust measurements stopped in the Amalthea ring due to the spacecraft anomaly, the increase was about two orders of magnitude in the lowest channels, AR1, whereas it was only one order of magnitude in the higher channels (AR2-4). This indicates a higher fraction of small particles in the Amalthea ring than in the Thebe ring and the faint Thebe ring extension. In all channels, the highest rates occurred inside Amalthea’s orbit when the spacecraft crossed into the more densely populated Amalthea ring. No impacts were measured in the largest categories AR5 and AR6 during both gossamer ring passages.
The instrument accumulators do not contain any information of whether the counted events were due to noise or real dust impacts. Since several of the instrument channels were sensitive to noise (cf. Section 2.2) an empirical noise correction factor had to be applied. This factor can only be derived from the data sets transmitted with their full information and it is taken as the ratio between the number of noise events and the total number of events transmitted within a given time interval (dust plus noise; see also Krüger et al.,, 2001). Here, the noise rate was calculated as the average over a 1 hour interval. The criteria for the identification of individual noise events in the gossamer ring data are given in Section 2.2.
The rate data from the first ring passage show a dip between Thebe’s and Amalthea’s orbits. It is most obvious in the lowest amplitude range AR1 where we have the highest number of counted events. The event rate dropped by about a factor of two to five at this location, and the measurements obtained for other particle sizes and during the second ring passage are consistent with the existence of this dip. It should be noted, however, that the noise rate in classes 1 and 2 exceeded 80% during some periods of the ring passage so that the noise removal lead to large uncertainties in the impact rate. Only class 3, our highest quality class, was noise-free but unfortunately the event rate detected in this category was normally too low to construct a useful impact rate profile. The data in the lowest amplitude range alone are not convincing, however, the higher channels, which are mostly noise-free, show a similar drop inside Thebe’s orbit. This is evident in class 2, AR4 from the first passage (top right panel in Figure 5). During the second ring passage, a sufficiently large number of class 3, AR4 events were transmitted so that an impact rate profile from this noise-free channel could be constructed (bottom right panel in Figure 5). This data also indicates a dip inside Thebe’s orbit. Additional support for this interpretation comes from increased energetic particle fluxes measured in the dip region with the EPD instrument onboard Galileo (Norbert Krupp, priv. comm.). We therefore conclude that the dip in the impact rate is real, implying a true drop in the dust number density in the Thebe ring. The consequences for grain dynamics and the ring structure will be discussed in Section 4.4.
An additional feature is the extension of the outer gossamer ring far beyond its previously known outer edge at . Interestingly, the impact rate profile for the smallest particles is relatively flat beyond whereas inside this distance it increases towards Jupiter. These small submicron particles do not scatter light well and so cannot be seen in optical images; they may be in the process of escaping the gossamer rings as predicted by Hamilton and Burns, (1993).
During its first ring passage on 5 November 2002 Galileo had a close flyby of 100-km Amalthea at a closest approach distance of 244 km from the moon’s center. Because the Amalthea gossamer ring is believed to be maintained by collisional ejecta from Amalthea itself, an increased dust impact rate is to be expected in the close vicinity of this moon. Galileo detected ejecta dust clouds within the Hill spheres of all four Galilean moons, but outside the Hill spheres there was no noticeable enhancement (Krüger et al., 1999c, ; Krüger et al.,, 2003). Taking the recently determined mass of Amalthea (Anderson et al.,, 2005), its Hill radius is , only slightly larger than the moon itself. Thus a spike in the dust flux was not expected, and is not apparent in the -second period that Galileo was within 500 km of Amalthea. Determining the role of Amalthea as both a source and sink for gossamer ring dust grains requires detailed physical models of i) the interplanetary impactor population and ii) ring particle dynamics. This primarily theoretical task is beyond the scope of the current paper.
3.2 Grain Impact Direction
Images of the gossamer rings taken with Galileo and Earth-based telescopes imply that the orbits of the ring particles have very low inclinations with respect to Jupiter’s equatorial plane below , and that the majority of the grains move on low-eccentric or even circular orbits (de Pater et al.,, 1999; Ockert-Bell et al.,, 1999; Burns et al.,, 1999). In order to calculate the impact direction of the measured ring particles onto the sensor target and the corresponding effective sensor area for these grains, we assumed that the particles orbit Jupiter on circular prograde trajectories with effectively zero inclination
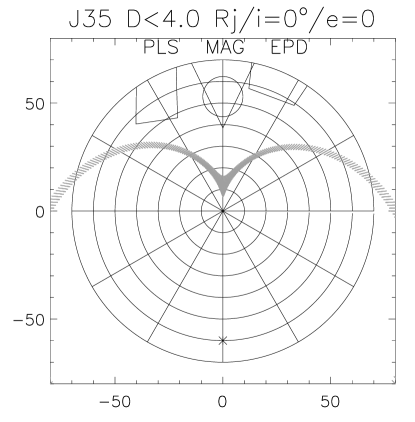
The only additional parameters necessary are the spacecraft trajectory (state vectors) and spacecraft orientation. The spacecraft trajectory is shown in Figures 1 and 2, and the spacecraft orientation is constrained by the fact that the antenna pointed within of the Earth direction during both passages of Galileo through the gossamer rings.
With these assumptions, for particles assumed to be on prograde circular orbits, we calculated the dust impact direction and the corresponding sensor area. During the first ring passage, the angle with respect to the spin axis varied by only in the time interval of interest here when we obtained high-rate recorded data from the ring region. In this interval the target area, averaged over one spacecraft spin revolution, was . During the second ring passage varied by about and the sensor target area changed between 200 and . For both passages the expected rotation angle for particles orbiting Jupiter on prograde circular trajectories was , and that for retrograde trajectories .
The range of the rotation angle distribution is determined by the sensor FOV which is nominally . A smaller FOV was found for a subset of the ten-nanometer-sized jovian dust stream particle impacts (Krüger et al., 1999b, ); we believe that this reduction is due to the small sizes and rapid speeds of stream particles. In the gossamer rings, by contrast, we expect a larger than nominal effective FOV; recent analysis of Galileo and Ulysses dust data showed that the sensor FOV for particles much larger than the jovian dust streams population is almost because the inner sensor side wall showed a sensitivity for dust impacts comparable to that of the target itself (Altobelli et al.,, 2004; Willis et al.,, 2004, 2005). We therefore consider an extended FOV for the analysis of gossamer ring particles.
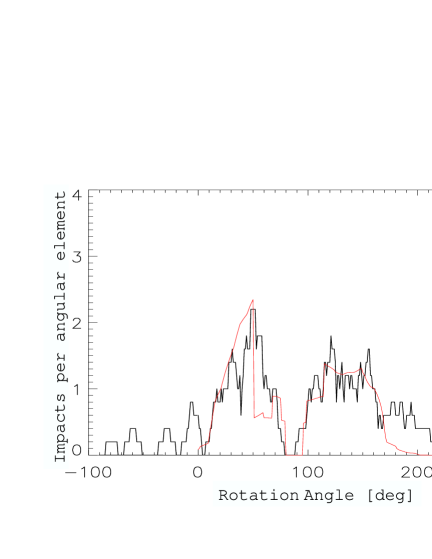
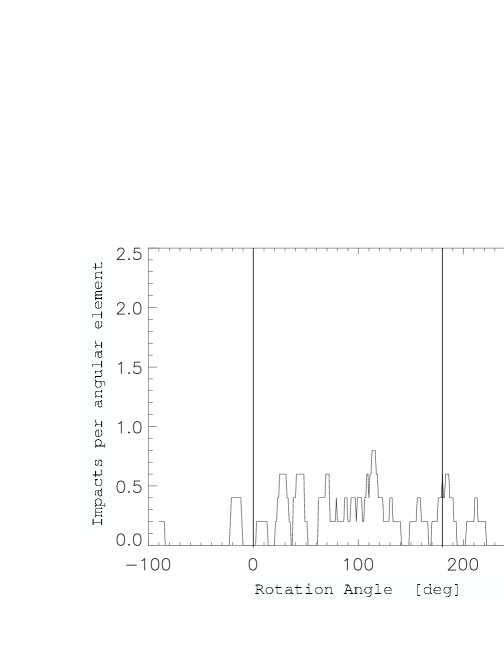
The rotation angles of the dust impacts measured during both ring passages are shown in Figure 6 and histograms showing the number of impacts per rotation angle bin are given in Figure 7. The rotation angle distribution measured during the first ring passage (A34 on 5 November 2002) shows a broad gap at having a width . This is due to shadowing by the magnetometer boom (see Fig. 4). No such gap in the distribution occurred during the J35 encounter (Fig. 6), consistent with the geometry of that final ring passage (Fig. 4).
As can be seen in Figure 6, the distribution of the rotation angles measured during the first gossamer ring passage is much wider than expected for a sensor target with FOV. The expected width of the rotation angle distribution for particles on prograde circular orbits was (cf. Figure 4; an analysis of vs. – the angle between the impact direction and the spacecraft spin axis – is given by Krüger,, 2003, his Figure 2.7b). Hence, the distribution of measured rotation angles should cover the range . About half of the impacts, however, were detected with rotation angles or . If we include the sensor side wall, the expected range widens to but is still smaller than the measured range. A similarly extended distribution was also measured during the second ring passage on 21 September 2003.
The rotation angle distribution shows even more structure than just the gap at : Figure 7 reveals an asymmetry in the sense that the distribution with rotation angles is broader and shallower than the one with . Moissl, (2005) modelled the shadowing of the dust sensor FOV by the magnetometer boom, the PLS and EPD instruments. The model assumes an inclination distribution consistent with the measured rotation angles (Figure 6) and a sensitive area of target plus side wall. A modelled curve for particles on circular jovicentric orbits with up to inclinations is shown as a grey solid line in Figure 7. It gives an overall good agreement with the measured distribution, in particular considering that the spacecraft structures shading the dust sensor are described by relatively simple approximations and that the statistics of detected grains is rather low. Deviations occur at and at the edge of the dust sensor FOV at . In both cases the model underestimates the true number of detections. It has to be noted that particularly large uncertainties occur at the edge of the FOV where the sensitive area drops to zero. Also, the modelled curve underestimates the true width of the rotation angle distribution. It indicates that a fraction of the detected grains may have had orbits with even larger inclinations up to about and eccentricities up to 0.2 (Moissl,, 2005). In all, the particle orbits significantly differ from the circular uninclined case implied by the ring images.
One additional potential reason for the extended rotation angle distribution may be impacts onto the spacecraft structure close to the dust sensor. Impacts preferentially onto the magnetometer boom may have generated impact plasma and secondary grain fragments which may have hit the dust sensor, resembling true impacts at rotation angles where direct impacts of ring particles onto the target are impossible. Such events should have revealed their presence by peculiar impact parameters (charge amplitudes, rise times, coincidences etc.). An analysis of the data from both ring passages, however, did not show evidence for such peculiarities for the majority of grains, making this explanation unlikely (Moissl,, 2005). The extended distribution appears, therefore, to be due to the actual distribution of dust and implies large inclinations for many dust particles. Inclinations of this magnitude are expected from the model of Hamilton and Krüger, (2008).
3.3 Grain Masses
About 90% of the dust impacts measured during both gossamer ring passages showed abnormally long rise times of the impact charge signal caused by degradation of the instrument electronics (Section 2.4). Application of the instrument calibration derived in the laboratory before launch would lead to unrealistically low impact speeds and, consequently, erroneously large grain masses. Thus, the rise time measurement cannot be used for calculating grain impact speeds. In the gossamer rings, impact speeds are dominated by the spacecraft’s speed and, assuming that the particles move on nearly uninclined circular orbits, the impact speed onto the detector target on 5 November 2002 was about . We use this fact as the basis for a procedure to obtain particle mass and number density distributions. An overview of the individual processing steps is given in Figure 8.
We begin by taking instead of the speed derived from the rise time measurement and calculate the particle mass with Equation 1, i.e. employing the linear dependence between particle mass and impact charge . Similar mass calibration methods were successfully applied to earlier measurements of interstellar dust grains (Landgraf et al.,, 2000) and to dust impacts measured in the vicinity of the Galilean moons (Krüger et al.,, 2000, 2003).
An extra complication here is the amplifier degradation that arose from the accumulated radiation damage to the dust instrument. The damage causes the measured charge amplitude to be too low by a time-dependent factor that has been calculated by Krüger et al., (2005). For the time period of interest, we estimate the additional radiation damage received by the spacecraft and determine a correction factor of 5 for the ion collector channel and a factor of 2 for the electron channel, respectively. This means that measured charges for gossamer ring particles need to be increased by a factor of 5 and 2, respectively, to determine the true impact charges for these channels. Due to the linear dependence between impact charge and grain mass (Equation 1) this leads to an average shift in grain mass by a factor of 3.5.
In Figure 9 we show the mass distributions derived for four different regions of the gossamer rings. We include measurements from: i) the region between Io’s orbit and the outer edge of the Thebe Extension (6 to ), ii) the Thebe Extension (between and Thebe’s orbit), iii) the Thebe ring (between Thebe’s and Amalthea’s orbit), and iv) the Amalthea ring (inside Amalthea’s orbit). Dust in the outermost of these regions is poorly sampled by the spacecraft and invisible from the ground. Better statistics exist for dust amongst the Galilean satellites (Grün et al.,, 1998; Thiessenhusen et al.,, 2000; Krivov et al., 2002a, ; Krivov et al., 2002b, ; Zeehandelaar and Hamilton,, 2007).
To illustrate the significance of the corrections for instrument aging and for incomplete data transmission, we show both uncorrected and corrected histograms. The aging correction shifts the entire distribution by a factor of 3.5 to higher masses. Coincidently, this corresponds to the width of half an amplitude range interval on a logarithmic scale so that the aging correction shifts the mass distribution by one histogram bin. Furthermore, to correct for incomplete transmission, we calculated a correction factor from the ratio between the number of counted impacts and the number of data sets transmitted in a given time interval. We took into account that the leftmost two bins correspond to AR1, the next two bins to AR2 and so on. Note that the transmission correction is most significant in the leftmost two bins (AR1) and nearly negligible in the other bins.
According to Figure 9 the largest detected particles have masses . Assuming spherical particles with density (representative of water ice), the corresponding grain radius is . For grain densities of 500 and the grain radius is 6 and , respectively. Similarly, the smallest mass just exceeding the detection threshold, , corresponds to . Thus, is a plausible size range from the calibration of the impact charges after correction for electronics aging. This shows that the size distribution extends to particles one order of magnitude smaller than derived from ring images. On the other hand, the largest sizes agree rather well with particle sizes deduced from imaging of the gossamer ring (Showalter et al.,, 1985, 2008) and Jupiter’s main ring (Throop et al.,, 2004; Brooks et al.,, 2004). The only other information on ring particle sizes comes from three impacts detected at ring plane crossing by the Pioneer 10 and Pioneer 11 spacecraft (Humes,, 1976). The Pioneer 10 detector was sensitive to particles larger than about while the Pioneer 11 detector was sensitive to particles roughly twice as large; these early measurements first showed that there was 10 micron dust in Jupiter’s equatorial plane.
Only 20 data sets of impact events were transmitted from the second ring passage (J35) and this low number does not allow us to derive statistically meaningful mass distributions for the individual ring regions. In addition, the mass calibration of these data is even more uncertain because of the rapid degradation of the dust instrument electronics due to accelerated radiation damage very close to Jupiter (Krüger et al.,, 2005, their Fig. 2).
It is evident that the mass distribution is very similar in the faint Thebe ring extension and in the Thebe ring, while it is much steeper in the Amalthea ring. One has to keep in mind, however, that this steeper slope is dominated by the leftmost two bins of the distribution for masses – which required the largest corrections for noise removal and incomplete transmission. Although these bins required the largest corrections we are convinced that the strong excess in small grains is real.
The slopes of the differential mass distributions given by (with being the number of particles per logarithmic mass interval) for the individual ring regions are listed in Table 2. While the slopes of the Thebe ring and Thebe extension are well reproduced by power laws the slope for the Amalthea ring is not very well described by a power law.
Note that in all histograms the leftmost bin is lower than the next one at higher masses. This is a well known effect (Krüger et al.,, 2006, their Fig. 6) and is most likely due to the fact that the sensitivity threshold of the dust instrument may not be sharp. We therefore did not include the leftmost bin in the fitting of power law slopes to the mass distributions.
Interestingly, the slopes tend to steepen significantly when going from the outer to the inner ring regions. This is due to the weakening of electromagnetic forces in the vicinity of synchronous orbit () - small particles that are expelled from the Thebe ring cannot be ejected from the Amalthea ring (Hamilton and Burns,, 1993; Hamilton and Krüger,, 2008).
The cumulative mass distributions for the individual ring regions are shown in Figure 10. Again, the distribution for the Amalthea ring is the steepest. The resulting power law slopes obtained from linear fits to the data are approximately between and and are tabulated in Table 2. These slopes agree very well with the slopes measured in-situ in impact-generated dust clouds at the Galilean moons (Krüger et al.,, 2003), while they are much flatter than slopes derived for Saturn’s E ring (S. Kempf, priv. comm.). This indicates that the majority of the detected grains are collisional ejecta from hypervelocity impacts onto the surfaces of the moons embedded in the gossamer rings (mostly Amalthea and Thebe).
3.4 Dust Number Density
Each of the impact charge amplitude ranges of the dust instrument corresponds to a factor of 10 in impact charge and, hence, a factor of 10 in mass (for constant impact speed; cf. Equation 1). Therefore, a number density distribution derived from the accumulators directly reflects the grain mass distribution. We use this approach to construct relative grain size distributions in the individual gossamer rings without using the dust instrument calibration from the laboratory. The individual data processing steps are again summarised in Figure 8.
The dust number density is proportional to the impact rate recorded by the dust instrument, and the relation between both quantities is given by:
| (2) |
is the sensor area as a function of the angle with respect to the spacecraft spin axis, and is the grain impact speed. To obtain impact rates, we separated different ring regions into distance bins and divided the number of particles counted in a given distance bin by the time Galileo spent in this bin.
In Figure 11 we show the number densities derived from the accumulators of the four amplitude ranges for the individual gossamer ring regions. Number densities measured during both gossamer ring passages agree to within about 50 %, except in the region between Io’s orbit and the outer ring edge. Here the measurements disagree by a factor of 3 (Figure 11). Despite the low number of dust detections in this ring region and the uncertainty due to the noise removal, we believe that this difference in the number density is likely real, pointing to azimuthal variations in the dust ring density itself.
Hamilton and Krüger, (2008) have proposed that a shadow resonance governs the behavior of the gossamer rings and their Figure 3 shows that the diffuse outer Thebe ring should be asymmetric and offset away from the Sun. Such a structure would yield a larger impact flux to a spacecraft approaching from the anti-Sun hemisphere (A34, the first passage) than from the sunward hemisphere (J35, the second passage) - see Figure 1. This is in qualitative agreement with the difference in the outermost ring regions observed here. Moreover, the Hamilton and Krüger model also predicts that larger particles should not spread very far outward from their Thebe and Amalthea sources in agreement with the lack of AR4 grains in Figure 11 beyond the outer visible edge of the Thebe ring.”
Total number densities obtained by adding the values for each histogram bin in each panel are given in Table 3. These values take into account the sensor target only. If we assume that the sensitivity of the side wall is the same as that of the target, the number densities derived from the first ring passage are lower by about 50 % while those for the second passage are reduced by only about 10 %. This leads to somewhat better agreement between the two passages. For the mass densities given in Table 3 we have assumed spherical grains with density .
In Table 3 we also give number densities for dust populations detected by Galileo beyond the orbit of Io. Number densities derived for the various ring regions smoothly drop with increasing jovicentric distance, showing that Jupiter’s faint ring system fills the entire space from the gossamer rings close to Jupiter out to the region of the Galilean moons and beyond.
4 Discussion
4.1 Comparison of In-Situ Data and Remote Imaging
From optical imaging, ring particle size distributions can be estimated by making assumptions about grain optical properties including the real and imaginary components of the index of refraction and roughness parameters. Similarly, deriving size distributions from the Galileo dust impact data requires assumptions about instrument aging and impact velocities. When both optical and in-situ data are available, a new method for determining sizes is possible.
The new method has the advantage of depending only on well-measured quantities: the ring normal optical depth, , the ring’s vertical extension, , both derived from imaging, and the number density, , measured in-situ. In particular, this calculation is independent of the mass calibration of the dust instrument. Relevant ring properties are given in Table 4. The optical depth has the biggest error bar whereas the ring’s vertical extension is rather well known. Furthermore, imaging shows that the rings are most tenuous near Jupiter’s equatorial plane and densest near their vertical limits (Ockert-Bell et al.,, 1999; de Pater et al.,, 1999).
The typical ring particle radius can be expressed as
| (3) |
Here, is the number density measured in-situ of grains dominating the optical cross-section. But what should we use for ? Summing over all amplitude ranges yields the number densities given in Table 3 and an effective grain radius . In this simple analysis all measured particle sizes contribute to the optical cross-section.
For a more realistic calculation we have to take into account that imaging is most sensitive to those particles which have the largest cross-section for reflecting light. Using the fact that amplitude ranges AR1-4 correspond to a factor of 1000 in mass (100 in area), Figure 12 shows the relative contribution of the four amplitude ranges to the optical cross section. In all ring regions the biggest contribution to the optical depth comes from the biggest grains (AR4), even though the smallest ones (AR1) dominate the number density. Thus, a better choice for is to use AR4 only.
Now taking the number densities from Figure 11 for AR4 only, the derived grain radii are for the Thebe ring and for the Amalthea ring, respectively. Given that the uncertainty in the optical depth is about a factor of 5 and that of the number density is a factor of 2, we think that the grain radii are uncertain by perhaps a factor of 3. These sizes are consistent with the optical measurements (Showalter et al.,, 2008), and they agree within about a factor of 2 with the biggest sizes obtained from the calibrated in-situ data. Given the overall uncertainties of the dust instrument calibration and the calculation of the optical depths, the agreement between the two methods is quite satisfactory.
4.2 Grain Size Distributions
In Sections 3.3 and 3.4 we determined the grain mass distributions in two different ways. Both analyses produced the steepest distributions in the Amalthea ring while further away from Jupiter the distributions are much flatter. However, the slopes derived from the number density distributions (Section 3.4) are somewhat flatter than those obtained from the mass distributions (Section 3.3, see also Table 2). These flatter slopes are probably due to an unsharp detection threshold of the dust instrument (Krüger et al.,, 2006), leading to an unrealistically depleted leftmost mass bin for the smallest particles (Figure 9). In order to get an estimate of the influence of this effect on the slopes derived from the number densities, we recalculated the mass distributions by including all bins in the fit: the mass distributions became flatter, except for the Amalthea ring (see below), and they agreed very well with the slopes derived from the number densities. This supports our contention that the leftmost mass bin is incomplete and should be ignored as we do in our derivation of column 2 of Table 2. We therefore conclude that the slopes of the mass distributions obtained from the instrument calibration are a better measure of the true distributions in the ring than those derived from the number densities.
In the Amalthea ring the fit with all bins gives a slope of for all bins which is somewhat steeper than the slope obtained from the number density (). This also indicates that the correction for incomplete transmission for the Amalthea ring (which mostly affects the two left-most bins in the mass distribution) may be too strong.
Showalter et al., (2008) derived a size distribution for the Amalthea ring which is brightest in the imaging. They get a power law slope of to in the size range . Therefore, the in-situ measurements and the imaging results compliment each other with only little overlap in the sensitive size range. Furthermore, a size distribution for the main jovian ring was recently determined from Galileo observations by Brooks et al., (2004). They find a power law slope of for particles below and a transition to a power law with slope at larger sizes.
In Figure 13 we compare these distributions with our in-situ measurements. Note that the size distribution for the Amalthea ring derived from our in-situ measurements for the small grains agrees very well with the one obtained from images for large grains. Beyond Amalthea’s orbit the size distribution for submicron grains becomes flatter while little is known about the abundance of grains bigger than in these regions.
Figure 13 is the most complete compilation of the grain size distributions in the jovian ring system presently available. It is obvious that even though the small submicron particles are the most abundant in the rings (top panel), the largest contribution to the total ring mass comes from the bigger grains above (bottom panel; see also Section 4.3).
4.3 Total Ring Mass
From the number density measured in-situ in the rings (Figure 11) and the known ring volume, we calculate the entire ring dust mass contained in the small particles (). Taking the dimensions of the Amalthea and Thebe rings given in Table 4 and noting that the average density near the midplane is half that of the vertical extremes, the total mass in each of these two gossamer ring components is about 1 to . For the Thebe ring extension we find a similar value of about of dust, assuming that this ring has the same vertical extension as the Thebe ring itself. The ring masses for the Thebe ring and Thebe ring extension derived from Galileo’s two independent ring passages agree to within 15 %. For the ring region between the outer edge of the Thebe ring extension and Io’s orbit we assumed the same vertical extension as for the Thebe ring extension. Note, however, that there is no optical data available for this region and dynamical simulations show that the ring is likely further extended. Therefore, the derived ring mass of is a lower limit. Furthermore, the two ring passages give results that differ by a factor of three as discussed in Section 3.4. This is probably due to the very asymmetric shape of the outermost ring (Hamilton and Krüger,, 2008). We collect these numbers in Table 3.
In Figure 13 we compare the size distributions measured in-situ (solid lines) with the ones derived from imaging (dashed and dotted lines). The curves are on an arbitrary scale and shifted vertically such that they fit together at . The bottom panel shows that the small grains measured in-situ represent only a minor fraction of the total ring mass contained in the dust: Assuming that the size distribution for optically visible grains in the size range 4 to measured by Showalter et al., (2008) is valid for all gossamer rings, the total ring mass is increased by a factor of over the values for small particles we list in Table 3. Similarly, if we take the bimodal size distribution derived for the main jovian ring by Brooks et al., (2004) in the size range 0.1 to , the gossamer ring mass increases by a factor of .
4.4 Grain Dynamics
The interesting properties of the gossamer rings can be most easily explained with the shadow resonance model of Hamilton and Krüger, (2008). The shadow resonance is an electromagnetic effect that occurs when a dust grain enters Jupiter’s shadow, photoelectric charging by solar radiation switches off, and the grain’s electric potential decreases. This leads to an oscillating particle charge due to the switch on and off of photoelectric charging on the day and night side of the planet (shadow resonance). It changes the electromagnetic force acting on the particle and results in coupled oscillations of the orbital eccentricity and semimajor axis. The oscillations cause the rings to extend significantly outward, but only slightly inward, of their source moons while preserving their vertical thicknesses. This is exactly what is observed for the Thebe ring extension. Furthermore, it leads to longitudinally asymmetric gossamer rings, offset from the Sun for positive grain charges and, in the absence of a dissipative drag force, to a lack of material inside a certain distance from Jupiter. If most ring material is reabsorbed by the satellites before drag forces can draw it inward, this would create the gap interior to Thebe that is visible in the rate plots in Figure 5. Showalter et al., (2008) also see evidence for a dropoff of number density interior to Thebe’s orbit.
The existence of an at least 15000 km wide gap in Jupiter’s gossamer ring between Thebe and Amalthea has to be explained by the dust particle dynamics. Dynamical modelling by Hamilton and Krüger, (2008) shows that the shadow resonance, first investigated by Horányi and Burns, (1991), can cause gaps of material interior to Thebe’s orbit, lead to inclinations up to for some grains, raise the fraction of small particles in the inner ring region, and can also explain the outward extension of the ring beyond the orbit of that satellite. It implies that electromagnetic effects have significant influence on the dynamics of submicron- and micron-sized dust in a planetary magnetosphere.
An additional feature of the Galileo gossamer ring data is the likely detection of particles on high inclination orbits. The possibility that spurious events, such as impacts into the detector wall or the magnetometer boom, masquerade as particles with high inclinations can be most likely ruled out. Searching for a physical explanation, the findings are consistent with grains being driven to large inclinations by the shadow resonance as well (Hamilton and Krüger,, 2008). The grains would form a halo of material faint enough to be invisible to imaging, but populated enough to be detected by direct impacts onto the Galileo sensor. Showalter et al., (2008) also see indications for a broadening of the inclinations in the Thebe ring, although only to a few degrees above and below the ring plane. Our size distribution extends to an order of magnitude smaller grains than the smallest grains detected by the images and, thus, the expectation that smaller grains should be more sensitive to the shadow resonance and thus on higher inclination orbits would be consistent with our Galileo in-situ data. One would expect, however, that the smaller grains show a wider distribution in rotation angles than the bigger ones which is in fact visible in the in-situ data: The impacts measured in AR4 during the A34 passage can mostly be explained with uninclined circular orbits while AR1 and AR3 need orbit inclinations up to . This is not confirmed by the J35 data which may be due to the low number of detections.
The shadow resonance turned out to be crucial for the structure and dust transport in Jupiter’s tenuous dusty ring. Because dust from a single source can be dispersed widely both inside and outside the source, the same mechanism may be responsible for the wide outward extension of Saturn’s E ring recently detected with the Cassini dust instrument out to at least (R. Srama, priv. comm.; Saturn radius ) or its unexpectedly large vertical extension recently seen on Cassini images (Ingersoll et al.,, 2007). In that ring, Saturn’s moon Enceladus turned out to be the major source of ring material (Spahn et al., 2006b, ; Spahn et al., 2006a, ).
5 Conclusions
The Galileo in-situ dust detector made the first successful measurements of submicron and micron-sized dust impacts in Jupiter’s gossamer rings during two ring passages of the spacecraft in 2002 and 2003. Dust impacts were measured in all three regions of the gossamer rings which had been previously identified on optical images. The region between Io’s orbit and the outer limit of the faint Thebe extension, where the ring is invisible to imaging, was also explored. The data from the two ring passages allow for the first actual comparison of in-situ dust measurements with the properties inferred from inverting optical images.
The measured impact rate profile shows a drop immediately interior to Thebe’s orbit and the grain impact directions extend over a significantly wider range than expected for grains moving about Jupiter on uninclined circular orbits. In fact, inclinations up to nicely explain the measured impact directions for most grains. We investigated the idea that spurious events, such as impacts onto the magnetometer boom, masquerade as particles with high inclinations, and are convinced that such explanations can be ruled out.
The wide range in impact directions can be explained by a shadow resonance caused by varying particle charge on the day and night side of Jupiter, driving particles onto high inclination orbits. They form a halo of material faint enough to be invisible to imaging, but populated enough to be detectable with the Galileo sensor. The faint gossamer ring extension previously imaged to about was detected out to at least , indicating that ejecta from Thebe spread much further and particle orbits get higher eccentricities than previously known. Both the gap in the ring and the faint ring extension indicate that the grain dynamics is strongly influenced by electromagnetic forces.
The measured grain sizes range from about 0.2 to , increasing towards smaller particles. Our measurements extend the known size distribution for the gossamer rings by a factor of ten towards smaller particles than previously derived from imaging. Within the measurement uncertainties, particles contributing most to the optical cross-section are about in radius, in agreement with imaging results. The grain size distribution is consistent with the majority of grains being generated by hypervelocity impacts onto the surfaces of the moons orbiting Jupiter in the gossamer ring region. While the small particles detected in-situ are the most abundant by number, at least an order of magnitude more mass is contained in particles larger than which – because of their large surface areas – also dominate ring images. The size distributions of grains measured in the gossamer rings gradually flatten with increasing distance from Jupiter due to the more efficient electromagnetically-induced escape of more distant grains (Hamilton and Krüger,, 2008).
The Galileo in-situ measurements obtained throughout the jovian magnetosphere show that the dust densities in Jupiter’s faint ring system more or less continuously drop from the region of the gossamer rings close to Jupiter out to the Galilean moons and beyond. While the inner ring regions () can be clearly seen with imaging techniques, only in-situ spacecraft can presently detect the much fainter dust that permeates near jovian space.
Acknowledgements
The authors wish to thank the Galileo project at NASA/JPL for effective and successful mission operations. This research was supported by the German Bundesministerium für Bildung und Forschung through Deutsches Zentrum für Luft- und Raumfahrt e.V. (DLR, grant 50 QJ 9503 3). Support by MPI für Kernphysik is also gratefully acknowledged. DPH would like to acknowledge NASA grant # NNG06GGF99G for support of this work and the MPI für Sonnensystemforschung for a short-term visitor’s grant.
References
- Altobelli et al., (2004) Altobelli, N., Moissl, R., Krüger, H., Landgraf, M., and Grün, E. (2004). Influence of wall impacts on the Ulysses dust detector in modelling the interstellar dust flux. Planetary and Space Science, 52:1287–1295.
- Anderson et al., (2005) Anderson, J. D., Johnson, T. V., Schubert, G., Asmar, S., Jacobson, R. A., Johnston, D., Lau, E. L., Lewis, G., Moore, W. B., Taylor, A., Thomas, P. C., and Weinwurm, G. (2005). Amalthea’s Density Is Less Than That of Water. Science, 308:1291–1293.
- Baguhl, (1993) Baguhl, M. (1993). Identifikation von Staubeinschlägen in den Daten der Mikrometeoriden-Detektoren an Bord der Raumsonden Ulysses und Galileo. PhD thesis, Ruprecht-Karls-Universität Heidelberg.
- Baguhl et al., (1993) Baguhl, M., Grün, E., Linkert, G., Linkert, D., and Siddique, N. (1993). Identification of ‘small’ dust impacts in the Ulysses dust detector data. Planetary and Space Science, 41:1085–1098.
- Brooks et al., (2004) Brooks, S. M., Esposito, L. W., Showalter, M. R., and Throop, H. B. (2004). The size distribution of Jupiter’s main ring from Galileo imaging and spectroscopy. Icarus, 170:35–57.
- Burns et al., (2001) Burns, J. A., Hamilton, D. P., and Showalter, M. R. (2001). Dusty Rings and Circumplanetary Dust: Observations and Simple Physics. In Grün, E., Gustafson, B. A. S., Dermott, S. F., and Fechtig, H., editors, Interplanetary Dust, pages 641–725. Springer Verlag, Berlin Heidelberg New York.
- Burns et al., (1999) Burns, J. A., Showalter, M. R., Hamilton, D. P., Nicholson, P. D., de Pater, I., Ockert-Bell, M. E., and Thomas, P. C. (1999). The formation of Jupiter’s faint rings. Science, 284:1146–1150.
- de Pater et al., (1999) de Pater, I., Showalter, M. R., Burns, J. A., Nicholson, P. D., Liu, M. C., Hamilton, D. P., and Graham, J. R. (1999). Keck Infrared Observations of Jupiter’s Ring System near Earth’s 1997 Ring Plane Crossing. Icarus, 138:214–223.
- Frank et al., (1992) Frank, L. A., Ackerson, K. L., Lee, J. A., English, M. R., and Pickett, G. L. (1992). The Plasma Instrumentation for the Galileo mission. Space Science Reviews, 60:283–307.
- Göller and Grün, (1989) Göller, J. R. and Grün, E. (1989). Calibration of the GALILEO/ULYSSES dust detectors with different projectile materials and at varying impact angles. Planetary and Space Science, 37:1197–1206.
- Grün et al., (1995) Grün, E., Baguhl, M., Hamilton, D. P., Kissel, J., Linkert, D., Linkert, G., and Riemann, R. (1995). Reduction of Galileo and Ulysses dust data. Planetary and Space Science, 43:941–951. Paper I.
- Grün et al., (1992) Grün, E., Fechtig, H., Hanner, M. S., Kissel, J., Lindblad, B. A., Linkert, D., Maas, D., Morfill, G. E., and Zook, H. A. (1992). The Galileo dust detector. Space Science Reviews, 60:317–340.
- Grün et al., (1996) Grün, E., Hamilton, D. P., Riemann, R., Dermott, S. F., Fechtig, H., Gustafson, B. A., Hanner, M. S., Heck, A., Horányi, M., Kissel, J., Kivelson, M., Krüger, H., Lindblad, B. A., Linkert, D., Linkert, G., Mann, I., McDonnell, J. A. M., Morfill, G. E., Polanskey, C., Schwehm, G. H., Srama, R., and Zook, H. A. (1996). Dust measurements during Galileo’s approach to Jupiter and Io encounter. Science, 274:399–401.
- Grün et al., (1998) Grün, E., Krüger, H., Graps, A., Hamilton, D. P., Heck, A., Linkert, G., Zook, H., Dermott, S. F., Fechtig, H., Gustafson, B., Hanner, M., Horányi, M., Kissel, J., Lindblad, B., Linkert, G., Mann, I., McDonnell, J. A. M., Morfill, G. E., Polanskey, C., Schwehm, G. H., and Srama, R. (1998). Galileo observes electromagnetically coupled dust in the Jovian magnetosphere. Journal of Geophysical Research, 103:20011–20022.
- Hamilton and Burns, (1993) Hamilton, D. P. and Burns, J. A. (1993). Ejection of dust from Jupiter’s gossamer ring. Nature, 364:695–699.
- Hamilton and Krüger, (2008) Hamilton, D. P. and Krüger, H. (2008). Jupiter’s shadow sculpts its gossamer rings. Nature. in press.
- Horányi and Burns, (1991) Horányi, M. and Burns, J. A. (1991). Charged dust dynamics - Orbital resonance due to planetary shadows. Journal of Geophysical Research, 96:19283–19289.
- Humes, (1976) Humes, D. H. (1976). The Jovian meteoroid environment. In Gehrels, T., editor, Jupiter, pages 1052–1067. Univ. of Arizona Press, Tucson.
- Ingersoll et al., (2007) Ingersoll, A. P., Dyudina, U. A., Ewald, S. P., and Hedman, M. (2007). Possible Dust Extended From Saturnian Ring Plane or Zodiacal Light as Seen by Cassini ISS. AGU Fall Meeting Abstracts, pages B1294+.
- Kivelson et al., (1992) Kivelson, M. G., Khurana, K. K., Means, J. D., Russell, C. T., and Snare, R. C. (1992). The Galileo magnetic field investigation. Space Science Reviews, 60:357–383.
- (21) Krivov, A. V., Krüger, H., Grün, E., Thiessenhusen, K.-U., and Hamilton, D. P. (2002a). A tenuous dust ring of Jupiter formed by escaping ejecta from the Galilean satellites. Journal of Geophysical Research, 107:E1, 10.1029/2000JE001434.
- (22) Krivov, A. V., Wardinski, I., Spahn, F., Krüger, H., and Grün, E. (2002b). Dust on the outskirts of the Jovian system. Icarus, 157:436–455.
- Krüger, (2003) Krüger, H. (2003). Jupiter’s Dust Disc, An Astrophysical Laboratory. Shaker Verlag Aachen, ISBN 3-8322-2224-3. Habilitation Thesis Ruprecht-Karls-Universität Heidelberg.
- Krüger et al., (2006) Krüger, H., Bindschadler, D., Dermott, S. F., Graps, A. L., Grün, E., Gustafson, B. A., Hamilton, D. P., Hanner, M. S., Horányi, M., Kissel, J., Lindblad, B., Linkert, D., Linkert, G., Mann, I., McDonnell, J. A. M., Moissl, R., Morfill, G. E., Polanskey, C., Schwehm, G. H., Srama, R., and Zook, H. A. (2006). Galileo dust data from the jovian system: 1997 to 1999. Planetary and Space Science, 54:879–910. Paper VIII.
- Krüger et al., (2001) Krüger, H., Grün, E., Graps, A. L., Bindschadler, D. L., Dermott, S. F., Fechtig, H., Gustafson, B. A., Hamilton, D. P., Hanner, M. S., Horányi, M., Kissel, J., Lindblad, B., Linkert, D., Linkert, G., Mann, I., McDonnell, J. A. M., Morfill, G. E., Polanskey, C., Schwehm, G. H., Srama, R., and Zook, H. A. (2001). One year of Galileo dust data from the jovian system: 1996. Planetary and Space Science, 49:1285–1301. Paper VI.
- (26) Krüger, H., Grün, E., Hamilton, D. P., Baguhl, M., Dermott, S. F., Fechtig, H., Gustafson, B. A., Hanner, M. S., Horányi, M., Kissel, J., Lindblad, B. A., Linkert, D., Linkert, G., Mann, I., McDonnell, J. A. M., Morfill, G. E., Polanskey, C., Riemann, R., Schwehm, G. H., Srama, R., and Zook, H. A. (1999a). Three years of Galileo dust data: II. 1993 to 1995. Planetary and Space Science, 47:85–106. Paper IV.
- (27) Krüger, H., Grün, E., Heck, A., and Lammers, S. (1999b). Analysis of the sensor characteristics of the Galileo dust detector with collimated Jovian dust stream particles. Planetary and Space Science, 47:1015–1028.
- Krüger et al., (2005) Krüger, H., Grün, E., Linkert, D., Linkert, G., and Moissl, R. (2005). Galileo long-term dust monitoring in the jovian magnetosphere. Planetary and Space Science, 53:1109–1120.
- Krüger et al., (2000) Krüger, H., Krivov, A. V., and Grün, E. (2000). A dust cloud of Ganymede maintained by hypervelocity impacts of interplanetary micrometeoroids. Planetary and Space Science, 48:1457–1471.
- (30) Krüger, H., Krivov, A. V., Hamilton, D. P., and Grün, E. (1999c). Detection of an impact-generated dust cloud around Ganymede. Nature, 399:558–560.
- Krüger et al., (2003) Krüger, H., Krivov, A. V., Sremčević, M., and Grün, E. (2003). Galileo measurements of impact-generated dust clouds surrounding the Galilean satellites. Icarus, 164:170–187.
- Landgraf et al., (2000) Landgraf, M., Baggeley, W. J., Grün, E., Krüger, H., and Linkert, G. (2000). Aspects of the Mass Distribution of Interstellar Dust Grains in the Solar System from in situ Measurements. Journal of Geophysical Research, 105, no. A5:10,343–10352.
- Moissl, (2005) Moissl, R. (2005). Galileo’s Staubmessungen in Jupiters Gossamer-Ringen. Ruprecht-Karls-Universität Heidelberg. Diplom thesis.
- Ockert-Bell et al., (1999) Ockert-Bell, M. E., Burns, J. A., Daubar, I. J., Thomas, P. C., Veverka, J., Belton, M. J. S., and Klaasen, K. P. (1999). The structure of Jupiter’s ring system as revealed by the Galileo imaging experiment. Icarus, 138:188–213.
- Showalter et al., (1985) Showalter, M. R., Burns, J. A., Cuzzi, J. N., and Pollack, J. B. (1985). Discovery of Jupiter’s ’gossamer’ ring. Nature, 316:526–528.
- Showalter et al., (2008) Showalter, M. R., de Pater, I., Verbanac, G., Hamilton, D. P., and Burns, J. A. (2008). Properties and Dynamics of Jupiter’s Gossamer Rings from Galileo, Voyager, Hubble and Keck Images. Icarus. in press.
- (37) Spahn, F., Albers, N., Hörning, M., Kempf, S., Krivov, A. V., Makuch, M., Schmidt, J., Seiß, M., and Miodrag Sremčević (2006a). E ring dust sources: Implications from Cassini’s dust measurements. Planetary and Space Science, 54:1024–1032.
- (38) Spahn, F., Schmidt, J., Albers, N., Hörning, M., Makuch, M., Seiß, M., Kempf, S., Srama, R., Dikarev, V., Helfert, S., Moragas-Klostermeyer, G., Krivov, A. V., Sremčević, M., Tuzzolino, A. J., Economou, T., and Grün, E. (2006b). Cassini Dust Measurements at Enceladus and Implications for the Origin of the E Ring. Science, 311:1416–1418.
- Thiessenhusen et al., (2000) Thiessenhusen, K.-U., Krüger, H., Spahn, F., and Grün, E. (2000). Dust grains around Jupiter – The observations of the Galileo Dust Detector. Icarus, 144:89–98.
- Throop et al., (2004) Throop, H. B., Porco, C. C., West, R. A., Burns, J. A., Showalter, M. R., and Nicholson, P. D. (2004). The jovian rings: new results derived from Cassini, Galileo, Voyager and Earth-based observations. Icarus, 172:59–77.
- Williams et al., (1992) Williams, D. J., McEntire, R. W., Jaskulek, S., and Wilken, B. (1992). The Galileo Energetic Particles Detector. Space Science Reviews, 60:385–412.
- Willis et al., (2005) Willis, M. J., Burchell, M., Ahrens, T. J., Krüger, H., and Grün, E. (2005). Decreased values of cosmic dust number density estimates in the solar system. Icarus, 176:440–452.
- Willis et al., (2004) Willis, M. J., Burchell, M., Cole, M., and McDonnell, J. A. M. (2004). Influence of impact ionization detection methods on determination of dust particle flux in space. Planetary and Space Science, 52:711–725.
- Zeehandelaar and Hamilton, (2007) Zeehandelaar, D. B. and Hamilton, D. P. (2007). A Local Source for the Pioneer 10 and 11 Circumjovian Dust Detections. In Krüger, H. and Graps, A. L., editor, Dust in Planetary Systems (Workshop, September 26-30 2005, Kauai, Hawaii), pages 103–106. European Space Agency, ESA Publications SP-643.
| Date (Galileo orbit number) | 5 Nov. 2002 (A34) | 21 Sept. 2003 (J35) |
|---|---|---|
| Distance range measured | ||
| Measurement time within | 100 min | 60 min |
| Time resolution | 1 min | 7 min |
| Spatial resolution (radial) | ||
| Number of dust impacts counted | ||
| Number of data sets transmitted | 90 | 20 |
| Dust impact speed† | ||
| Dust detection threshold |
†: Dust particles were assumed to orbit Jupiter on circular prograde uninclined orbits.
| Population | Differential mass distribution | Cumulative mass distribution | ||
|---|---|---|---|---|
| from | from | from | ||
| calibration | number density | calibration | ||
| A34 | A34 | J35 | A34 | |
| (1) | (2) | (3) | (4) | (5) |
| Amalthea ring | ||||
| Thebe ring | ||||
| Thebe ring extension | ||||
| Io to ring limit | () | |||
| Population | Jovicentric | Particle | Number | Mass | Dust mass in | Reference |
|---|---|---|---|---|---|---|
| distance | radii | density | density | small grains | ||
| () | () | () | () | (kg) | ||
| (1) | (2) | (3) | (4) | (5) | (6) | (7) |
| Amalthea ring | 2.33 – 2.54 | 0.2 – 5 | This work | |||
| Thebe ring | 2.54 – 3.1 | 0.2 – 5 | This work | |||
| Thebe ring extension | 3.1 – 3.75 | 0.2 – 5 | This work | |||
| Io to ring limit | 3.75 – 6 | 0.2 – 2 | This work | |||
| Galilean ring | 10 – 30 | 0.6 – 3 | Krivov et al., 2002a | |||
| Captured particles | 10 – 20 | Thiessenhusen et al., (2000) | ||||
| Distant ring | 1 – 2 | Krivov et al., 2002b |
| Amalthea Ring | Thebe Ring | Uncertainty | |
|---|---|---|---|
| Normal Optical Depth | Factor of 5 | ||
| Ring Half-Thickness | 1300 km | 4400 km |