Non-thermal radio emission from O-type stars
The star Cyg OB2 No. 9 is a well-known non-thermal radio emitter. Recent theoretical work suggests that all such O-stars should be in a binary or a multiple system. However, there is no spectroscopic evidence of a binary component. Re-analysis of radio observations from the VLA of this system over 25 years has revealed that the non-thermal emission varies with a period of yr. This is interpreted as a strong suggestion of a binary system, with the non-thermal emission arising in a wind-collision region. We derived some preliminary orbital parameters for this putative binary and revised the mass-loss rate of the primary star downward from previous estimates.
Key Words.:
stars: individual: Cyg OB2 No. 9 – stars: early type – stars: mass-loss – radiation mechanisms: non-thermal1 Introduction
The Cygnus OB2 association has been the focus of many massive-star studies. Observations show that it contains more than 2600 OB stars, of which 120 are O stars (Knödlseder K00 (2000)). It also harbours some of the hottest and most luminous stars known in our Galaxy. Several of these stars exhibit significant variations in their X-ray and/or radio continuum emission.
One of these stars is Cyg OB2 No.~9 (VI Cyg 9, Schulte 9, MT 431), which is classified as an O5If star (Massey & Thompson MT91 (1991)). It was one of the first O stars to be identified as a non-thermal radio source (Abbott et al. ABC84 (1984)). It shows the classical properties of non-thermal radio emission, such as a high brightness temperature (Phillips & Titus PT90 (1990)) and, also, a radio spectral index111The radio spectral index describes the power-law behaviour of the flux: For thermal emission +0.6. with a characteristic negative value.
The non-thermal emission comes from relativistic electrons, believed to be accelerated in shocks. Although shocks are ubiquitous in O-star winds due to the instability of the radiative driving mechanism (e.g. Owocki & Rybicki OR84 (1984)), theoretical studies show that this embedded-shock model cannot be the source of the non-thermal emission, and that the accelerating shocks arise where the two stellar winds collide (Van Loo et al. VRB06 (2006)). This conclusion necessarily implies that all non-thermal emitting O stars are in a binary system. A similar correlation between non-thermal radio emission and binarity is already well established for WR stars (Dougherty & Williams DW00 (2000)) which are the evolutionary descendants of O stars.
At present, there is no spectroscopic evidence that Cyg OB2 No. 9 is a binary. De Becker (PhDM (2005)) and Kiminki et al. (K06 (2006)) measured the radial velocity on a number of occasions. Neither study found significant variation on time-scales of a few months to a year. In the absence of spectroscopic evidence of binarity, we need to look to other indicators. Possible techniques include high-spatial resolution radio observations that reveal the characteristic shape of a wind-collision region as observed in WR~140 (Dougherty et al. DBC05 (2005)) and WR~147 (Williams et al. Wetal90 (1990)), or searching for radio variability consistent with the orbital motion of a binary (e.g. WR140: Williams et al. Wetal90 (1990)).
In this paper we demonstrate that the radio emission in Cyg OB2 No. 9 has a clearly periodic behaviour. Radio data obtained with the Very Large Array (VLA) since 1980 were re-reduced, revealing a 2.35-yr period. It is argued that this is evidence of a binary system, with the non-thermal radio emission arising in a wind-collision region.
2 Data and radio light curve
We collected archive data for Cyg OB 2 No. 9 from the NRAO Very Large Array222The National Radio Astronomy Observatory is a facility of the National Science Foundation operated under cooperative agreement by Associated Universities, Inc. archive. Many of these observations have not been published previously. To avoid introducing systematic effects in the data reduction, we re-reduced all observations consistently. Details of the reduction are given in Appendix A. The measured fluxes and their error bars (or upper limits) are listed in Table A.1.
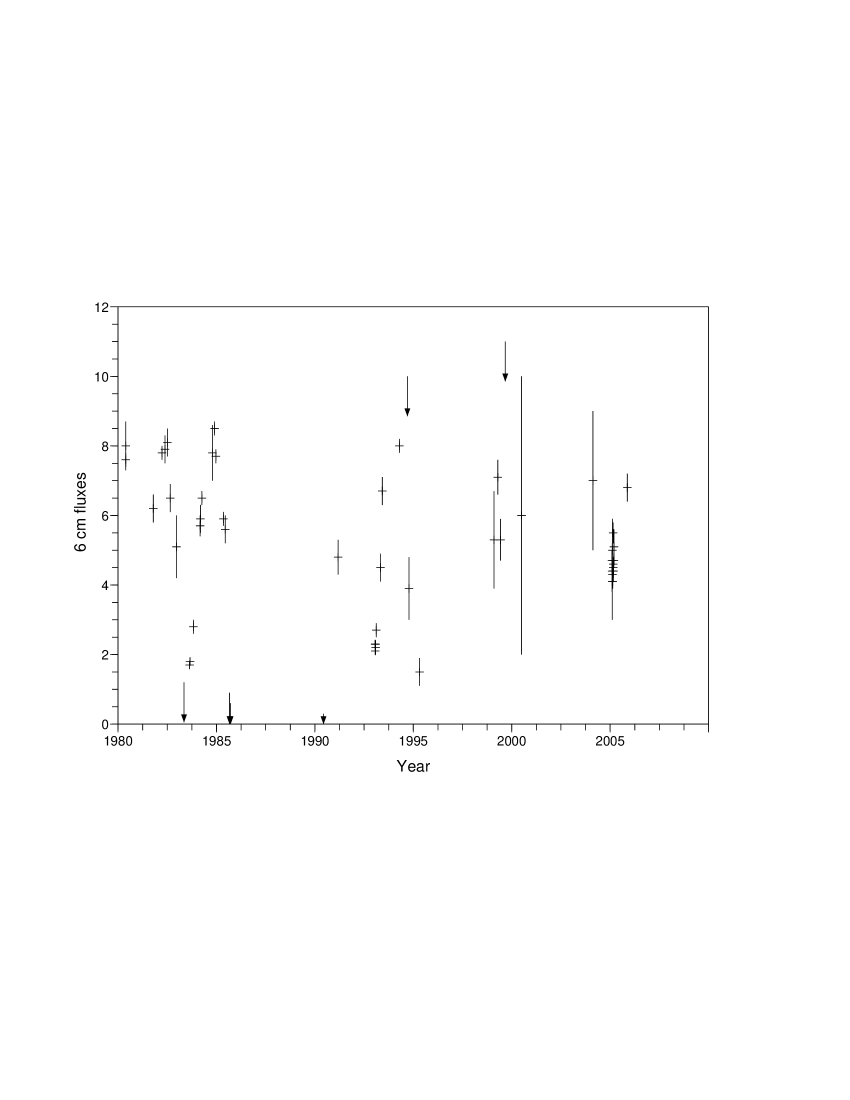
Using the observations listed in Appendix A we can look for variability at radio wavelengths. In Fig. 1 we see that the 6 cm fluxes of Cyg OB2 No. 9 are highly variable with maxima found at e.g. 24 May 1980 and 3 July 1982, and minima at e.g. 9 May 1983 and 19 September 1985. These extrema give a rough estimate of a period, that is if any period is present, of the order of 2 yr. However, due to the problem of aliasing, we cannot exclude any divisor of 2 yr.
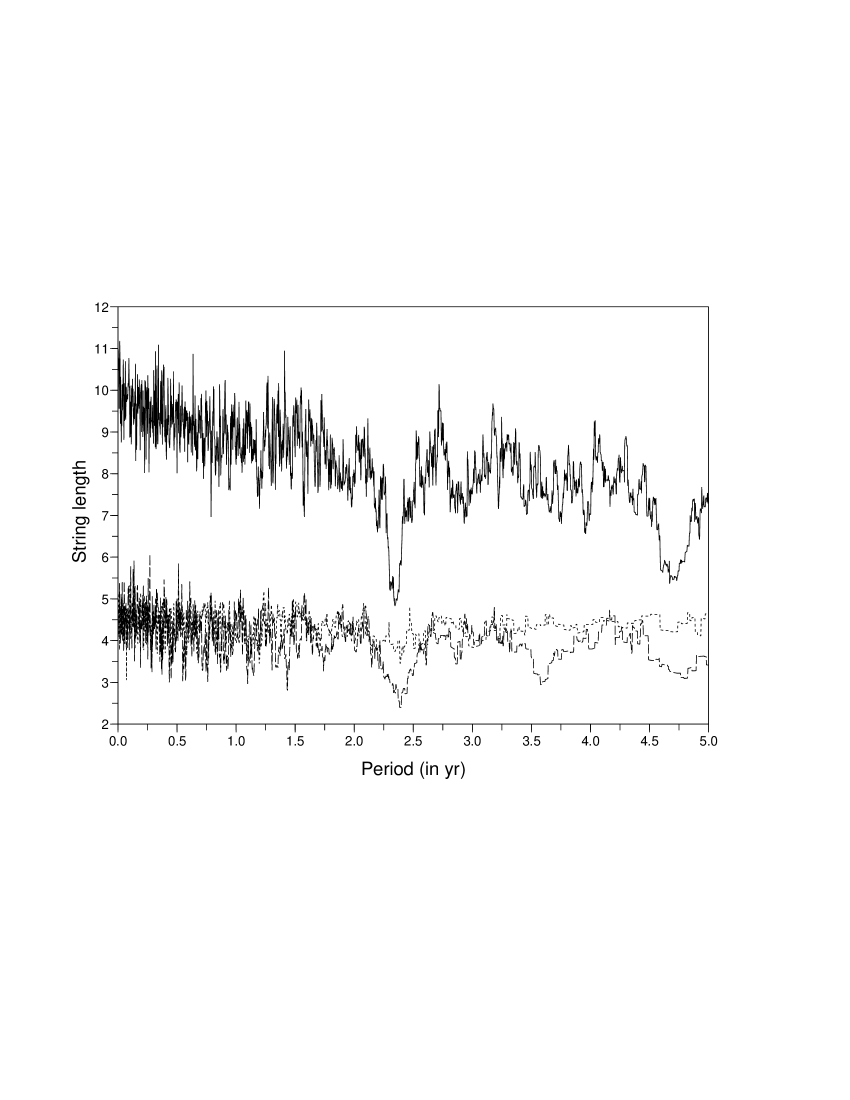
To find periodicity in the data, we apply the string-length technique described by Dworetsky (D82 (1983)) to the different wavelength observations. The period is found by minimising the distance between the flux observations in an orbital phase diagram, i.e. the string length. The string-length method is particularly useful for a small number of observations with a large separation in time. Furthermore it does not require a specific shape for the light curve. However, this method does not work when multiple periods are present in the data (e.g. Bourguignon et al. BCB07 (2007)). Also, this technique neglects the effect of errors on the observation. We, therefore, modified the method by replacing the flux difference , i.e. , by the mean flux-difference, or (where is the error on the flux) when calculating the distance between the observations.
We find a minimum in the string length between 2.3 and 2.4 yr in both the 3.6 and 6 cm fluxes (see Fig. 2). However, there is no periodicity found in the 2 and 20 cm fluxes. This is not surprising as the 2 cm fluxes have a high degree of noise making a periodicity search difficult. At 20 cm, we do not find a period because most observations have a similar flux level or a high upper limit (see Fig. 3). Using the method described by Fernie (F89 (1989)), we can estimate the true period and its uncertainty. We find yr for the 6 cm fluxes and yr for the 3.6 cm fluxes. A weighted mean and variance then gives yr. This fits well with our crude first estimate and is confirmed by other period-finding methods such as a discrete Fourier transform (Scargle S82 (1982)).

To assess the goodness of the period, Fig. 3 shows the 2, 3.6, 6 and 20 cm radio fluxes of Cyg OB 2 No. 9 folded with the 2.35-yr period. Phase 0.0 has been arbitrarily set at the lowest 6 cm upper limit (JD 2443762.18). The consistency in the light curve shows that these reduction techniques do not introduce systematic effects, though they may be responsible for a few minor effects. There are some low fluxes around phase 0.68 at 6 cm and a somewhat higher flux at phase 0.27 that we attribute to uncertainty in the absolute flux calibration (see notes in Table A).
The large number of 6 cm observations around phase 0.23–0.28 (see inset to Fig. 3) could in principle be useful to search for variations on shorter timescales. There does not seem to be significant variability however. A linear regression for this subset shows that, except for one observation which has a deviation of 3, all observations can be fitted. Furthermore, the flux increase is consistent with the gradient seen in the main figure.
3 Discussion
3.1 Binarity
The 2.35 yr period derived for the non-thermal radio emission of Cyg OB 2 No. 9 is strongly suggestive of a binary system with non-thermal radio emission arising in a wind-collision region. The intrinsic synchrotron radiation of the wind-collision region changes as a function of the binary separation, while free-free absorption removes some of the intrinsic emission, depending on the position in the wind (i.e. optical depth along the line-of-sight to the observer). Other mechanisms such as inverse-Compton cooling and the Razin effect are also dependent on the binary separation (e.g. Pittard et al. Petal06 (2006)). These mechanisms therefore produce a radio light curve that is modulated by the binary orbit. For WR 140, the best studied example of a colliding-wind binary, the radio light curve shows good repeatability from one orbital period to another (White & Becker WB95 (1995)).
The binarity of Cyg OB2 No. 9 could in principle show up in other observational diagnostics. We review a number of them below.
Optical observations
The semi-major axis, , of the binary can be estimated from
| (1) |
where is the mass of the binary system. A lower limit on the mass of Cyg OB2 No. 9 can be estimated on the basis of the Eddington limit
Using (Herrero et al. Hetal99 (1999)) we find . For hot, massive stars, however, the Eddington parameter is often within a factor of two below unity, so that the stellar mass is more likely to be . This agrees well with observational estimates of the evolutionary mass, i.e. (Herrero et al. Hetal99 (1999)). Although we cannot say anything about the actual mass of the binary, it is unlikely to exceed , the mass of the most massive hot-star binary known, WR20a (Rauw et al. Rauw04 (2004)). For a binary mass between 80 and 140 , we find a semi-major axis of AU from Eq. (1).
The separation between the binary components lies within the range. This means that, even for large eccentricities, the maximum separation is 18 AU. With a distance to the Cyg OB2 association of 1.82 kpc (Bica et al. Betal03 (2003)), the components have a maximum separation on the plane of only 0.01 arcsec. A Hubble FGS (Project: FGS 10612; PI: D. Gies 333URL: http://www.stsci.edu/observing/phase2-public/10612.pro) observation of Cyg OB No. 9 in April 2006 looked for a binary companion with luminosity difference less than 4 magnitudes within a 0.01 - 1 arcsec region around the primary. Given the estimated separation, it is unlikely that a companion can be detected using FGS.
Radial velocity measurements
Two independent studies of radial velocity variations by De Becker (PhDM (2005)) and Kiminki et al. (K06 (2006)) did not find any significant changes in radial velocity. However, by combining the measurements of these studies, we find that a constant radial velocity can be rejected on a 97 % confidence level. Thus, Cyg OB2 No. 9 is a possible binary by the criterion of Kiminki et al. (K06 (2006)). Furthermore, re-examination of spectroscopic archive data shows a possible double-lined spectrum (Kiminki, priv. comm.). Additional spectroscopic observations are needed to confirm the preliminary spectroscopic evidence of binarity.
With the derived constraints on the binary separation and the period, the expected amplitude of the radial velocity variations can be calculated. The observed variation is likely to be due to the motion of the primary. For a Keplerian orbit, the radial velocity amplitude is given by
| (2) |
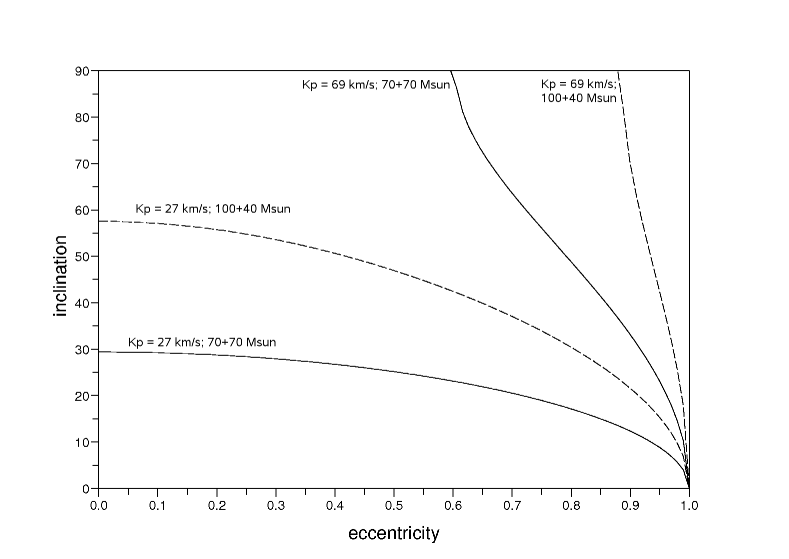
where and are the semi-major axis of the primary star and the binary system respectively, and the mass of the primary and secondary star respectively, the inclination angle and the eccentricity. For a binary, which gives . For a binary, one finds . This can then be compared to the observed radial velocity amplitude. By combining both data sets of De Becker (PhDM (2005)) and Kiminki et al. (K06 (2006)), we find a marginally significant variation with a radial velocity amplitude between 27 and .
We find that this comparison allows a first estimate of the orbital parameters of the system, through the constraint on the function . Figure 4 shows the permitted values of the eccentricity and the inclination for different binary mass ratios. Due to the broad range of possible radial velocity amplitudes, we only find a weak constraint on the inclination and eccentricity. However, the derived value for the radial velocity variation is subject to considerable uncertainty: the sampling of the orbit is sparse, which makes it likely that the maximum variation was missed. More recent observations suggest that the radial velocity amplitude tends to the upper value of our adopted range (Nazé, pers. comm.). This favours a high eccentricity orbit () viewed at a substantial inclination, e.g. .
X-ray emission
A non-thermal radio emitting binary should produce both thermal and non-thermal X-rays. The non-thermal component is produced by inverse-Compton cooling of relativistic electrons in the strong stellar ultraviolet radiation field. The thermal component is produced by the hot gas ( K) produced in the wind collision. For a long period binary such as Cyg OB2 No. 9, this thermal component is hard, and dominates the non-thermal contribution in the 0.5 – 10 keV range (De Becker PhDM (2005)). Depending on orbital parameters, some modulation of the X-ray emission with the orbital period can be expected. However, the X-ray emission of Cyg OB2 No. 9 remains relatively stable for 15 years (Waldron et al. W98 (1998)). However, it should be noted that the X-ray observations are sparsely distributed throughout the orbital phase space, and variations due to orbital changes might have been missed.
By fitting the X-ray data with a two-temperature model, Rauw et al. (Retal05 (2005)) find that the higher temperature of the two, i.e. 12 K, agrees well with the temperatures expected in a wind-collision binary (Stevens et al. SBP92 (1992)). Interestingly, the observed X-ray emission from No. 9 is smaller than the canonical (Waldron et al. W98 (1998)). Although some scatter around this value can be expected, binaries are often much brighter in X-rays than single stars (Pollock P87 (1987)). In this regard, Cyg OB2 No. 9 does not have a typical X-ray luminosity for a binary.
Emission line variability
Another possible indicator of colliding winds is the shape and variability of the emission lines. In the colliding-wind binary Cyg OB2 No. 5, the He II 4686 line shows orbital phase variations, but with a phase offset compared to the photospheric lines. This shows that at least part of this line is formed in the colliding-wind region (Rauw et al. Retal99 (1999)). Similar effects could be present in Cyg OB2 No. 9.
High-spatial resolution radio observations
Recent high-resolution radio observations of Cyg OB2 No. 9 with the VLBA reveal a bow-shaped emission region (Dougherty et al., in prep). This is consistent with emission arising in a wind-collision region, and is very reminiscent of the emission distribution observed in proto-typical colliding-wind systems like WR 140 (Dougherty et al. DBC05 (2005)). This is the strongest direct evidence to date that the non-thermal radio emission in Cyg OB2 No. 9 arises due to a colliding-wind binary.
3.2 Spectral index
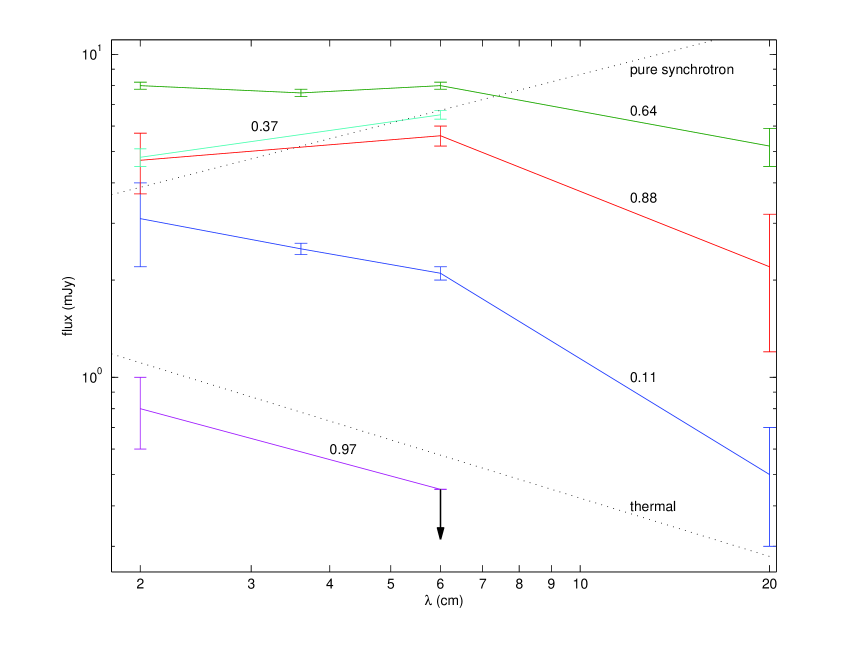
Fig. 5 shows the fluxes at chosen orbital phases, as a function of the available wavelengths. Globally, the radio spectrum becomes shallower as the orbit progresses from radio minimum (phase ) to radio maximum ()444Recall that a positive slope on the figure corresponds to a negative spectral index, and vice versa. Near radio minimum (, the spectral index between 2 and 6 cm is , suggesting an optically-thick spectrum with substantial attenuation, most likely due to free-free absorption. One may surmise that the minimum occurs near periastron, where the wind-collision region is buried in the stellar wind, though we readily admit this is not the only possible configuration for a minimum. The shape of the spectrum near radio minimum suggests thermal emission, but does not exclude a modest non-thermal contribution. Between phase 0.1 and 0.3 the spectral index switches from positive to negative. The spectral index between 6 and 20 cm is always negative. At radio maximum the spectrum has a turnover from negative to positive spectral index as one goes from short to long wavelengths. This is consistent with the attenuation expected from free-free absorption, which is greater at larger wavelengths. The spectral index at maximum is , which differs from the -0.5 index expected for synchrotron emission arising from strong-shock acceleration. This suggests that, even at radio maximum, the observed flux is a combination of optically thick and optically thin emission.
3.3 Mass-loss rate
We can derive an upper limit for the mass-loss rate from the radio minimum, where we can expect the contribution of non-thermal emission to be smallest. Adopting the stellar parameters given in Van Loo et al. (VanLoo+2004 (2004)) and taking the mJy upper limit at 6 cm (11 June 1990), we find . The 0.8 mJy detection at 2 cm gives . These values are upper limits, as the observed flux at radio minimum may still have a non-thermal contribution. They are lower than the (radio) = 1.9 given by Abbott et al. (ABC84 (1984)), partly because of the lower observed flux, and partly because of improved stellar and wind parameters.
The mass-loss rate originally derived from H is 1.77 (Leitherer L82 (1988)), which yields 1.47 with the parameters given in Van Loo et al. (VanLoo+2004 (2004)). A recent study by Puls et al. (P06 (2006)) shows that, for O star supergiants with H in emission, (radio) (H). This is believed to be caused by a radial decrease in the amount of clumping, as is also predicted theoretically (Runacres & Owocki RO05 (2005)). We find for Cyg OB2 No. 9 that (radio) (H), which is roughly consistent with the results of Puls et al. (P06 (2006)).
3.4 Energy budget of the non-thermal radio emission
The radio synchrotron emission is maintained by the kinetic power of the stellar winds, but only part of that is dissipated through the wind-collision shocks, and only a fraction of that power is dissipated in relativistic electrons. In addition, radio synchrotron emission accounts for a small fraction of the total non-thermal energy, with the bulk of that energy radiated at high energies.
There is considerable uncertainty how much of the wind-collision power is converted into radio synchrotron luminosity. Following Chen & White (CW94 (1994)) and Pittard & Dougherty (PD06 (2006)) we suggest the following order-of-magnitude estimate of
where is the power in non-thermal electrons and is the kinetic power of the winds that enter the wind-collision region.
The kinetic power depends strongly on the momentum ratio of the winds. For equal winds, the kinetic power in the wind-collision region is roughly half of the total kinetic power of the winds, whereas for a system with a much smaller momentum ratio e.g WR 140, the kinetic power in the winds is only 1% of the total wind power due to the small solid angle presented by the wind-collision region to the dominant wind (Pittard & Dougherty PD06 (2006)). For Cyg OB2 No. 9, using the stellar wind parameters, we estimate that erg s-1 if the wind momenta are assumed to be equal, and erg s-1 if the companion has a much weaker wind. The observed radio synchrotron luminosity erg s-1, which is likely a lower limit on the intrinsic synchrotron emission due to attenuation of emission by absorption and/or cooling. In support of these numbers, the model of Eichler & Usov (EU93 (1993)) gives a similar value. Given all the uncertainties in the above discussion, these numbers are all closely compatible, supporting a wind-collision origin for the non-thermal emission.
4 Conclusions
The most important result of this paper is that a period of 2.35 yr was found in the radio emission from Cyg OB2 No. 9. This is highly suggestive of a binary system in which the non-thermal emission, modulated by the orbit, arises in a wind-collision region. The binary status of Cyg OB2 No. 9 can currently not be confirmed by spectroscopic, optical or X-ray observations. However, some of the observations support the presence of a binary e.g. the high temperature derived from the X-ray spectrum and the marginally significant radial velocity variations. Additional observations are required to substantiate the claim of a binary using these techniques. However, there is already compelling evidence of a wind-collision region based on high-resolution radio observations (Dougherty et al., in prep).
From the radio minimum we derive an upper limit for the mass-loss rate of . This is substantially lower than previous estimates. As the radio formation region is likely to be less affected by clumping than the formation region of H, we suggest our upper limit is the most reliable estimate to date.
Acknowledgements.
We thank Daniel Kiminki, Michael De Becker and Yael Nazé for useful discussions and providing valuable radial velocity data. SVL gratefully acknowledges STFC for the financial support. We thank Joan Vandekerckhove for his help with the reduction of the VLA data. We are grateful to the original observers of the data we used from the VLA archive. This research has made use of the SIMBAD database, operated at CDS, Strasbourg, France, NASA’s Astrophysics Data System Abstract Service and data from the University of Michigan Radio Astronomy Observatory which is supported by funds from the University of Michigan. MCR thanks Tom Hartquist for his hospitality and kind support during a stay at the University of Leeds to prepare this paper.References
- (1) Abbott, D. C., Bieging, J. H., & Churchwell, E. B. 1984, ApJ, 280, 671
- (2) Bica, E., Bonatto, Ch., & Dutra, C. M. 2003, A&A, 405, 991
- (3) Bieging, J. H., Abbott, D. C., & Churchwell, E. B. 1989, ApJ, 340, 518
- (4) Bouret, J.-C., Lanz, T., Hillier, D. J. 2005, A&A, 438, 301
- (5) Bourguignon, S., Carfantan, H., & Böhm, T. 2007, A&A, 462, 379
- (6) Blomme, R., Van Loo, S., De Becker, M., et al. 2005, A&A, 436, 1033 (Paper I)
- (7) Blomme, R., De Becker, M., Runacres, M. C. et al. 2007, A&A, 464, 701 (Paper II)
- (8) Chen, W., & White, R. L. 1994, Ap&SS, 221, 259
- (9) Contreras, M.E., Rodriguez, L.F., Gomez, Y., & Velazquez, A. 1996, ApJ, 469, 329
- (10) De Becker, M. 2005, PhD Thesis, Université de Liége
- (11) Dougherty, S. M., & Williams, P. M. 2000, MNRAS, 319, 1005
- (12) Dougherty, S. M., Beasly, A. J., Claussen, M. J. et al. 2005, ApJ, 623, 447
- (13) Dworetsky, M. M. 1983, MNRAS, 203, 917
- (14) Eichler, D., Usov V. 1993, ApJ, 402, 271
- (15) Fernie, J. D. 1989, PASP, 101, 225
- (16) Fullerton, A. W., Massa, D. L., Prinja, R. K. 2006, ApJ, 637, 1025
- (17) Herrero, A., Corral, L. J., Villamariz, M. R., et al. 1999, A&A, 348, 542
- (18) Kiminki, D. C., Kobulnicky, H. A., Kinemuchi, K., et al. 2007, ApJ, 664, 1102
- (19) Knödlseder, J., 2000, A&A, 360, 945
- (20) Kudritzki, R.-P., & Puls, J. 2000, ARA&A, 38, 613
- (21) Leitherer, C. 1988, ApJ, 326, 356
- (22) Massey, P., & Thompson, A. B., 1991, AJ, 101, 1408
- (23) Moran, J. P., Davis, R. J., Bode, M. F. et al. 1989, Nature, 340, 449
- (24) Owocki, S. P., & Rybicki, G. B. 1984, ApJ, 284, 337
- (25) Phillips, R. B., & Titus, M. A. 1990, ApJ, 359, L15
- (26) Pittard, J., & Dougherty, S. M. 2006, MNRAS, 372, 801
- (27) Pittard, J. M., Dougherty, S. M., Coker, R. F., O’Connor, E., & Bolingbroke, N. J. 2006, A&A, 446, 1001
- (28) Pollock, A. M. T. 1987, ApJ, 320, 283
- (29) Puls, J., Markova, N., Scuderi, S., et al. 2006, A&A, 454, 625
- (30) Rauw, G., Vreux, J.-M., Bohannan, B. 1999, ApJ, 517, 416
- (31) Rauw, G., De Becker, M., Nazé, Y., et al. 2004, A&A, 420, 9
- (32) Rauw, G., De Becker, M., & Linder, N. 2005, in Massive Stars and High-Energy Emission in OB Associations, Eds G. Rauw, Y. Nazé, E. Gosset, & R. Blomme, 103
- (33) Runacres, M. C., & Owocki, S. P. 2005, A&A, 429, 323
- (34) Scargle, J. D. 1982, ApJ, 263, 835
- (35) Schulte, D. H. 1956, ApJ, 123, 250
- (36) Stevens, I. R., Blondin, J. M., & Pollock, A. M. T. 1992, ApJ, 386, 265
- (37) Van Loo, S., Runacres, M. C., & Blomme, R. 2004, A&A, 418, 717
- (38) Van Loo, S., Runacres, M. C., & Blomme, R. 2006, A&A, 452, 1011
- (39) Waldron, W. L., Corcoran, M. F., Drake, S. A., et al. 1998, ApJS, 118, 217
- (40) White, R.L., & Becker, R.H. 1983, ApJ, 272, L19
- (41) White, R.L., & Chen, W. 1994, Ap&SS, 221, 295
- (42) White, R. L., & Becker, R. H. 1995, ApJ, 451, 352 Leuven
- (43) Williams, P. M., Van der Hucht, K. A., Pollock, A. et al. 1990, MNRAS, 243, 662
- (44) Williams, P. M., Dougherty, S. M., Davis, R. J., van der Hucht, K. A., Bode, M. F., & Setia Gunawan, D. Y. A. 1997, MNRAS, 289, 10
Appendix A Data reduction
The data reduction was accomplished using the Astronomical Image Processing System (AIPS), developed by the NRAO, following the standard procedure of antenna gain calibration, absolute flux calibration, imaging, and deconvolution. These have been described in detail in Paper I.
For some of the observing programmes that we examined, no flux calibrator was observed and we used calibration observations from observing programmes at closely the same time. For programmes VP51 and AL372 at 20cm no such observations were available and we resorted to the value listed in the VLA calibrator manual555URL: http://www.vla.nrao.edu/astro/calib/manual making the fluxes from these observations less reliable. As a consistency check on the derived flux scale, we compared fluxes for the most commonly used phase-reference source, J2007+404, with those obtained at 2, 3.6, and 6 cm at the University of Michigan Radio Astronomy Observatory (UMRAO). Excellent agreement was found for all observations except AC116 (1985-01-13) at 2cm. For this specific case, the flux scale used was derived from interpolation of the MRAO data.
Antenna gain calibration was established in the standard manner of self-calibration of the phase-reference source and transferring these solutions to the target field-of-view. These solutions were then improved further by one round of phase-only calibration of the target field-of-view. In some cases, smoothly varying phase solutions were not found using the additional target self-calibration, and so we adopted the phase-referenced solutions. These cases where target self-calibration was applied are noted in Table A.
Images of the field-of-view were derived by filtering out the lowest spatial frequency data. This eliminates large scale ”background” emission that is particularly prevalent at 20cm in the more compact ’C’ and ’D’ configuration observations. This should have no effect on the flux estimates of Cyg OB2 No. 9 since this source is unresolved by the VLA in the highest resolution ’A’ configuration at all wavelengths examined.
After image deconvolution using AIPS task CLEAN, the flux of Cyg OB2 No. 9 was established by fitting elliptical Gaussians to the source image. The resulting fluxes are listed in Table A. Correction for primary beam attenuation has been made for observations where Cyg OB2 No. 9 is not at the field centre. Some care has been taken to assess the uncertainty in the derived fluxes. The uncertainties given in TableA include not only the root-mean-square (RMS) noise in the map, but also an estimate of the uncertainty in the absolute flux calibration process (5% at 0.7 and 2cm, and 2% at 3.6, 6, 20 and 90 cm) and an estimate of systematic errors. The systematic errors were evaluated using a jackknife technique, described in Paper I. In those observations where Cyg OB2 No. 9 was not detected, an upper limit is quoted that is 3 times the uncertainty as derived above.
A comparison between the fluxes derived here and those in the literature show good agreement overall, with sometimes slightly higher values reported here, perhaps due to the use of phase self-calibration on the target field. There are a few notable exceptions to this agreement. In the AC42 data at 2 and 6cm, there is weak () source at the location of Cyg OB2 No. 9, but other stronger ”sources” nearby do not repeat in other 2 and 6cm observations. Hence we assign a upper limit (contrary to Bieging et al. BAC89 (1989)).In the BIGN data, we find a detection, where Bieging et al. provide a upper limit. We do not detect Cyg OB2 No. 9 in VP91 at 20cm as reported by Phillips & Titus (PT90 (1990)). This is a D-configuration observation with considerable large scale emission around the position of Cyg OB2 No. 9. It is not possible to totally eliminate this emission by removing the low spatial frequency data since it leaves insufficient data for successful imaging, but examination of 20cm data from higher-resolution configurations shows that this is background emission unrelated to Cyg OB2 No. 9. We speculate that Phillips & Titus may have mis-identified some of this emission as Cyg OB2 No. 9. In the AR328 0.7cm data, we find a weak ”source” at the position of No. 9, but again there are brighter nearby sources that do not appear at other frequencies. Hence we have adopted an upper limit contrary the detection reported by Contreras et al. (Contreras+al96 (1996)). On the other hand, we do detect No. 9 at both 3.6 and 6cm from AR328.
Lastly, we note a number of reporting errors. Bieging et al. (BAC89 (1989)) list incorrectly some observations dated 1982 Feb 9. Also, Waldron et al (W98 (1998)) give their 1991 observation as being at 6cm, rather than 3.6cm, and their 1992 data as taken on Jun 24, rather than Jan 24.
[x]lllrrcrrrlcl
Reduction of the VLA data.
Column (1) gives the programme name, (2) the date of the observation,
(3) the source on which the observation was centred,
(4) the phase calibrator name (J2000 coordinates),
(5) the phase calibrator flux (Jy) and
(6) distance to the observation centre (degrees),
(7) the integration time (in minutes) on the source,
(8) the number of antennas that gave a usable signal,
(9) the configuration the VLA was in at the time of the observation,
(10) the measured flux (in mJy) and
(11) refers to the notes.
Many of the VLA observations were made in two sidebands, each of which has a
bandwidth of 50 MHz; the exceptions are noted in column (11).
Upper limits are 3 the RMS.
Numbers between brackets in the notes column give references for those
observations that have already been published in the literature.
(1) (2) (3)
(4) (5) (6)
(7) (8) (9)
(10) (11)
progr. date
ctr.
phase calibrator
int.
no.
config.
flux
notes
name
flux
dist.
time
ants.
(mJy)
\endfirstheadcontinued.
(1) (2) (3)
(4) (5) (6)
(7) (8) (9)
(10) (11)
progr. date
ctr.
phase calibrator
int.
no.
config.
flux
notes
name
flux
dist.
time
ants.
(mJy)
\endhead\endfoot
Notes:
Column (3): source on which the observation was centred
is mostly indicated by Schulte (Schulte56 (1956)) Cyg OB 2 numbers.
Others indicators are:
‘98’ is in between No. 8A and No. 9; ‘+’ is listed in the observing log as
2031+411, ‘X3’ as Cyg X-3, ‘XA’ as Cyg X-3A, ‘23’ as C23,
‘80’ as F80XF, ‘21’ as 2032+41, ‘91’ as 20315+41291, ‘32’
as 20330+41132, ‘20’ as 2033+40, ‘J2’ as 2033+4118_2 and ‘SE’ as TEVSE.
1x50
(or a similar code): bandwidth different from standard 2x50 MHz
C
flux calibration based on MRAO data (see text)
I
stripes are visible on this image, complicating the flux measurement
PH
flux calibration on phase calibrator
S
selfcalibration applied
X
flux calibration is very uncertain; check on flux of phase calibrator suggests factor of 2
(1)
White & Becker (White+Becker83 (1983))
(2)
Bieging et al. (BAC89 (1989))
(3)
Phillips & Titus (PT90 (1990))
(4)
Contreras et al. (Contreras+al96 (1996))
(5)
Waldron et al. (W98 (1998))
\endlastfoot0.7 cm
AR277 1994-04-17 9 2007+404 1.18 0.03 4.9 32 9 A 6. (4)
AR328 1995-04-27 9 2007+404 1.27 0.01 4.9 23 10 D 4. (4)
1.3 cm
AW515 1999-06-08 9 2007+404 1.46 0.02 4.9 40 19 AD 3.5 0.6
2 cm
BIGN 1981-10-16 9 2007+404 4.8 0.6 4.9 29 27 C 4.1 1.2 1x50,(2)
BECK 1982-05-22 9 2007+404 6.1 1.3 4.9 13 27 A 12. 1x50
BECK 1982-07-03 9 2007+404 4.50 0.08 4.9 9
25 A 5.5 0.9 1x50,(1)
BECK 1982-12-21 9 2023+318 3.18 0.04 9.6 14 26 D 6.2 0.8 1x50
AC42 1983-05-09 9 2007+404 3.76 0.06 4.9 21 27 C 1.3 1x50,(2)
AB228 1983-08-25 9 2007+404 6.9 0.7 4.9 19 26 A 3.1 0.9
AA29 1984-04-04 9 2007+404 3.53 0.08 4.9 22 27 C 4.8 0.3 S,(2)
AC116 1984-11-27 9 2007+404 3.75 0.06 4.9 38 25 A 6.5 0.4 (2)
AC116 1984-12-21 9 2007+404 3.96 0.07 4.9 10 27 A 6.5 0.5 S,(2)
AC116 1985-01-13 9 2007+404 3.3 0.2 4.9 28 25 A 6.1 0.9 C,(2)
AC116 1985-02-16 9 2007+404 3.45 0.02 4.9 19 25 A 5.6 0.4 (2)
AA47 1985-06-12 9 2007+404 3.2 0.1 4.9 15 25 B 4.7 1.0 S,(2)
AA47 1985-09-01 9 2007+404 3.02 0.05 4.9 15 27 C 0.8 0.2
AB671 1993-02-14 9 2007+404 5.8 0.2 4.9 6 27 BnA 5.8 1.4
AR328 1995-04-27 9 2007+404 2.40 0.02 4.9 34 15 D 1.9 0.4 (4)
AW515 1999-06-08 9 2007+404 1.71 0.01 4.9 30 20 AD 4.7 0.4 I
3.6 cm
AS397 1990-02-16 22 2007+404 3.10 0.04 4.9 14 22 A 4.3 0.4
AH395 1990-02-17 22 2007+404 3.05 0.01 4.9 29 22 A 5.2 0.4
AW288 1991-07-04 9 2025+337 2.08 0.06 7.7 5 26 A 7.2 0.2 S,(5)
AW304 1992-01-24 9 2007+404 2.87 0.03 4.9 12 24 CnB 7.2 0.2 S,(5)
BP1 1992-05-30 9 2052+365 1.87 0.01 6.0 99 23 DnC 5.0 0.2
AB671 1993-01-21 9 2007+404 3.20 0.06 4.9 19 24 A 2.6 0.1 S
AB671 1993-01-24 9 2007+404 3.33 0.07 4.9 23 27 A 2.5 0.1 S
AB671 1993-01-29 9 2007+404 3.33 0.02 4.9 24 27 BnA 2.8 0.1 S
AB671 1993-02-01 9 2007+404 3.29 0.03 4.9 6 27 BnA 2.2 0.2
AB671 1993-02-14 9 2007+404 3.41 0.03 4.9 7 27 BnA 3.3 0.1 S
AB671 1993-02-20 9 2007+404 3.8 0.1 4.9 14 24 B 1.9 0.4
AS483 1993-05-01 98 2007+404 3.28 0.01 4.9 25 27 B 4.5 0.1 S,(5)
AR277 1994-04-17 9 2007+404 2.97 0.01 4.9 23 14 A 7.6 0.2 S,(4)
AR328 1995-04-27 9 2007+404 2.77 0.01 4.9 11 16 D 1.7 0.2 (4)
AS644 1999-04-18 9 2015+371 2.17 0.01 4.9 5 27 D 6.7 0.3 S
AW515 1999-06-08 9 2007+404 2.02 0.01 4.9 10 19 AD 5.2 0.4 S,I
BB116 1999-12-04 9 2007+404 2.20 0.01 4.9 101 27 B 1.32 0.05
BB116 2000-06-26 9 2007+404 2.40 0.01 4.9 20 26 DnC 3.2 0.2
BD110 2005-11-15 9 2007+404 2.29 0.02 4.9 21 22 D 6.3 0.2 S
AB1195 2006-01-26 8 2007+404 2.37 0.05 4.9 31 16 AD 8.
AB1210 2006-05-24 8 2007+404 2.21 0.02 4.9 27 21 BnA 7.1 0.8
6 cm
CHUR 1980-05-23 9 2007+404 4.73 0.03 4.9 49 22 AD 7.6 0.2 1x50,(2)
CHUR 1980-05-24 9 2007+404 4.58 0.03 4.9 50 23 AD 8.0 0.7 1x50,(2)
BIGN 1981-10-16 9 2007+404 4.16 0.04 4.9 17 27 C 6.2 0.4 1x50,S,(2)
BECK 1982-03-27 9 2007+404 4.74 0.01 4.9 211 27 A 7.8 0.2 1x50,(1)
BECK 1982-05-22 9 2007+404 4.59 0.03 4.9 5 24 A 7.9 0.4 1x50,S
BECK 1982-07-03 9 2007+404 4.95 0.02 4.9 5 26 A 8.1 0.4 1x50,S,(1)
BIEG 1982-08-26 9 2007+404 4.4 0.1 4.9 9 24 B 6.5 0.4 1x50,(2)
BECK 1982-12-21 9 2023+318 2.86 0.01 9.6 9 24 D 5.1 0.9 1x50,S
AC42 1983-05-09 9 2007+404 4.46 0.02 4.9 10 26 C 1.2 1x50,(2)
AC42 1983-08-22 9 2007+404 4.85 0.01 4.9 14 25 A 1.7 0.1 (2)
AB228 1983-08-28 9 2007+404 4.90 0.03 4.9 18 27 A 1.8 0.1
AB252 1983-10-30 9 2007+404 4.84 0.02 4.9 9 26 A 2.8 0.2 S
AA28 1984-03-04 9 2007+404 4.27 0.01 4.9 13 27 CnB 5.7 0.3 S,(2)
AA28 1984-03-09 8 2007+404 4.33 0.01 4.9 23 26 CnB 5.9 0.4
AA29 1984-04-04 9 2007+404 4.21 0.02 4.9 11 27 C 6.5 0.2 S,(2)
VM59 1984-10-17 9 2202+422 2.72 0.01 16.7 13 26 D 7.8 0.8 S
AC116 1984-11-27 9 2007+404 4.50 0.01 4.9 19 25 A 8.5 0.2 S,(2)
AC116 1984-12-21 9 2007+404 4.63 0.01 4.9 9 27 A 7.7 0.2 S,(2)
AF102 1985-05-09 + 2022+616 2.43 0.01 20.4 9 26 B 5.9 0.2 S
AA47 1985-06-12 9 2007+404 3.87 0.01 4.9 9 22 B 5.6 0.4 S,(2)
AA47 1985-09-01 9 2007+404 3.53 0.01 4.9 7 27 C 0.9 (2)
AA47 1985-09-19 9 2007+404 3.56 0.01 4.9 11 25 C 0.6 (2)
VM115 1990-06-11 9 2202+422 3.24 0.01 16.7 19 22 A 0.3
AG320 1991-03-06 9 2007+404 2.73 0.01 5.2 7 25 D 4.8 0.5
AB671 1993-01-21 9 2007+404 3.09 0.01 4.9 19 24 A 2.3 0.1 S
AB671 1993-01-24 9 2007+404 3.08 0.03 4.9 18 27 A 2.1 0.1 S
AB671 1993-01-29 9 2007+404 3.12 0.01 4.9 19 27 BnA 2.3 0.1 S
AB671 1993-02-01 9 2007+404 3.11 0.01 4.9 7 27 BnA 2.2 0.2 S
AB671 1993-02-14 9 2007+404 3.12 0.02 4.9 8 27 BnA 2.7 0.2 S
AS483 1993-05-01 98 2007+404 3.04 0.01 4.9 21 25 B 4.5 0.4 (5)
TST6CM 1993-06-04 9 2052+365 5.2 0.2 6.0 29 26 CnB 6.7 0.4 X
AR277 1994-04-17 9 2007+404 3.04 0.01 4.9 23 15 A 8.0 0.2 S,(4)
AS544 1994-09-13 12 2007+404 3.16 0.01 4.8 5 25 B 10. S
AS544 1994-10-12 12 2007+404 3.22 0.01 4.8 5 25 CnB 3.9 0.9 S
AR328 1995-04-27 9 2007+404 2.982 0.003 4.9 11 16 D 1.5 0.4 (4)
AS644 1999-02-05 7 2007+404 2.6 0.1 4.9 20 23 DnC 5.3 1.4
AS644 1999-04-18 9 2015+371 1.728 0.003 5.3 5 27 D 7.1 0.5 S
AW515 1999-06-08 9 2007+404 2.40 0.03 4.9 10 21 AD 5.3 0.6 I,S
AC530 1999-09-03 12 2007+404 2.53 0.05 4.8 49 9 A 11. S
AU082 2000-06-30 12 2015+371 1.92 0.02 5.2 88 7 DnC 6. 4.
AS786 2004-02-15 7 2015+371 2.78 0.003 5.4 61 26 CnB 7. 2.
AB1156 2005-02-04 8 2007+404 2.47 0.01 4.9 31 25 BnA 4.7 0.3
AB1156 2005-02-06 8 2007+404 2.50 0.02 4.9 31 25 BnA 4.4 0.6
AB1156 2005-02-08 8 2007+404 2.52 0.01 4.9 31 25 BnA 4.1 1.1
AB1156 2005-02-11 8 2007+404 2.52 0.01 4.9 31 25 BnA 5.0 0.9
AB1156 2005-02-13 8 2007+404 2.49 0.02 4.9 31 24 BnA 4.3 0.3
AB1156 2005-02-18 8 2007+404 2.44 0.01 4.9 51 24 B 4.1 0.2
AB1156 2005-02-25 8 2007+404 2.49 0.01 4.9 30 24 B 5.5 0.3
AB1156 2005-02-27 8 2007+404 2.49 0.01 4.9 51 25 B 4.6 0.2
AB1156 2005-02-28 8 2007+404 2.47 0.01 4.9 30 25 B 4.5 0.2
AB1156 2005-03-01 8 2007+404 2.410 0.004 4.9 31 24 B 4.4 0.3
AB1156 2005-03-02 8 2007+404 2.44 0.01 4.9 29 25 B 4.4 0.2
AB1156 2005-03-08 8 2007+404 2.44 0.01 4.9 26 25 B 4.7 0.2
AB1156 2005-03-12 8 2007+404 2.43 0.01 4.9 30 25 B 5.1 0.5
BD110 2005-11-15 9 2007+404 2.51 0.01 4.9 18 21 D 6.8 0.4 S
20 cm
VAND 1981-06-22 A 2022+616 2.18 0.01 20.2 6 26 B 9. 1x3.125,S
BECK 1982-07-03 9 2007+404 3.99 0.02 4.9 4 27 A 5.2 0.7 1x50,(1)
BIEG 1982-08-26 9 2007+404 4.00 0.04 4.9 34 24 B 4.4 0.3 1x50,(2)
BECK 1982-12-21 9 2023+318 2.18 0.02 9.6 15 26 D 24. 1x50,S
AC42 1983-05-09 12 2007+404 4.33 0.03 4.8 1 27 C 6. 1x50,(2)
AB228 1983-08-25 9 2007+404 4.19 0.02 4.9 28 24 A 0.5 0.2
AB228 1983-08-27 9 2007+404 4.31 0.02 4.9 28 26 A 0.5 0.2
AR96O 1984-01-06 5 2007+404 3.39 0.04 4.7 27 15 B 7.
AA28 1984-03-09 8 2007+404 4.15 0.02 4.9 26 26 CnB 5. 3.
AM119 1984-06-11 X3 2007+404 4.2 0.1 4.7 20 27 C 5.8 1.0 2x25,S
AM119 1984-06-12 X3 2007+404 4.40 0.03 4.7 21 27 C 3.9 0.5 2x25,S
AR110 1984-09-06 5 2007+404 3.99 0.03 4.7 13 25 D 10. S
AR110 1984-09-15 5 2007+404 3.86 0.08 4.7 34 26 D 11. S
AR110 1984-09-20 5 2007+404 4.2 0.1 4.7 16 27 D 20. S
AR110 1984-09-22 5 2007+404 4.00 0.06 4.7 17 26 D 13. S
AR110 1984-09-24 5 2007+404 4.06 0.04 4.7 45 26 D 12. S
AR110 1984-09-28 5 2007+404 4.04 0.03 4.7 41 26 D 10. S
AC116 1984-11-27 9 2007+404 4.06 0.02 4.9 33 25 A 6.2 0.2 (2)
AC116 1984-12-21 9 2007+404 3.98 0.03 4.9 13 27 A 4.9 0.2 (2)
AT61 1985-04-04 9 2052+365 5.43 0.01 6.0 14 25 BnA 4.3 0.2
AA47 1985-09-19 9 2007+404 3.92 0.04 4.9 13 26 C 4.5 S,(2)
AR170 1987-10-16 5 2052+365 5.20 0.02 6.2 26 23 BnA 2.2 1.0
AR170 1987-11-09 5 2052+365 5.07 0.05 6.2 9 21 BnA 6. 4.
AR170 1988-02-05 5 2052+365 4.38 0.07 6.2 16 16 B 9.
ADHOC 1988-05-03 23 2007+404 3.37 0.01 4.7 3 27 C 16. 2x25,S
VP51 1989-06-19 9 2052+365 5.71 6.0 26 26 C 5.3 0.7 PH,S
VP91 1989-11-10 9 2007+404 3.3 0.1 4.9 30 27 D 18. S,(3)
AM305 1990-07-05 80 2007+404 2.84 0.02 4.9 5 26 BnA 3.4 2x25
AT107 1990-08-09 21 2052+365 5.15 0.01 6.0 4 27 B 30.
AK279 1991-03-29 21 2052+365 7.8 0.3 6.0 31 26 D 30. S
AK279 1991-03-31 21 2052+365 6.5 0.2 6.0 21 26 D 37. S
AFTST 1991-08-11 21 2052+365 5.15 0.01 6.0 38 19 A 9.
AW311 1992-03-15 21 2022+542 1.036 0.002 13.2 29 27 C 3.7 1.4 S
BP1 1992-05-30 9 2052+365 5.1 0.3 6.0 129 25 DnC 11.
AS483 1993-04-29 X3 2007+404 2.52 0.02 4.7 14 25 B 16. S
TST6CM 1993-06-04 9 2052+365 6.4 0.3 6.0 13 27 CnB 5. S
AL372 1996-03-28 5 2038+513 5.80 10.1 10 25 C 1.9 1.0 2x3.125,PH,S
AC308 1996-09-15 91 2202+422 6.15 0.03 16.9 1 27 D 150.
AC308 1996-09-20 32 1924+334 3.793 0.003 15.6 1 27 D 19.
AC496 1997-09-27 20 1924+334 3.753 0.004 15.6 3 26 DnC 16.
AA237 1999-02-01 J2 2052+365 5.31 0.03 6.1 11 27 C 9. 2.
AR458 2001-02-06 X3 2015+371 1.56 0.01 6.0 32 26 BnA 10. S
AB1075 2003-04-29 SE 2052+365 4.98 0.01 6.1 30 27 D 16. S
BD110 2005-11-15 9 2007+404 2.6 0.1 4.9 20 22 D 24. S
90 cm
SYSTE 1986-05-20 X3 2052+365 2.18 0.02 5.9 158 12 A 8. 2x3.125