Electron density diagnostic for hot plasmas in coronal regime by using B-like ions
Abstract
Line ratio of transition lines in boron-like spectra of Si X, S XII, Ar XIV and Fe XXII has been investigated. Collisional-radiative model calculations reveal that the line ratio is sensitive to the electron density in ranges of cm-3, cm-3, cm-3 and cm-3, respectively. This complements the K-shell diagnostics of helium-like ions. By comparison between the prediction and the measured values, effective electron densities in the electron beam ion trap (EBIT) plasmas performed by Lepson and collaborators at Lawrence Livermore EBIT, are estimated to be cm-3 and cm-3 for sulphur and argon plasmas. In case of argon, a good agreement is shown with the actual electron density derived from N VI K-shell spectrum. We further explore the transition lines of Si X and S XII in the stellar coronal spectra measured with the Low Energy Transmission Grating Spectrometer combined with High Resolution Camera on board the Chandra X-ray Observatory. The constrained electron densities show a good agreement with the those determined from C V and O VII K-shell spectra.
1 Introduction
Electron density () plays an important role in fields of stellar corona, galaxy, interstellar medium of galaxies, clusters of galaxies, as well as the ground tokamak, laser-produced, electron beam ion trap hot plasmas. K-shell spectra (generally refers to the helium-like) shows a powerful diagnostic potential for the electron density. Since the work of Gabriel & Jordan (1969), which defines a ratio between the forbidden line (–) and the intercombination lines line (–), many literatures reported the ratio by consideration of effects of radiation field (Ness et al., 2001), dielectronic and radiative recombinations (Porquet et al., 2001). Porquet et al. (2005) re-investigated the ratio by using updated atomic data of dielectronic and radiative recombinations.
Since the spectra with high-resolution being available, especially the launch of Chandra and XMM-Newton missions, the ratio of helium-like spectra has been extensively adopted to derived the electron density and further estimations of the stellar structure and the heating mechanism in X-ray emitting regions (Audard et al., 2001; Ness et al., 2002a, b, 2004; Schmitt et al., 2005). Moreover, spatial information of coronae could be assessed indirectly using correlation (, refers to an emission measure) between the electron density and the emission measure.
Besides the K-shell emission lines, many L-shell emission lines from highly charged oxygen, neon, silicon, sulphur, calcium, iron and nickel ions have been detected in stellar coronal spectra. For inactive stars, M-shell transition lines were also identified (Raassen et al., 2002). The diagnostic potential of the L-shell emission lines has been investigated by many authors, such as the ratio (50.524)/(50.691) of Si X, (52.306)/(43.743), (52.306)/(46.391) of Si XI addressed in our previous works (Liang & Zhao, 2006a; Liang et al., 2006b). Similar characteristics were explored for Si VIII, S X, Ar XIV and Ca XVI etc. (Keenan et al., 1993, 2000, 2001, 2003; Liang et al., 2006c).
For boron-like extreme ultraviolet (EUV) spectra from transitions of –2, Keenan et al. (2000, 2003) studied density-sensitive line ratios of Si X and Ar XIV by using accurate excitation data from matrix method. For transition lines spanned in the soft X-ray region, line intensity ratios of highly charged silicon ions were investigated in our previous work (Liang et al., 2006b), which shows a -sensitivity in the range of cm-3. By laboratory measurements in the electron beam ion trap (EBIT), Chen et al. (2004) test the density-sensitive line ratios of Ar XIV and Fe XXII in ranges of cm-3 and low-density limit around 1.0 cm-3, respectively. In that work, the actual electron density was constrained from K-shell N VI spectrum. However, the diagnostic application of emission lines of S XII have not been investigated to our best knowledge, though its two lines at 36.398 and 36.564 Å have been identified for inactive star—Procyon.
In this work, we make a systematically analyses for the density-sensitive transition lines of boron-like spectra including Si X, S XII, Ar XIV and Fe XXII based on the collisional-radiative model as given in Sec. 2. In Sec. 3, we explore the transition lines of S XII at 36.398 and 36.564 Å in the stellar coronal spectra observed by the low energy transmission grating (LETG) spectrometer on board the Chandra X-ray observatory. Furthermore, the electron densities of stellar corona and laboratory plasmas produced in the EBIT are estimated as illustrated in Sec. 4, followed by conclusions outlined in Sec. 5.
2 Theory
2.1 – transition lines
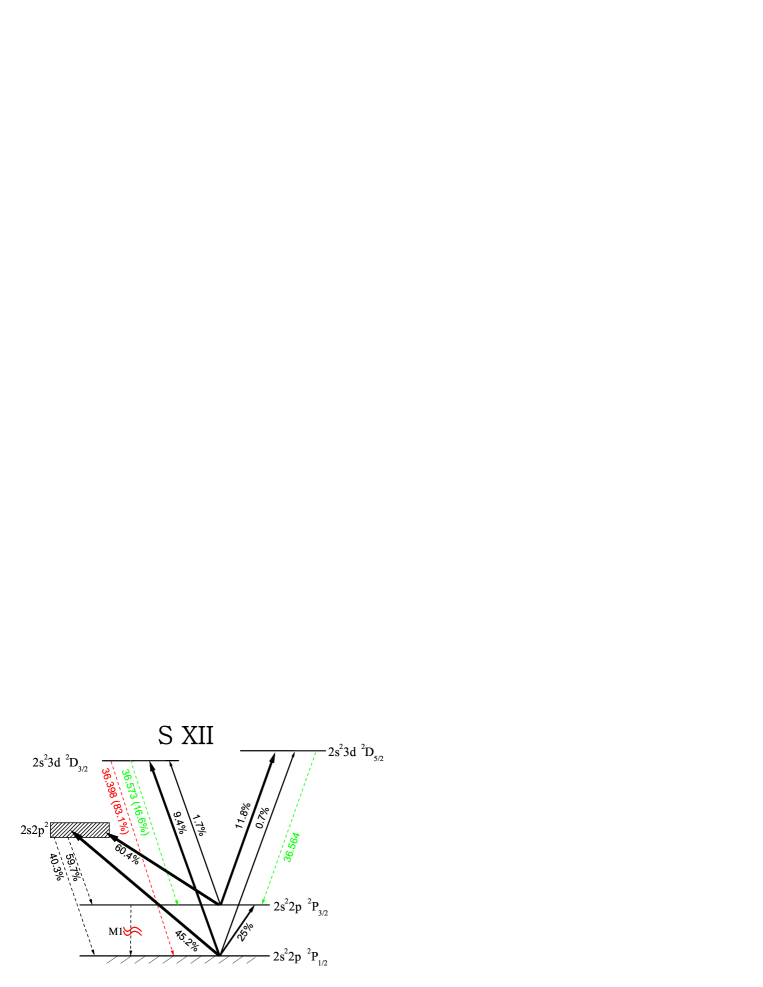
The line intensity ratio between the – transition and the – transition lines are known to be sensitive to the electron density but on the other hand rather insensitive to the electron temperature. This feature follows from the fact that the upper level is populated mainly by collisional excitation from the density-sensitive lower metastable level. In the following paragraph, we take S XII to explain this property.
As shown in Fig. 1, the levels of the configuration have the largest excitation rate from the levels of the ground configuration, whereas the decaying lines span in the EUV wavelength region. Here we pay special attention on the X-ray emission lines. The level has a high excitation rate from and decay rate to the metastable level, which is forbidden to decay to the ground state. By increasing the electron density, a significant fraction of the population can be re-excited to the state, from where it relaxes to the state and, therefore, the line intensity at 36.564 Å increases. On the other hand, by the depopulation of the ground state due to the shelving of electrons in the metastable level, the excitation of the resonance line (–) at 36.398 Å of S XII decreases at high densities.
It is clear that the level can also decay to the metastable level with a low branching ratio. However, as this tranistion line (at 36.573 Å for S XII) can not be resolved from the 36.564 Å line due to the limited spectral resolution in the present space missions, we have to take into account this blend effect. Since the is directly populated from the ground state, the intensity of 36.573 Å has a similar dependence on as the 36.398 Å resonance line and it relative contribution to the blended 36.564 Å line becomes dominant at low electron density.
2.2 Calculation of the line ratio
Adopting a collisional-radiative model, we calculated the line ratio [I()+I()]/I() of Si X, S XII, Ar XIV and Fe XXII, as a function of the electron density for a Maxwellian electron distribution at temperatures of peak fraction of these ions in the work of Bryans et al. (2006). The transition wavelengths are listed in Table 1. For Si X and Ar XIV, the atomic data including energy levels, radiative decay rates and impact excitation rates are from our detailed calculation. Some excitation data within transitions are replaced by more accurate calculation with matrix method as explained in previous literatures (Liang et al., 2006b, c). For S XII and Fe XXII, we adopt the CHIANTI package of the new version 5.2. In this code, the atomic data is updated recently as depicted by Landi et al. (2006). For S XII, the electron impact excitation data of Zhang et al. (1994) has been adopted, in which small errors found by later have been corrected by authors in the present version of the CHIANTI. Resonance effects for excitations among the lowest 15 fine-structure levels have been included by the R-matrix method. For Fe XXII, the electron excitation data between the lowest 204 levels are from the work of Badnell et al. (2001) who adopted close-coupling R-matrix method and in conjunction with intermediate-coupling frame transformation method. The electron excitation data between higher 205-513 levels adopts the calculation of Landi & Gu (2006), in which the resonance effects were considered by an isolated-resonance approximation. Above the ionization energy, the calculation of Bautista et al. (2004) with the Breit-Pauli R-matrix method was used. Additionally, proton excitations between the fine-structure states of the ground configuration and term were also included (Foster et al., 1997) in the CHIANTI. In this work, close-coupled impact-parameter method was used.
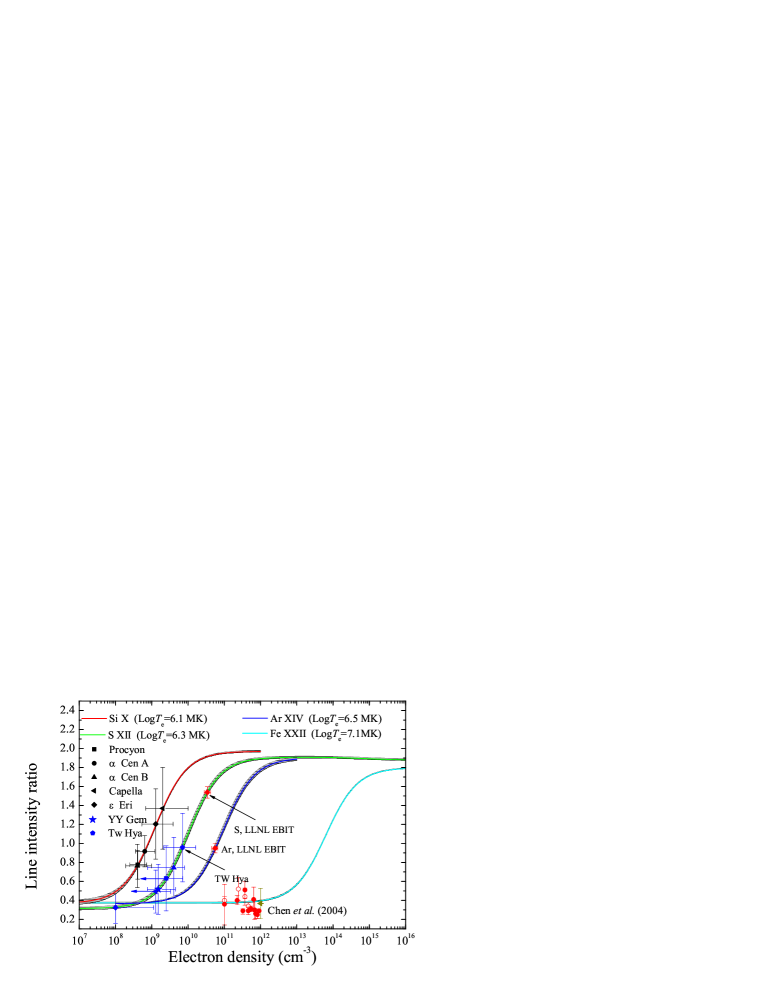
Figure 2 shows the prediction of the line ratio at temperatures of log=6.1 K for Si X, 6.3 K for S XII, 6.5 K for Ar XIV and 7.1 K for Fe XXII. This demonstrates that the ratio is sensitive to the electron density in ranges cm-3, cm-3, cm-3 and cm-3 for Si X, S XII, Ar XIV and Fe XXII, respectively. We further calculate the ratio in the temperature ranges log=6.0–6.2 K for Si X, 6.1–6.4 K for S XII, 6.4–6.6 K for Ar XIV and 7.0–7.2 K for Fe XXII, as illustrated by hatched regions in Fig. 2, which reveals that the ratio is insensitive to the electron temperature. This indicates that the ratio [I()+I()]/I() is a good -diagnostic method for hot plasmas, and compensates the K-shell spectra.
3 Observations
The wavelength range spanned by the transition lines of the present interested boron-like ions, is covered by the High and Medium Energy Grating (HEG and MEG) spectrometers, the Low Energy Transmission Grating (LETG) spectrometer on board Chandra, as well as the Reflection Grating Spectrometer (RGS) on board XMM-Newton with high-resolution. One specific advantage of LETG observations results from its large wavelength coverage in one spectrum, that is the lines (see Table 1) of the interested ions can be detected at the same time.
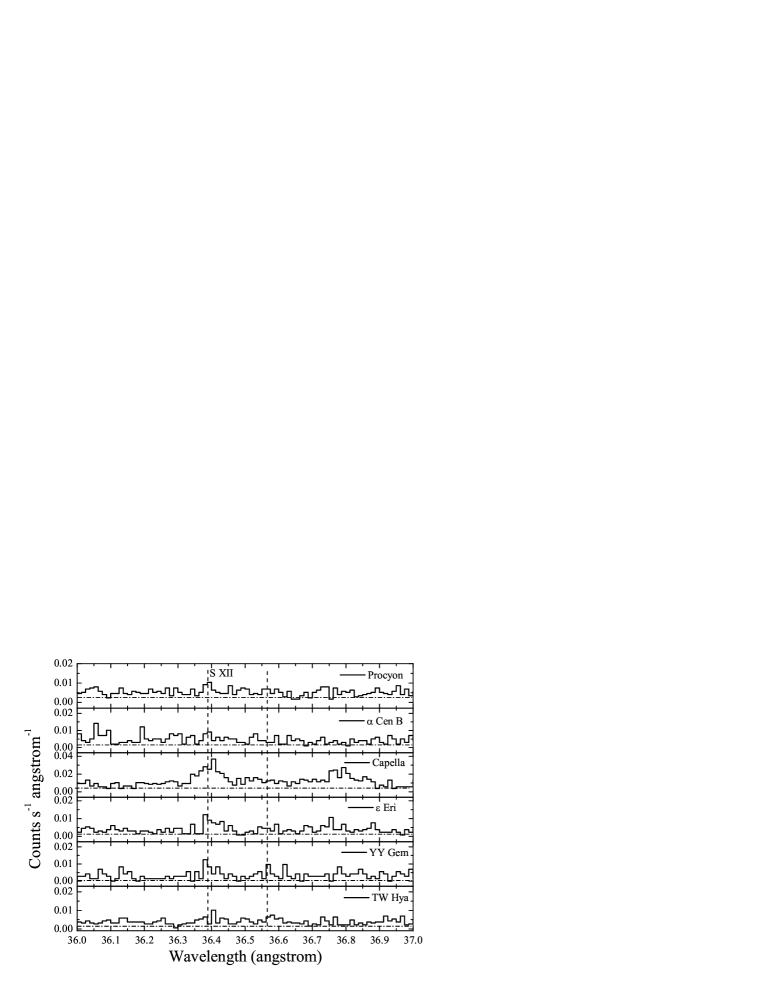
Our sample consists of 6 stars including two normal dwarf stars, i.e., Procyon and Cen B, an active late-type dwarf star, Eri, two active binary systems, Capella and YY Gem, and an pre-main sequence late-type star–TW Hya. The properties of our sample, along with ObsID and exposure time are summarized in Table 2. All observations adopt grating of LETG combined with High Resolution Camera (HRC) instrument on board Chandra Observatory. In case of Capella, an additional observation (with ObsID=55) with Advanced CCD Imaging Spectrometer (ACIS)-S instrument is used. Because ACIS-S instrument has significant energy resolution to separate overlapping spectral orders, LETG+ACIS-S observations are better choice for determination of the electron density. However only one observation is available from Chandra Data Archival Center for our sample. Another goal of analysis for the ACIS-S spectrum of Capella is to validate whether there is significant contamination from high-order (refer to ) spectra around the selected lines (36.398 and 36.564 Å ). If line fluxes derived from the two different observations are comparable, no contamination from high-order spectra can be concluded. Reduction of the LETG datasets uses CIAO3.3 software with the science threads for LETGS/HRC-S observations. Figure 3 shows the spectra for Procyon, Cen B, Capella, Eri, YY Gem and TW Hya in the wavelength range of 36.0–37.0 Å .
The transition lines of Si X have been identified and explained in detail by Liang & Zhao (2006a). Argon is an underabundant element in stellar corona, and no emission lines of Ar XIV have been identified so far. Iron is an abundant elements in astrophysical environment. However, the resonance line at 11.769 Å is contaminated by the Fe XXIII line at 11.738 Å for Capella (Behar et al., 2001). Here, we pay a special attention on the identification of lines of S XII at 36.398 Å and 36.564 Å as shown in Fig. 3.
4 Results and Discussions
4.1 line fluxes of transitions of S XII
Line fluxes are determined by modelling the spectra locally with narrow Gaussian profiles and constant value representing background and (pseudo-)continuum emissions determined in line-free region. The observed line width is about 0.06 Å over the interested region, which is comparable with the broadening of instrument for point-like source. The fluxes have been obtained after correction for the effective area as listed in Table 3.
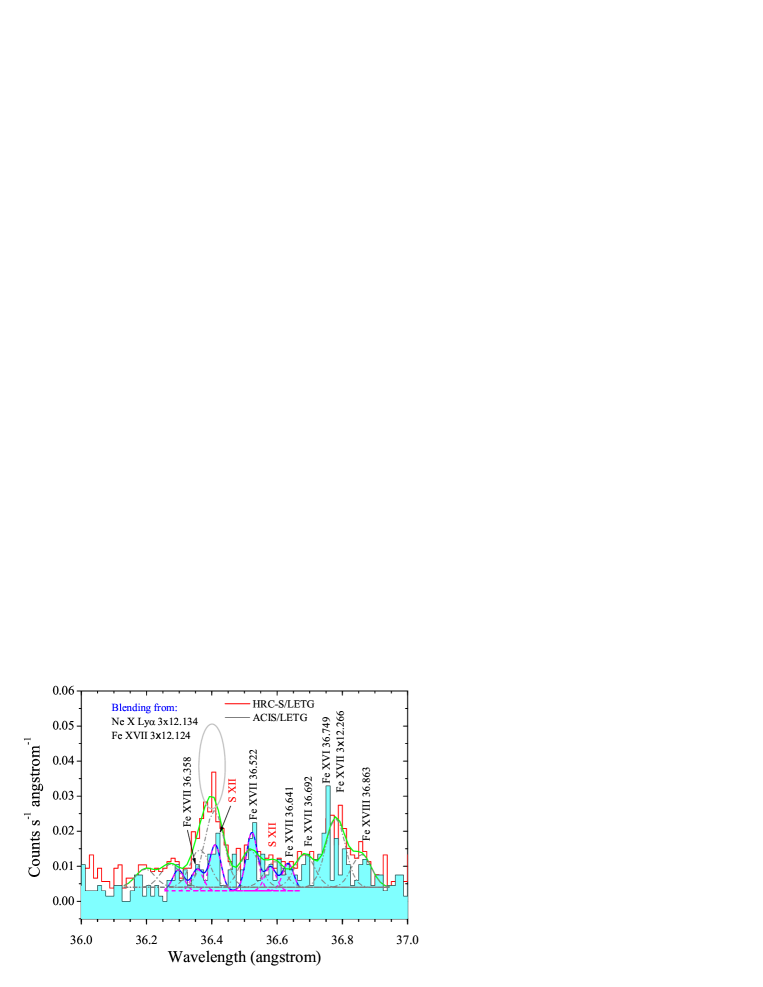
For Procyon, the two transition lines have been identified by Raassen et al. (2002) in the RGS and LETG observations. Here the line fluxes are derived separately again for the co-added LETG observations, which shows a good agreement with results of Raassen et al. (2002) within 1 error as illustrated in Table 3. For other stars, no reports of the identifications for the two lines can be found to our best knowledge.
For Capella, we fit the HRC-S and ACIS-S observations separately with multi-Gaussian components as detailed illustration in Fig. 4. It is clear that the line-width in HRC-S observation is wider than ACIS-S observation, which is due to its lower resolution. Additionally, for the line at 36.398 Å , the derived line flux from HRC-S observation is higher than the value from ACIS-S observation by a factor of 2.8 (see Table 3). This is due to the contamination from third-order diffraction of emission line at 12.136 Å with flux of 11.04 photons cm-2s-1 (see 7-th column in Table 3), resulting from Ne X Ly (12.134 Å ) and Fe XVII (12.124 Å ). According to the line fluxes around 36.394 Å derived from HRC and ACIS observations as well as the line flux around 12.136 Å , we conclude that the efficiency of third-order diffraction is about (17.48.2)% at the local wavelength range. The different background levels are due to the different effective areas (6.24 and 8.43 cm2, respectively). A search from the APEC/APED v1.3.1 (Smith et al., 2001) indicates that another emission line from Fe XVII at 36.358 Å partially blends in the HRC-S observation. For the emission line around 36.564 Å , the fitting result in the HRC-S observation is also higher than the value derived from ACIS-S observation by a factor of 1.6. This is due to the blending from Fe XVII line at 36.692 Å as resolved in case of ACIS-S observation. Here a question appears that whether there is a similar blending effect from high-order diffraction for inactive stars such as Procyon and Cen B. Analysis indicates that no emission line is detected at 12.136 Å for the inactive stars, that is, there is no contamination from third-order diffraction at the emission line at 36.394 Å .
For other three stars including Eri, YY Gem and TW Hya, similar procedure is used. The resulting line fluxes are listed in Table 3. However the blending effect has not been extracted. The line flux of the first order diffraction at 12.136 Å is listed in the 7-th column of Table 3, which will be used for the extraction of its contribution at the third-order diffraction position.
4.2 -diagnostic from the ratio
The diagnostic results of from Si X for stellar corona have been reported in our previous work (Liang et al., 2006b). Here the observed ratio and the constrained electron density with 1 errors are overlayed again in Fig. 2 (see black symbols). The comparison with the diagnosed electron density from K-shell C V ions, shows a good consistency, and a better results with low error bars for inactive stars (see the black symbols in Fig. 2).
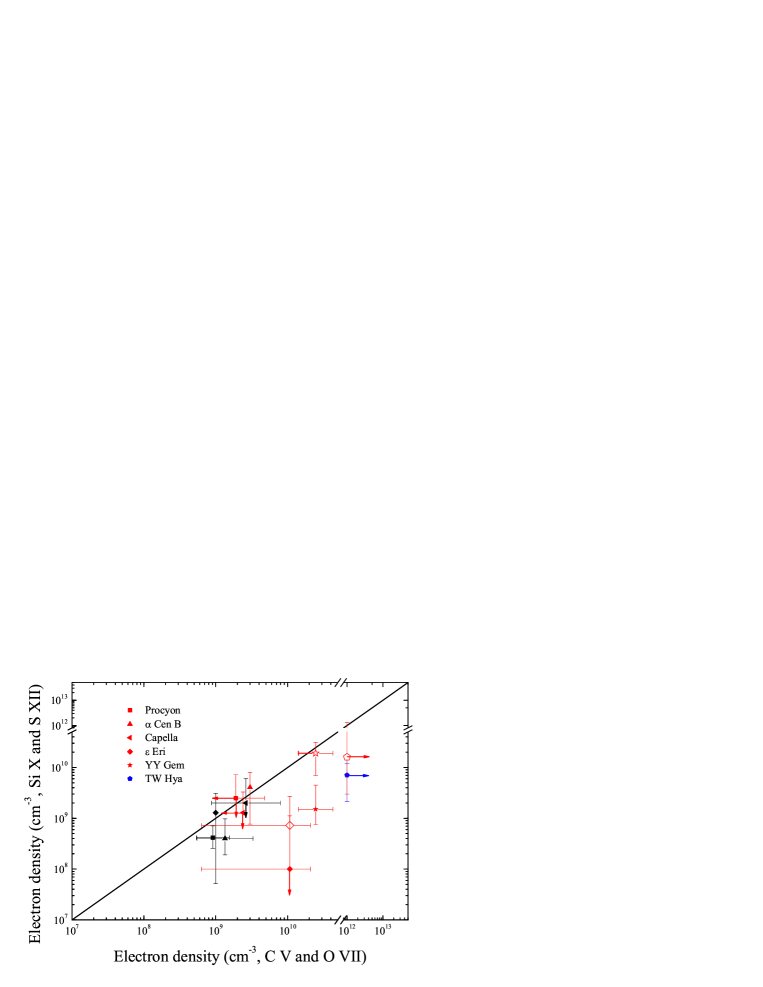
Using the line fluxes derived in the above section, we diagnose the electron density for our sample (see the blue symbols in Fig. 2) as listed in Table 4. For Capella, we adopt the line flux from ACIS-S observation, whereas the line fluxes from the HRC-S observations are used for other stars in our sample, that is the blending effect has not been considered. The deduced densities are typical values for inactive stars. We further compare the densities with the values derived from spectra of helium-like ions with the same peak line formation temperatures in the ionization equilibrium (Bryans et al., 2006) as shown in Fig. 5.
The density from Si X shows a good agreement with the value constrained by C V within the statistical errors. For Eri and Cen B, electron densities are not available from the helium-like C V and O VII spectra, respectively. The diagnostic from boron-like Si X and S XII compensates the estimation for the X-ray emitting regions with low temperatures. For inactive stars and Capella, the density constrained by S XII is also in agreement with the results from O VII. However, for Eri, YY Gem and TW Hya, it is clear that the density constrained by S XII is lower than the result from O VII, which is due to the blending effect from third order diffraction of the emission line at 12.136 Å resulting from Fe XVII and Ne X. For pre-main sequence star—TW Hya, Stelzer & Schmitt (2004) estimated the electron density is not less than 1.0cm-3, and conclude the X-ray emission being from the accretion shock.
Adopting the efficiency of third order diffraction determined in above subsection, and the line flux at 12.136 Å , we extract its contribution around 36.394 Å , and re-derived the line ratio and the corresponding electron density as illustrated by open-symbols in Fig. 4. For Eri, the resulted electron density is still lower than the value constrained by O VII by an order of magnitude. However, the determined from S XII shows an agreement with the constrained by O VII for YY Gem and TW Hya within the 1 uncertainty. We also notice that the electron density determined from S XII (or O VII) is slightly higher than that from Si X (or C V) with lower peak line formation temperature.
By using the line ratio of S XII and Ar XIV, effective electron densities of the laboratory plasmas in the Lawrence Livermore EBIT performed by Lepson and collaborators (Lepson et al., 2003, 2005), are constrained by the boron-like line ratio as illustrated by the red-square symbols in Fig. 2. For argon plasma, the constrained electron density ( cm-3) agrees well with the actual density (6.0 cm-3) estimated by the K-shell N VI spectrum as reported by Chen et al. (2004). For sulphur plasma, the electron density is firstly estimated to be cm-3. Through the laboratory measurement, Chen et al. (2004) further benchmark the line ratio of Fe XXII at the low-density limit. The experimental values are overlapped again by the red-circle symbols in Fig. 2. The astrophysical ratio (dark-yellow triangle) of Fe XXII is derived for the ACIS-S observation of Capella, and shows the constrained electron density is less than 7.6 cm-3, which is consistent with previous works for the stellar corona.
5 Conclusions
Collisional-radiative model calculation reveals that the line ratio [I()+I()]/I() of Si X, S XII, Ar XIV and Fe XXII is sensitive to the electron density in the ranges cm-3, cm-3, cm-3 and cm-3, respectively. This compensates the -diagnostics of K-shell spectra, e.g. helium-like ions. We further explore the transition lines of boron-like ions in the stellar coronal spectra measured with the LETG Spectrometer combined with HRC on board the Chandra X-ray Observatory. Though the emission lines are very weak, the electron density constrained from these lines, shows a good agreement with the those constrained by C V and O VII K-shell spectra inactive stars, and the uncertainties can be comparable with and even better than those estimated from K-shell spectra. When the blending effect from third-order diffraction has been taken into account, the deduced electron density increases, and gets a better consistency with that estimated from O VII for active stars, e.g. YY Gem. We also notice that the determined electron density from S XII is higher than that constrained from Si X, which is due to its higher peak temperature of line formations in collisional equilibrium.
By using the line ratio, effective electron densities in the electron beam ion trap (EBIT) plasma performed by Lepson et al. (2003, 2005) at Lawrence Livermore EBIT, are constrained to be cm-3 and cm-3 for sulphur and argon plasmas. In case of argon, a good agreement is found with the actual electron density derived from N VI K-shell spectrum.
In conclusion, the boron-like spectra provides a good -diagnostics for hot plasmas, and compensates the spectral diagnostic of K-shell spectrum.
References
- Audard et al. (2001) Audard M., Behar E., Gdel M., et al., 2001, AA, 365, L329
- Badnell et al. (2001) Badnell N.R., Griffin D.C., & Mitnik D.M., 2001, J. Phys. B: At. Mol. Opt. Phys., 34, 5071
- Bautista et al. (2004) Bautista M.A., Mendoza C., Kallman T.R., & Palmeri P., 2004, A&A, 418, 1171
- Behar et al. (2001) Behar E., Cottam J., Kahn S. M., et al., 2001, ApJ, 548, 966
- Bryans et al. (2006) Bryans P., Badnell N.R., Gorczyca T.W., et al., 2006, ApJS, 167, 343
- Chen et al. (2004) Chen H., Beiersdorfer P., Heeter L.A., Liedahl D.A., Naranjo-Rivera K.L., Trbert E., Gu M.F., & Lepson J.K., 2004, ApJ, 611, 598
- Foster et al. (1997) Foster V.J., Keenan F.P., & Reid R.H.G., 1997, At. Data and Nucl. Data Tables, 69, 77
- Gabriel & Jordan (1969) Gabriel A.H. & Jordan C., 1969, MNRAS, 145, 241
- Kastner et al. (2002) Kastner J.H., Huenemoerder D. P., Schulz N.S., et al. 2002, ApJ, 567, 434
- Keenan et al. (1993) Keenan F.P., Conlon E.S., Foster V.J., et al., 1993, Sol. Phys., 145, 291
- Keenan et al. (2000) Keenan F.P., Pinfield D.J., Mathioudaskis M., et al., 2000, Sol. Phys., 197, 253
- Keenan et al. (2003) Keenan F.P., Aggarwal K.M., Katsiyannis A.C., et al., 2003, Sol. Phys., 217, 225
- Keenan et al. (2003) Keenan F.P., Katsiyannis A. C., Reid R.H.G., Pradhan A.K., Zhang H.L. & Widing K.G., 2003, MNRAS, 346, 58
- Keenan et al. (2001) Keenan F.P., Aggarwal K.M., Williams D.R., et al., 2001, MNRAS, 326, 1387
- Keenan et al. (2000) Keenan F.P., O’Shea E., Thomas R.J., et al., 2000, MNRAS, 315, 450
- Landi et al. (2006) Landi E., Del Zanna G., Young P.R., et al., 2006,ApJS, 162, 261
- Landi & Gu (2006) Landi E., & Gu M.F, 2006,ApJ, 640, 1171
- Lepson et al. (2003) Lepson J.K., Beiersdorfer P., Behar E., et al., 2003, ApJ, 590, 604
- Lepson et al. (2005) Lepson J.K., Beiersdorfer P., Behar E., et al., 2005, ApJ, 625, 1045
- Liang & Zhao (2006a) Liang G.Y., Zhao G., 2006a, AJ, 132, 1547
- Liang et al. (2006b) Liang G.Y., Zhao G., Shi J.R., 2006b, AJ, 132, 371
- Liang et al. (2006c) Liang G.Y., Zhao G., & Zeng J. L. & Shi J.R., 2006c, J. Quant. Spect. of Rad. Trans., 102, 473
- Ness et al. (2003) Ness J.-U., Brickhouse N. S., Drake J.J., & Huenemoerder D. P., 2003, ApJ, 598, 1277
- Ness et al. (2004) Ness J.-U., Gdel M., Schmitt J.H.M.M., Audard M., & Telleschi A., 2004, AA, 427, 667
- Ness et al. (2001) Ness J.-U., Mewe R., Schmitt J.H.M.M., et al., 2001, AA, 367, 282
- Ness et al. (2002a) Ness J.-U., Schmitt J.H.M.M., Burwitz V., et al., 2002a, A&A, 394, 911
- Ness et al. (2002b) Ness J.-U., Schmitt J.H.M.M., Burwitz V., et al., 2002b, A&A, 387, 1032
- Ness & Schmitt (2005) Ness J.-U., & Schmitt J. H.M.M., 2005, A&A, 444, L41
- Porquet et al. (2001) Porquet D., Mewe R., Dubau J., et al., 2001, A&A, 376, 1113
- Raassen et al. (2002) Raassen A.J.J., Mewe R., Audard M., et al., 2002, AA, 389, 228
- Raassen et al. (2003) Raassen A.J.J., Ness J.-U., Mewe R., et al., 2003, A&A, 400, 671
- Schmitt et al. (2005) Schmitt J.H.M.M., Robrade J., Ness J.-U., et al., 2005, A&A, 432, L35
- Stelzer & Schmitt (2004) Stelzer B., & Schmitt J.H.M.M., 2004, A&A, 418, 687
- Smith et al. (2001) Smith, R.K., Brickhouse, N.S., Liedahl D. A., et al. 2001, ApJ, 556, L91
- Zhang et al. (1994) Zhang H.L., Graziani M., Pradhan A.K., 1994, A&A, 283, 319