A spectral line survey of NGC 7027 at millimeter wavelengths
Abstract
We report on a recent spectral line survey of the planetary nebula (PN) NGC 7027 (catalog ) using the Arizona Radio Observatory (ARO) 12 m telescope and the Heinrich Hertz Submillimeter Telescope (SMT) at millimeter wavelengths. The spectra covering the frequency ranges 71–111 GHz, 157–161 GHz, and 218–267 GHz were obtained with a typical sensitivity of mK. A total of 67 spectral lines are detected, 21 of which are identified with 8 molecular species, 32 with recombination lines from hydrogen and helium, and 14 remains unidentified. As the widths of emission lines from CO, other neutral molecules, molecular ions, as well as recombination of H+ and He+ are found to be different with each other, the line strengths and profiles are used to investigate the physical conditions and chemical processes of the neutral envelope of NGC 7027 (catalog ). The column densities and fractional abundances relative to H2 of the observed molecular species are calculated and compared with predictions from chemical models. We found evidence for overabundance of N2H+ and underabundance of CS and HNC in NGC 7027 (catalog ), suggesting that X-ray emission and shock wave may play an important role in the chemistry of the hot molecular envelope of the young PN.
1 Introduction
We now realize that the circumstellar envelopes of evolved stars are active sites of molecular synthesis. Millimeter-wave spectroscopy has identified over 60 molecular species in the envelopes of asymptotic giant branch (AGB) stars, their descendants planetary nebulae (PNs), and the transition objects between the two phases, proto-planetary nebulae (PPNs) (Olofsson, 1997; Cernicharo et al., 2000; Ziurys et al., 2007). These gas-phase molecules are believed to be the precursors of complex organic compounds that are found in PPNs and PNs (Cernicharo et al., 2001a, b; Kwok, 2004). Since the molecular synthesis takes place in the circumstellar envelope through either gas-phase or grain-surface reactions, the study of the changing chemical composition and molecular abundance between objects in consecutive phases of evolution will provide useful information on the chemical pathways of their formation. Furthermore, since the circumstellar envelopes are expanding, the dynamical timescales impose a time limit on the reaction time scales. The typical dynamical timescales for AGB stars, PPNs, and PNs are – yr, yr, and – yr, respectively. The observation of a specific molecular species in the PPN phase which is not seen in AGB stars implies that this molecule must be formed on timescales shorter than a few thousand years. The changing relative abundance of molecular species between different phases can also point to specific chemical pathways. Motivated by these considerations, we have performed spectral line surveys of several objects in the late stages of stellar evolution and try to provide a systematic and uniform study of circumstellar chemistry.
The study of the circumstellar chemistry of PNs is particularly interesting and challenging because of the additional dimension of photochemistry. Since part of the circumstellar envelope is ionized by ultraviolet radiation from the hot central star, molecules can be photoionized or photodissociated. The molecular composition of the circumstellar envelopes is therefore expected to be qualitatively different from AGB stars and PPNs. The young, carbon-rich PN NGC 7027 (catalog ) is known to be the PN with the richest molecular content. Because of its high-mass (0.7 M⊙) central star, the central star of NGC 7027 (catalog ) is evolving very quickly, reaching an effective temperature of 219 000 K in a few hundred years since the onset of photoionization (Zhang et al., 2005). The remnant of the AGB envelope is eroded by a nascent ionized region of 10″. Imaging observations have shown that a thin photodissociation region (PDR) separates the ionized region and the extended molecular envelope with a size (see Hasegawa & Kwok, 2001, and the references therein). A large number of molecular emission lines have been detected by infrared (IR) and radio spectroscopy (e.g. Liu et al., 1996; Cox et al., 1993; Hasegawa & Kwok, 2001; Herpin et al., 2002). Unambiguously detected molecular species in NGC 7027 (catalog ) include H2, OH, CO, CO+, CH, CH+,HCN, HNC, HCO+, H2O, N2H+, CN, CS, C2H, C3H2, SiS, and their isotopomers. A systematic molecular-line observations of PNs by Bachiller et al. (1997) and Josselin & Bachiller (2003) has found that the column densities of molecules observed in NGC 7027 (catalog ) are generally larger than those in other PNs. Compared with other PNs, NGC 7027 (catalog ) shows a low HNC abundance and an abnormal high N2H+ (Bachiller et al., 1997). Hasegawa & Kwok (2001) suggested that most of the observed molecular lines are emitted from the PDR of the object except for CO emission which arises from a much more extended region. According to Cox et al. (1987), lines from the ring molecule C3H2 are emitted from dense regions. The observations by Thronson & Bally (1986) and Deguchi et al. (1990) suggested that grain chemistry probably plays an important role for the formation of molecules in NGC 7027 (catalog ).
The chemistry in the PDR of NGC 7027 (catalog ) has been modeled by Yan et al. (1999), who suggested that the molecular abundance is significantly influenced by both photodissociation and shock chemistry. A detailed chemical model of the neutral envelope of NGC 7027 (catalog ) by Hasegawa et al. (2000) suggested that most of the detected molecules in NGC 7027 (catalog ) are formed over a short timescale after the object evolved into the PN stage. This was supported by the observations of Herpin et al. (2002) with the Infrared Space Observatory (ISO). However, different conclusion was obtained by Josselin & Bachiller (2003) who suggested that most of molecules can survive during the transition from AGB to PN. Redman et al. (2003) modeled the chemical evolution from AGB to PPN and PN considering the affect of clumpiness. By comparing model results and observations, they proposed that the clumps form at an early stage of PN and may be plentifully present within NGC 7027 (catalog ).
Hydrogen and helium recombination lines from NGC 7027 (catalog ) are detectable at millimeter wavelengths, allowing us to investigate the physical conditions and dynamics of the ionized regions. An advantage of the radio data is the reduced effect of dust extinction. A few radio recombination lines from H56–H110 have been detected in NGC 7027 (catalog ) (Roelfsema et al., 1991; Chaisson & Malkan, 1976; Ershov & Berulis, 1989, and the references therein). Ershov & Berulis (1989) constructed a dynamical model to explain the observed radio recombination lines and found that the expansion velocity of the ionized gas is in good agreement with that of the molecular envelope. Roelfsema et al. (1991) observed the H76 line observations and argued that the ionized gas is decelerated by the surrounding molecular material.
In this paper, we report a systematic spectral survey of NGC 7027 (catalog ) using the ARO 12 m and the SMT 10 m telescopes 111The 12 m telescope and the Heinrich Hertz Submillimeter Telescope (SMT) is operated by the Arizona Radio Observatory (ARO), Steward Observatory, University of Arizona., covering the frequency ranges 71–111 GHz, 157–161 GHz, and 218–267 GHz. These data allow us to investigate the physical conditions and chemical compositions of the molecular envelope of this PN. This paper is organized as follows: Sect. 2 describes the observations and the procedures of data reduction; Sect. 3 presents the identification and measurements of detected emission lines; in Sect. 4 the method of data analysis is described and the resulting excitation temperatures, column densities and abundances relative to H2 are presented; in Sect. 5, we discuss the physical and chemical characteristics in the molecular envelope and ionized regions; and the main conclusions are summarized in Sect. 6.
2 Observations and data reduction
The spectral survey was carried out between 2005 April and 2006 September. The observations were made in beam switching mode with an azimuth beam throw of 2′. Pointing accuracy was checked every two hours. The on-source integration time was more than one hour for each frequency setting.
The 71–111 GHz and 157–161 GHz spectra were obtained using the ARO 12 m telescope at Kitt Peak. The dual-channel SIS receivers were employed in single sideband mode, yielding a system temperature of 150–400 K. The image rejection ratio was 16–20 dB. The receiver back-ends were equipped with two 256-channel filter banks (FBs) with spectral resolutions of 500 kHz and 1 MHz and a millimeter autocorrelator (MAC) with 3072 channels and 195 kHz resolution. All spectrometers were operated in series mode. Two orthogonal linear polarization modes were measured. The temperature scale, , was calibrated and corrected for atmospheric attenuation, radiative loss, and rearward and forward scattering and spillover by the chopper-wheel method. The main beam brightness temperature was derived using , where is the corrected beam efficiency. Over the frequency range 71–161 GHz, is from 0.94 to 0.71, and the conversion factor is 32.5–29.1 Jy/K.
The 218–267 GHz observations were carried out with the SMT 10 m telescopes at Mt. Graham, Arizona, using the dual-channel SIS receivers operated in single sideband dual polarization mode. The system temperature is typically 400–700 K. The spectrometers used were a 2048-channel acousto-optical spectrometer (AOS) with a spectral resolution of 500 kHz per channel and 1024-channel Forbes Filterbanks (FFBs) with a spectral resolution of 1 MHz per channel. All spectrometers were used simultaneously. The data were calibrated to the antenna temperature scale, , which was corrected for atmospheric attenuation. is converted to main beam temperature by , where the main beam efficiency, , is . The conversion factor is 35 Jy/K.
All spectra were reduced using the CLASS software package in GILDAS 222GILDAS is developed and distributed by the Observatorie de Grenoble and IRAM.. After discarding the bad scans which are seriously affected by bandpass irregularities, we co-added the calibrated spectral data using the noise of each spectrum as weights. A low-order polynomial baseline defined by the line-free spectral regions was subtracted from each spectrum. In order to improve the signal-to-noise, the ARO 12 m and SMT 10 m spectra were smoothed and rebinned to a spectral resolution of 1 MHz and 3 MHz, respectively, yielding a typical noise temperature of mK in main beam temperature unit. Based on a few strong lines detected in different spectrometers and different epochs, we estimate that the calibration uncertainties introduced by instruments and atmospheric conditions amount to about .
3 The spectra
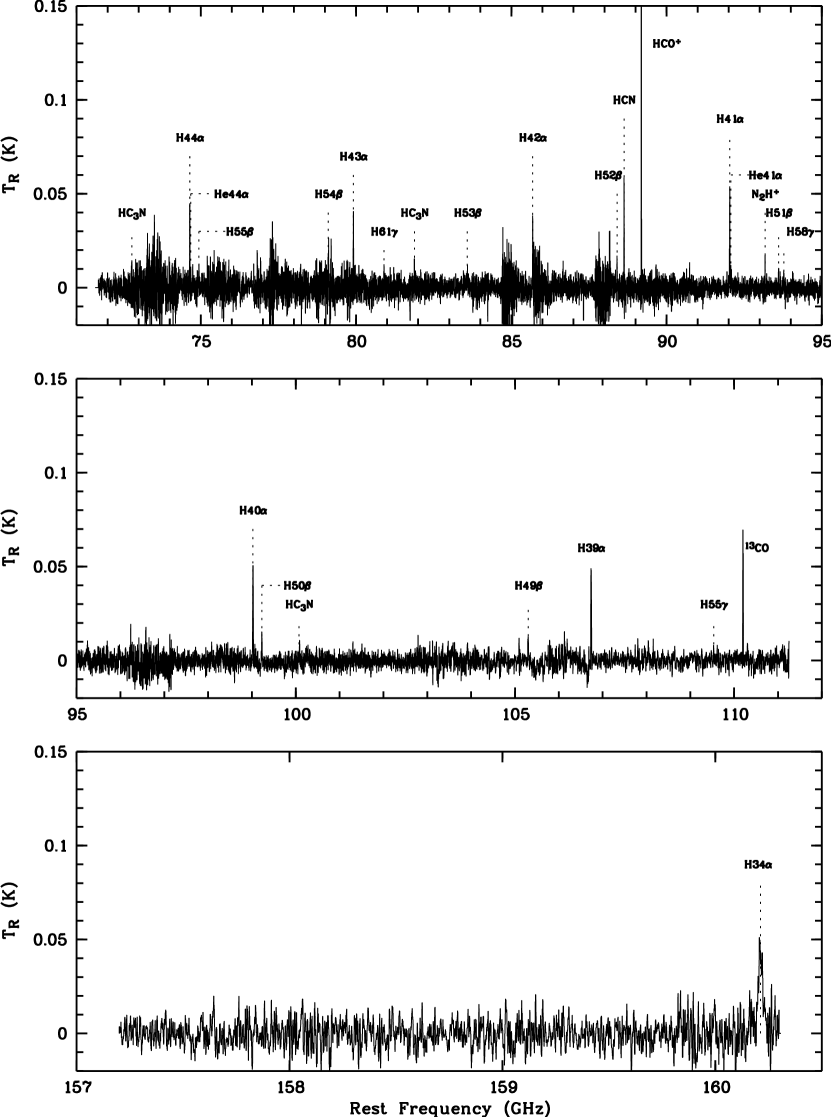
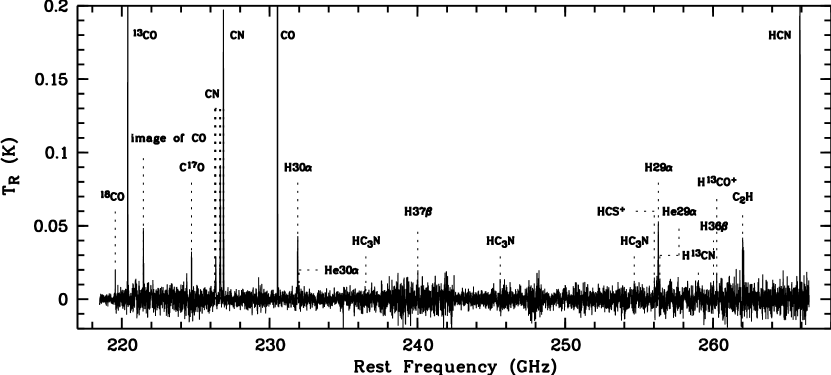
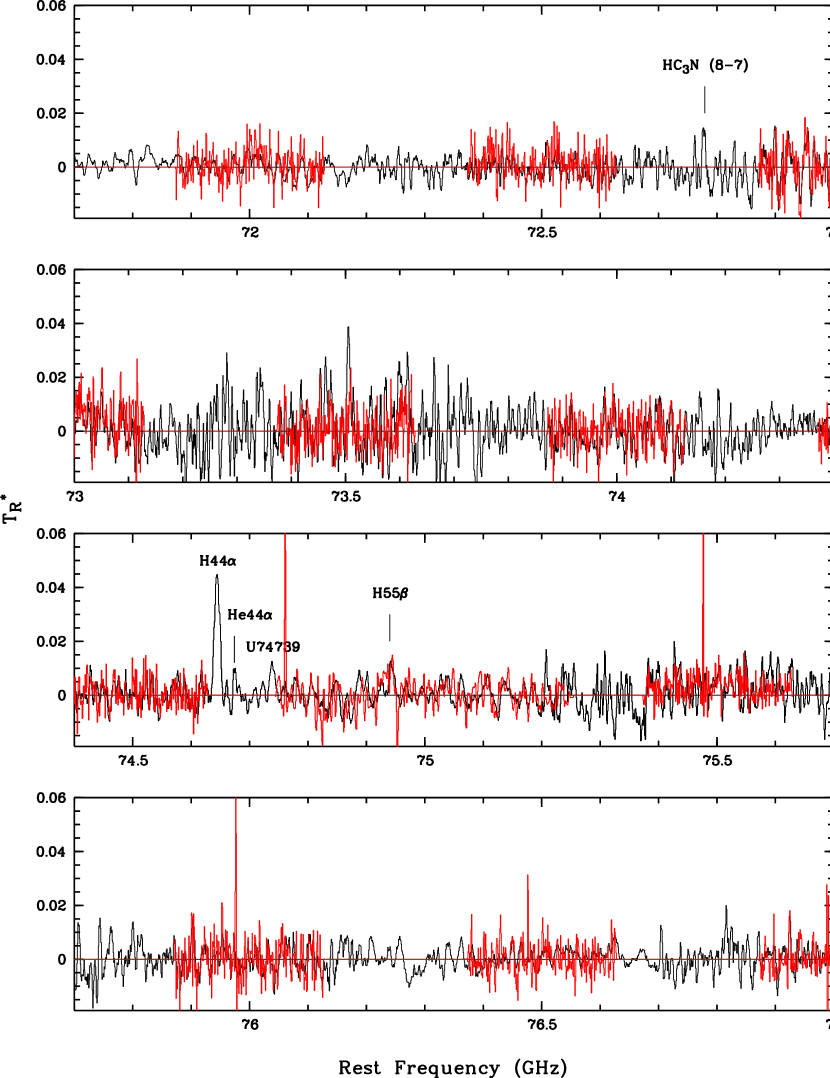
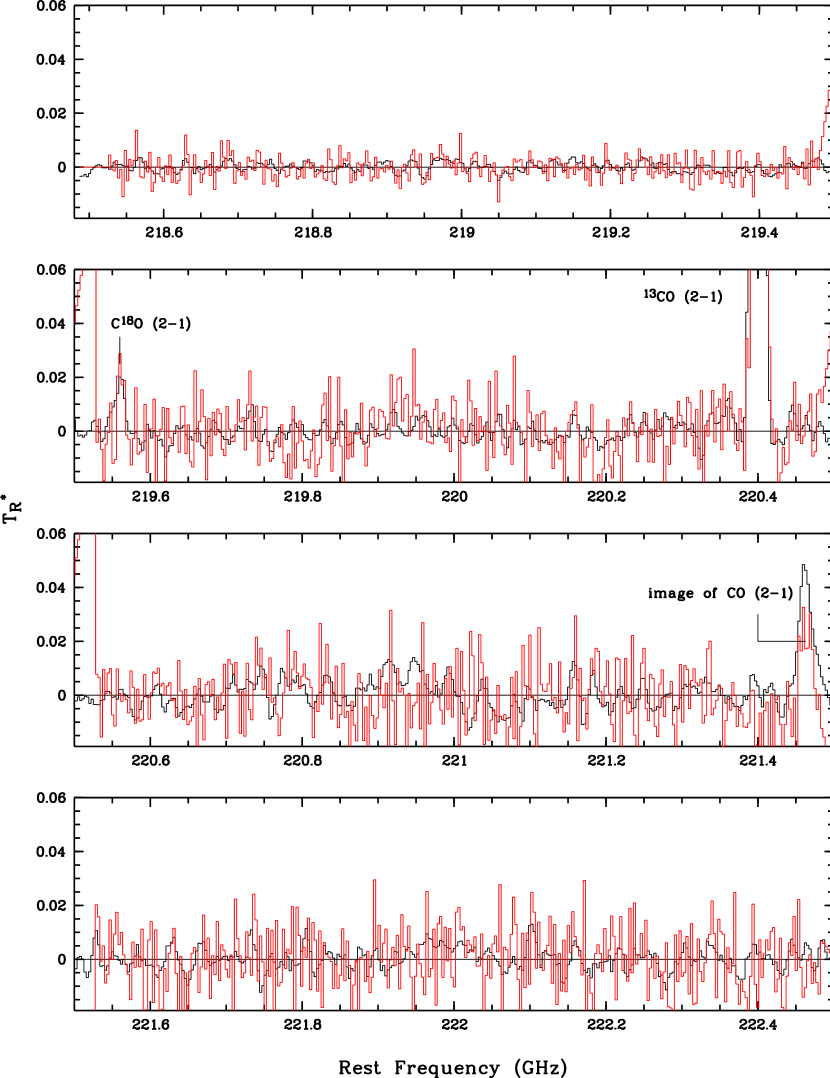
The spectra of NGC 7027 (catalog ) obtained with the ARO 12 m telescope and the SMT 10 m telescope are presented in Fig. 1 and Fig. 2, respectively. The spectra at a full resolution are shown in Fig. 3 and Fig. 4, which is only available in the electronic version of this manuscript. Note that some features in these figures are caused by bandpass irregularities. More molecular lines were detected in the 10 m spectra compared to the 12 m spectra as the ARO 12 m telescope has a larger beam size and thus bears larger beam dilution effect. Sections of the spectra containing spectral lines are expanded in Figs. 5 (12 m) and 6 (10 m) in order to show the line profiles. Since each spectrum was simultaneously observed with two receiver back-ends, an emission line should be recorded by both spectrometers. This allows us to distinguish between real emission lines and artificial features. Contamination from image band was carefully checked. The feature at 221.463 GHz was found to be the CO (2–1) line from the image band. No other lines from the image band were apparent. A total of 71 distinct emission features were measured.
The molecular lines are identified on the basis of the JPL catalog (Pickett et al., 1998)333http://spec.jpl.nasa.gov. and the Cologne database for molecular spectroscopy (CDMS, Müller et al., 2001, 2005)444http://www.ph1.uni-koeln.de/vorhersagen/.. The suggested identifications are labeled in Figs. 1 and 2. Combining the single and blended features, we identified 21 molecular lines, belonging to 8 molecular species (CO, CN, C2H, HCN, HCO+, HCS+, HC3N, N2H+) with a total of 13 isotopomers. We also present ‘possible’ detection of C3H2, HC17O+, and HC18O+. 14 lines remain unidentified. Several of these transitions are discovered for the first time in NGC 7027 (catalog ). A list of molecular lines detected in our spectra is presented in Table 1. The table also gives the noise, the main beam temperatures, and the integrated intensities (in units of K km/s) of the lines.
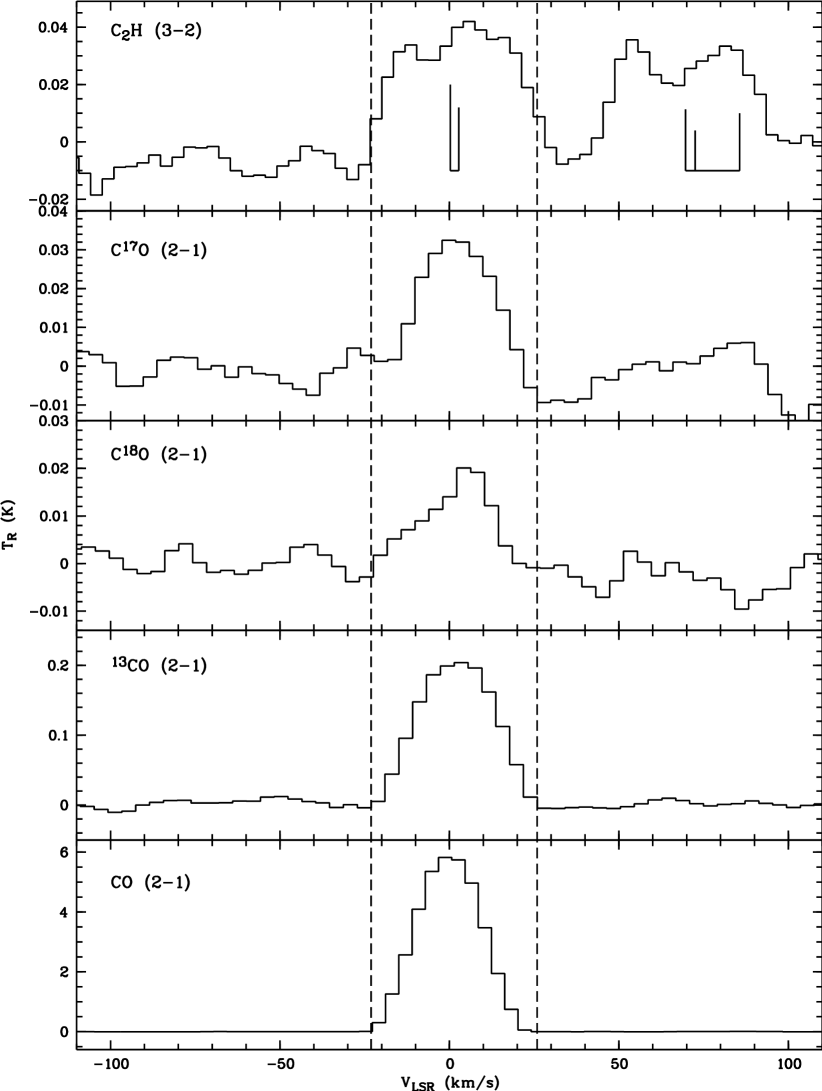
The CO (2–1) and 13CO (1–0, 2–1) lines have been extensively observed by various telescopes in the past (see, e.g. Hasegawa & Kwok, 2001). The integrated intensities of the CO (2–1) and 13CO (2–1) lines presented in Table 1 are lower than those reported by Hasegawa & Kwok (2001) (see their Table 1). However, we note that the CO(2–1)/13CO(2–1) integrated intensity ratio of 24.8 is in excellent agreement the value of 21.8 in Hasegawa & Kwok (2001). The lower antenna temperatures detected here are due to the larger beam dilution effect since the beam size of the SMT 10 m telescope is a factor of larger than the 15 m James Clarke Maxwell Telescope used by Hasegawa & Kwok (2001). The C18O (2–1) and C17O (2–1) lines were clearly detected in our spectra. To our knowledge, it is the first time that these two transitions are detected in NGC 7027 (catalog ).
Three strong CN (2–1) hyperfine groups are detected in our observations. These lines have previously been seen by Cox et al. (1993), Josselin & Bachiller (2003), and Bachiller et al. (1997). The emission feature at 227.2 GHz is only marginally above our limit of detection and may be a combination of the CN () and the C3H2 (432–321) transitions. Other previous detections of CN in NGC 7027 (catalog ) include the and transitions at 340 and 114 GHz, respectively (Hasegawa & Kwok, 2001; Bachiller et al., 1997; Thronson & Bally, 1986; Cox et al., 1993; Josselin & Bachiller, 2003).
The C2H (3–2) transitions in NGC 7027 (catalog ), first discovered by Hasegawa & Kwok (2001), are confirmed in our observations. All the C2H (3–2) lines show a double-peaked profile. The C3H2 (220–211) at 18.3 GHz and the C3H2 (110–101) at 21.6 GHz transitions were first detected in the PN by Cox et al. (1987). We attempted to search for two new C3H2 transitions (625–514 and 533–422) at higher frequencies. The two lines are extremely faint, with intensities between 2–3 noise level. Hence, our detection of C3H2 should be treated with some caution.
The well studied HCN (1–0, 3–2) and HCO+ (3–2) transitions are also detected. We also detected their isotopic transitions H13CN (3–2) and H13CO+ (3–2). However, the transitions H13CN (1–0) at 86.340 GHz and H13CO+ (1–0) at 86.754 GHz are overwhelmed by noise. The transitions HC17O+ (1–0) and HC18O+ (1–0) are only marginally above 2 noise level, and thus have an ambiguous detection. A narrow feature at 256.028 GHz has been discovered and identified with the HCS+ (6–5) transition, confirming the observations by Hasegawa & Kwok (2001). We also detect the N2H+ (1–0) line which was first reported by Cox et al. (1993).
An unsuccessful search for the HC3N (11–10) transition at 100.076 GHz was made by Thronson & Bally (1986).555Note that in Table 1 of Thronson & Bally (1986), the frequency of the HC3N (11–10) transition is given as “110.0 GHz” by mistake. In our observations, several HC3N lines are identified in the spectra from both the ARO 12 m telescope and SMT 10 m telescope. However, we do not detect the transitions HC3N (10–9) at 90.979 GHz and HC3N (12–11) at 109.174 GHz, making our identification arguable. If confirmed, this is the first detection of this species in a PN.
The unidentified lines are listed in Table 2. Most of them are very faint, and are only marginally detected. Some of these lines have been detected in the star formation regions Sgr B2(N) and Sgr B2(M) (Turner, 1989; Nummelin et al., 1998). We also compared our spectra with a recent molecular line survey of the PPN CRL 618 (catalog ) by Pardo et al. (2007). These U-lines are not detected in their spectra. Thus we infer that some of these lines probably arise from species which are formed in very strong UV radiation.
Table 3 lists a number of molecular species which are not detected by our observations of NGC 7027 (catalog ). For a given species, the strongest transition in our frequency ranges is given in the table aiming to reach the tightest constrain on its column density. The upper limits of the integrated intensities can be obtained by , where is the noise, and is the number of channels within the line width .
A number of recombination lines, including 24 hydrogen lines and 8 helium lines, are detected in our observations. Previously, most of the recombination lines were observed in the low-frequency bands. The identifications of recombination lines are based on the calculations by Lilley & Palmer (1968) and Towle et al. (1996). No heavy-element recombination line is visible in our spectra as they are under our detection limit. The identifications and measurements of the recombination lines are presented in Table 4. All recombination lines were measured using Gaussian line profile fitting. Some of the lines, such as H36, are probably blended with unknown features and show a relatively broad profile. The H60 line at 84.914 GHz The H60 line and The He42 line at 85.723 GHz fall within the spectral regions which have a low signal-to-noise (see Fig. 1), and thus their measurements are uncertain.
4 Analysis
4.1 Excitation temperatures and column densities
In order to obtain molecular excitation temperatures and column densities, the effect of beam dilution is corrected under the assumption that both the source brightness distribution and the antenna beam have a Gaussian profile. The source brightness temperature (which is equivalent to source intensity) was obtained by , where the main-beam brightness temperature has the physical meaning of average intensity, is the antenna full beam at half-power and is the source diameter. The beam sizes of the ARO 12 m telescope and the SMT 10 m telescope are 86′′–38′′ and 32′′–28′′ over the frequency ranges 71–161 GHz and 218–268 GHz, respectively. Different molecular species in NGC 7027 (catalog ) might have different distribution and thus should be separately estimated in terms of map of each species. Based on the observations of Hasegawa & Kwok (2001), we have assumed for all the species except CO. High-resolution mapping observations of CO in NGC 7027 (catalog ) suggest that the CO emission originates in a more extended region (Masson et al., 1985), so we adopted for CO and its isotopomers.
The standard rotation-diagram method was applied to determine molecular excitation temperatures and column densities. Under the assumption that i) the lines are optically thin, ii) the level populations are in LTE and can be described by a Boltzmann temperature, referred to as the “excitation temperature” (), and iii) is much larger than the background temperature (), we have the relation
| (1) |
where , , and is the population, degeneracy, and excitation energy of the upper level, is the integrated intensity of the source, the line strength, the dipole moment, the line frequency, the rotation partition function, and the column density. If many transitions for an individual molecule are observed, a straight line can be fitted by plotting the integrated intensity versus upper level energy. Then and the total column density can be deduced from the slope () and intercept [] of this line.
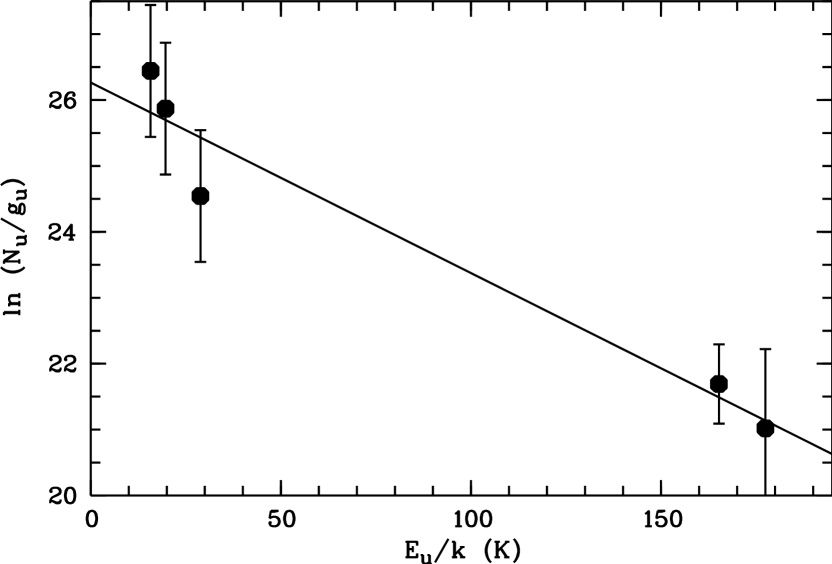
Albeit with some problems, we probably detect five HC3N transitions. The excitation energies of the upper levels cover a large range with 10 K K, allowing us to determine excitation temperature and column density. Fig. 7 shows the rotation diagram for HC3N. A linear least-squares fit to all the transitions produces cm-2. However, the data in the rotation diagram suggest that the low transitions seem to arise from a colder region. The results presented in Hasegawa et al. (2000) suggest that the neutral envelope of NGC 7027 (catalog ) consists of a geometrically thin and dense shell and an extended outer stellar wind region, with the temperature in the dense shell being more than a factor of 10 higher than that in the wind region. In this picture, our HC3N high transitions would originate dominantly in the hot, dense shell, whereas the cold stellar wind region contributes significantly to the excitation of low lines. The stratified temperature structure may cause some problems in the calculations of column density. To get more precise results, detailed modelling is required, as done by Pardo et al. (2004) and Pardo & Cernicharo (2007) for CRL 618 (catalog ). However, this is hampered by the weakness of most molecular lines in NGC 7027 (catalog ).
No rotation diagram is presented for other molecular species because either only one line for the species was detected, or the upper levels of the observed transitions have similar excitation energies. We thus adopted a constant excitation temperature of K, as deduced from the HC3N rotation diagram, and applied Equ. (1) to estimate the column densities of CN, C2H, C3H2, HCS+, N2H+, and HCO+. We derived a column density of cm-2 for CN, which is consistent with the values of cm-2 and cm-2 deduced by Hasegawa & Kwok (2001) and Josselin & Bachiller (2003), respectively. Our analysis yields cm-2 for C2H, in good agreement with the value of cm-2 given by Hasegawa et al. (2000). From the observations of the C3H2(–) at 18.3 GHz C3H2(–) at 21.6 GHz transitions, Cox et al. (1987) found (C3H2) cm-2, which is lower than our value ( cm-2) by a factor of about 36. Given large measurement errors, our value may be unreliable. For HCS+, we obtain a value of cm-2, which should be treated with some caution as it was derived from an extremely faint emission line. From the N2H+(1–0) line at 93.2 GHz, we derive (N2H+) cm-2. The column densities of HCS+ and N2H+ have not been reported previously. Our determination of (HCO+) is higher than that of Hasegawa & Kwok (2001) by a factor of 5. Considering the uncertainties in calibrations, such difference is not unreasonable.
The strong HCN and CO transitions are likely to be optically thick and therefore the rotation diagram analysis is not applicable. For these lines we used the following equations to deduce their excitation temperatures and column densities.
The equation of radiative transfer is
| (2) |
where with the Planck constant and the Boltzmann constant, is the optical depth at the center of a line, and is the cosmic background temperature (2.7 K). For the optically thick lines (), can be obtained from Equ. (2) and is given by
| (3) |
Assuming that the isotopomer has the same excitation temperature as the main line, we can obtain its optical depth at the line center from Equ. (2)
| (4) |
The column density of the isotopomer can be derived from
| (5) |
where is the line width.
Assuming that lines of the isotopomer is optically thin, the ratio of the main line and the isotopic line can be derived using Equ. (3):
| (6) |
Once is obtained from Equ. (4), the optical depth of the main line, , can be obtained from the above equation.
Finally, we can determine the column density of the main species using
| (7) |
Applying the above equations to HCN and CO, we obtained their excitation temperatures and column densities. The results are summarized in Table 5. Our determination of the column density of HCN is a factor of 16 higher than that derived by Hasegawa & Kwok (2001). In our calculations, a large error may be caused by the very faint H13CN line. If applying Equ. (1), we derive a lower limit of (HCN) cm-2, in agreement with the result of Hasegawa & Kwok (2001).
For comparison, Table 5 also lists the column densities predicted by the model of Hasegawa et al. (2000). The column densities deduced by current work are in of the same approximate orders of magnitude with the model predictions except for CO and N2H+. The model overestimation of the column density of CO is addressed by Hasegawa et al. (2000), and an improved model (Hasegawa & Kwok, 2001) gives a better fit to the observed column density of CO. The model, however, fails to explain the extremely high column density of N2H+. A detailed discussion will be presented in the next section.
Assuming a line width of 30 km s-1, we estimate the upper limits of the column densities for several non-detected molecular species, and these values are presented in Table 3. Since these upper limits may still serve as useful constraints of the chemical processes in NGC 7027 (catalog ), these upper limits are compared with the model predictions of Hasegawa et al. (2000). Table 3 shows that the observed upper limits are in reasonable agreement with the model predictions except for CS, which observed column density is lower than the model prediction. Even in the improved model of Hasegawa & Kwok (2001), the theoretical column density of cm-2 is still higher than the upper limit derived in the present study.
4.2 Abundances calculations
In order to calculate the fractional abundance of a molecular species relative to H2, we need to know the number density of the species and that of H2, which can be derived by solving the coupled radiative transfer and statistical equilibrium equations. A full treatment of the line excitation requires knowledge of the geometrical structure of the envelope, the rates for collisional excitation of the molecules, and the effects of dust emission and absorption, which however is poorly known, and is beyond the scope of this paper. Instead, assuming that all molecular emission originate in a spherical shell, we calculated the molecular abundances respect to H2 using the expression suggested by Olofsson (1996),
| (8) |
where the integrated intensity is given in K km s-1, the full half power beam width is in arc sec, is the expansion velocity given in km s-1, is the distance in pc, is the mass loss rate in , the line frequency in GHz, the statistical weight of the upper level, the Einstein coefficient for the transition, the energy of the lower level, and with and the inner radius and outer radius of the shell. The equation is deduced under the assumption that the lines are optically thin, is uniform throughout the shell, the molecular density follows an law, and the shell is formed by a constant mass loss rate and has a constant expansion velocity. One should bear in mind that the spatial variations in the fractional abundances and excitations may be a large source of error. For the calculations, we adopted the excitation temperatures deduced in section 4.1 (see Table 5) and a distance 880 pc to NGC 7027 (catalog ) (Masson, 1989). Following the model of Hasegawa et al. (2000), we assumed pc and pc. The expansion velocity was determined from the widths of a few strong lines, which suggest km s-1.
Assuming that the CO (2–1) emission arises from the stellar-wind region, we can estimate the mass loss rate from the line strength using the formula given by Winters et al. (2002),
| (9) |
where the correction factor for the CO (2–1) line, the distance pc, the abundance of CO relative to H2, , is assumed to be , and the expansion velocity km s-1. The derived mass loss rate of is in good accord with the value of derived from the model calculations by Sopka et al. (1989). The error in the determination of due to the distance uncertainty is .
Using Equ. (8), we derived for all the observed molecular species and the results are given in Table 5. The calculated abundance ratios between different species are not rigorously equal to the ratios of column densities. This is due to two reasons. One is the different assumptions made to deconvolve the brightness temperature distribution of the source from the antenna beam. For the calculations of column densities, we have simply assumed that the source brightness distribution is Gaussian. Second, for the abundance calculations, we have assumed that the lines are optically thin. Consequently, when the emission is optically thick, given in the table should be treated as a lower limit. We can use the ratio, which approximately gives the column density of H2, to estimate the error due to these assumptions. The last column of Table 5 gives the ratio deduced from each molecular species. These values are generally in good agreement except that derived from CO, which is outside the 3 range. The high ratio gives a upper limit of (H2) since the CO emission is certainly optically thick. Excluding the value deduced from CO, we obtained the average H2 column density of N cm-2. Hence, the error due to the assumptions of structure and optically-thin emission should be less than a factor of 2. Combining with the uncertainties caused by various parameters ( excitation temperature, distance, source size etc.) and our measurements, we crudely estimate that the total error in the calculations of column density and abundance is a factor of . The column density ratios and the abundance ratios are expected to be more reliable.
5 Results and Discussion
5.1 Chemistry
5.1.1 CN and HCN
Given their relatively large dipole moments, the rotational transitions from the molecules CN and HCN are often detected in molecular clouds. HCN can be formed through the dissociative recombination of HCNH+, while CN is dominantly produced via the photodissociation of HCN by UV radiation. Therefore, the CN abundance dramatically increases with increasing stellar radiation when a star evolves beyond the AGB, through the proto-PN stage and to the PN stage. Such a trend has been revealed by a sample study of Bachiller et al. (1997). There is observational evidence showing that the abundance of HCN increases in the PPN stage, and then dramatically decreases in the PN stage (Herpin et al., 2002). This can be attributed to different roles that dissociative recombination and photodissociation play in the two stages. Our observation yield a HCN/13CO abundance ratios of , consistent the value of reported by Bachiller et al. (1997). However, we do not find large CN enhancement in NGC 7027 (catalog ). The CN/H2 abundance ratio is , about a factor of 10 lower than those in AGB stars reported by Woods et al. (2003). The model of Hasegawa et al. (2000) seems to overestimate the CN abundance by a factor of 2–3 although this may be explained with the uncertainties in the measurements and calculations. The unexpectedly low CN abundance was also found by Ali et al. (2001) in their modelling of general PNs.
It has been generally accepted that the CN/HCN abundance ratio can trace the UV radiation field. Bachiller et al. (1997) suggest that after a star evolves into the PN stage, the CN/HCN abundance ratio remains constant (). We obtain (CN)/(HCN) in NGC 7027 (catalog ). This probably suggests that the reaction
| (10) |
is very efficient in this young PN.
5.1.2 HNC
HNC can be formed in a similar way as HCN. Herpin et al. (2002) suggested that in PPN stage the HNC abundance is enhanced with respect to HCN through ion-molecule reactions. Both observations (Sopka et al., 1989; Bachiller et al., 1997; Josselin & Bachiller, 2003) and models (Ali et al., 2001) indicate that the average abundance ratio HNC/HCN in PNs is . However, we do not detect HNC emission in NGC 7027 (catalog ). The HCN/HNC ratio is estimated to be larger than 30. The abnormally low HNC abundance in NGC 7027 (catalog ) was also noted by Bachiller et al. (1997) and Josselin & Bachiller (2003), who obtained . As proposed by Bachiller et al. (1997), HNC may have been destroyed in NGC 7027 (catalog ) through
| (11) |
which is efficient in high temperatures. The hypothesis is supported by the high HCN abundance. The model of Hasegawa et al. (2000) did not include the HNC reaction chains. A more comprehensive model is required to account for the observed CN/HCN/HNC abundance ratio.
5.1.3 HC3N
HC3N is commonly observed in AGB stars and proto-PNs (e.g. Cernicharo et al., 2000; Pardo et al., 2004). Pardo et al. (2005) found that HC3N is quickly reprocessed from HCN in PPN stage. Prior to this work, HC3N has never been detected in PNs and its absence is often explained as the result of efficient photodisociation due to the strong UV radiation in PNs. Thronson & Bally (1986) estimated the abundance ratio in NGC 7027 (catalog ). The abundance upper limit of HC3N is comparable with that in IRC+10216 (catalog ). They thus did not find evidence for underabundance of HC3N in the PN.
Here we report a possible detection of HC3N in the PN. Our results yield , at lest one order of magnitude lower than that in IRC+10216 (catalog ), confirming the destruction caused by UV photons. The time-dependent chemical model of Ali et al. (2001) predicts that the HC3N abundance gradually decreases with the evolution of PNs. Their model predicted that NGC 6781 (catalog ), a more evolved PN, has a ratio of , which is three orders of magnitudes lower than that in NGC 7027 (catalog ). The higher abundance of HC3N derived here may be the result of the presence of dense clumps within the nebula, which serve to shield the molecules from the UV radiation from the central star.
5.1.4 C2H
The C2H abundance in NGC 7027 (catalog ) is about a factor of 50 lower than that in IRC+10216 (catalog ). Based on a comparison between the observation and the model prediction of Hasegawa et al. (2000), Hasegawa & Kwok (2001) concluded that C2H is newly produced via the photodissociation of C2H2 instead of being left over from AGB phase. The C2H abundance derived in the present study is in good agreement with the value given by their observation and model.
5.1.5 C3H2
The C3H2 abundance in NGC 7027 (catalog ) is at least a factor of 4 lower than that in IRC+10216 (catalog ). Albeit with a low abundance, the large dipole moment makes C3H2 detectable. Although our detection of C3H2 is uncertain, the observation of Cox et al. (1987) showed the presence of this species. The abundance of C3H2 was not predicted by the model of Hasegawa et al. (2000). There is no path for the formation of C3H2 in PNs, and thus it may be a remnant from AGB envelope. Based on the observation of molecular clouds, Turner (1991) found that C3H2 avoids the hot environment and favors the cool clouds. Consequently, to explain its survival from the dissociation of strong UV radiation field in NGC 7027 (catalog ), we infer that C3H2 may arise from some cool high-density clumps.
5.1.6 HCO+ and N2H+
HCO+ and N2H+ can be formed through reactions,
| (12) |
and
| (13) |
which are expected to have a similar rate coefficient. Both HCO+ and N2H+ can be destroyed by dissociative electron recombination. Therefore, if reactions (12) and (13) dominate the production of HCO+ and N2H+, we have the abundance ratio . However, HCO+ can be produced through additional processes, such as
| (14) |
while N2H+ has no alternative formation channel and can be destroyed at high density by proton transfer reaction with CO,
| (15) |
As a result, the ratio is expected to be larger than the CO/N2 ratio.
The observations of HCO+ and N2H+ allow us to test these ion-molecule reactions in NGC 7027 (catalog ). Assuming that the N2/H2 abundance ratio is equal to N/H (1.4, Zhang et al., 2005) and , we have . On the other hand, our observations yield , higher than the CO/N2 abundance ratio by a factor of 2. Hence, additional formation processes for HCO+ may be significant.
The N2H+ abundance in NGC 7027 (catalog ) is abnormally high, with an observed column density 7–8 orders of magnitude higher than predicted by the model of Hasegawa et al. (2000). The species, however, has not been detected in more evolved PNs (Bachiller et al., 1997). Since reaction (13) is the unique path for the production of N2H+, the high N2H+ abundance therefore implies a high formation rate of H. H can be produced through ionization of H2 by cosmic ray or soft X-ray emission from the central star. Since strong X-ray emission from NGC 7027 (catalog ) has been detected (Kastner et al., 2001), it is possible that X-ray emission may play an key role in the formation of N2H+ in NGC 7027 (catalog ). This is consistent with the fact that more evolved PNs generally have weaker X-ray emission and have no N2H+ emission. If high N2H+ abundance is a property of young PNs, further observations of N2H+ in a sample of young PNs would be useful.
Although N2D+ has been extensively observed in dark clouds, we are unable to detect it in NGC 7027 (catalog ). From the 3 intensity upper limit of the N2D+(1–0) transition, we estimate that NGC 7027 (catalog ) has a fractionation ratio . The lower fractionation ratio in NGC 7027 (catalog ) compared to that found in dark clouds (Daniel et al., 2007) can be attributed to different physical environments.
HCO+ in NGC 7027 (catalog ) has a similarly high abundance with that in older PNs. The HCO+/HCN abundance ratio in NGC 7027 (catalog ) is 0.5, which is in very good agreement with the average value for older PNs (Bachiller et al., 1997). The different behaviors of HCO+ and N2H+ in young and more evolved PNs suggest that reaction (12) is not the dominant process for the formation of HCO+.
5.1.7 HCS+ and CS
We obtain a column density ratio of 68, which is comparable to the ion abundance ratio of derived in the ionized regions of NGC 7027 (catalog ) (Zhang et al., 2005). Hence, the formation rate of HCS+ should be similar with that of HCO+.
The estimated CS abundance is about a factor of 10 lower than the model value of 53 (Hasegawa et al., 2000). According to Herpin et al. (2002), after a star leaves the AGB strong shocks can occur and significantly affect the circumstellar chemistry. Willacy & Cherchneff (1998) suggest that shocks can destroy CS and HCN in circumstellar envelopes, which might imply that the low CS abundance observed in NGC 7027 (catalog ) is due to the presence of shocks.
5.2 Isotopic ratios
5.2.1 Carbon
The determination of isotopic abundances plays an important role in our understanding of nucleosynthesis in evolved stars. Extensive studies have shown that the 12C/13C abundance ratios in red giant stars are considerably lower than the prediction made by standard stellar evolution models (e.g. Charbonnel & do Nascimento, 1998). An extra mixing mechanism, called cool bottom processing (CBP), was introduced to explain the low 12C/13C ratio (Sackmann & Boothroyd, 1999; Boothroyd & Sackmann, 1999). For the stars with masses in the range , the hot bottom burning (HBB) may occur during the AGB stage and induce 12C/13C to further decrease to (Frost et al., 1998). A few studies have been made to study 12C/13C in molecular envelope of PNs (e.g. Palla et al., 2000; Balser et al., 2002) and lend support to the existence of CBP.
Three 13C-bearing molecular species, 13CO, H13CN, and H13CO+, have been detected in our observations, allowing us to estimate the 12C/13C ratio. The integrated intensity ratio of the CO(2–1) and 13CO(2–1) is 25, yielding an abundance ratio of . Varying values of the 12CO/13CO ratio in NGC 7027 (catalog ) have been reported in the literature. Knapp & Chang (1985) obtained . Sopka et al. (1989) did not detect the 13CO emission in NGC 7027 (catalog ) and estimated 12CO/13CO to be larger than 100. Kahane et al. (1992), Bachiller et al. (1997), and Josselin & Bachiller (2003) got a lower limit of 65, 25, and 11, respectively. More recently, Balser et al. (2002) obtained that , about half of our determination.
The HCN/H13CN abundance ratio is 19, similar to the (HCN(3–2))/(H13CN(3–2)) integrated intensity ratio of 15. The value may bear a larger error due to the weakness of the H13CN(3–2) transition. This is for the first time that the isotopomer ratio of this species in NGC 7027 (catalog ) is obtained. The value is a factor of lower than the 12CO/13CO ratio. The higher 12CO/13CO ratio suggests that 13CO might be partly affected by selective photodissociation of the UV radiation field, as proposed by Knapp & Chang (1985). Since both the CO and HCN lines are likely to be optically thick, the above values may represent lower limits. If the 12C/13C ratio is indeed as low as suggested above, this may imply a non-standard mixing process such as CBP.
Alternatively, the HCO+/H13CO+ ratio can be used. The HCO+ lines are weaker but are definitely optically thin. We used the HCO+(1–0) line at 89.188 GHz and the H13CO+ (3–2) line at 260.255 GHz since the H13CO+(1–0) transition at 88.632 GHz falsl within a spectral region which has a poor signal-to-noise ratio and the HCO+(3–2) emission at 267.558 GHz falls out of our frequency ranges. Our calculations yield a rather high HCO+/H13CO+ abundance ratio of 117 (see Table 5). If the HCO+ (1–0) transition is optical thick, the value is even higher. On the other hand, based on the upper limit of the integrated intensity of the H13CO+(1–0) line, we estimate that . The HCO+/H13CO+ ratio derived in the present study is higher than the value of 40 given by Hasegawa & Kwok (2001). The abnormal carbon isotopic ratio derived from HCO+ probably suggests that chemical fractionation is significant for this species.
5.2.2 Oxygen
During the AGB stage, the nucleosynthesis and dredge-up processes cause destruction of 18O and enhancement of 17O at the the surface of evolved stars (see Busso, 2006, for a recent review). Knapp & Chang (1985) detected the oxygen isotopic ratio for a sample of carbon-rich circumstellar envelopes and found the range of 300–800 and 300–1300 for 16O/17O and 16O/18O, respectively. Based on the fact that the 17O/18O ratios in carbon-rich envelopes are higher than that in the interstellar medium by a factor of 4–5, they ruled out AGB stars as the dominant source of oxygen in the interstellar medium.
From the detection of CO, C17O, and C18O emission in NGC 7027 (catalog ), we obtain the oxygen isotopic ratios , , and . Our results are consistent with the ratios (or the lower limits) derived by Knapp & Chang (1985) in NGC 7027 (catalog ). Compared with the oxygen isotopic ratios in the Sun ( , , and , Lodders, 2003), NGC 7027 (catalog ) clearly shows enhancement of 17O and destruction of 18O. which well agrees with the predictions of stellar models.
5.3 Hydrogen and helium recombination lines
A total of over 30 H and He recombination lines are detected in our observations. These include nine H lines, nine H lines, and probably six H lines and eight He lines. The linewidths and integrated intensities of these lines are listed in Table 4.
Due to optical depth effects, the line widths and radial velocities of recombination lines at different frequencies may be different (Ershov & Berulis, 1989). The high frequency emission has negligible optical depth, and is likely to be emitted from the whole ionized region. The low frequency emission, however, is more likely to be optically thick and if so will be emitted from the outer regions. Our data do not show any clear correlation between the line frequencies and the line widths and velocities, suggesting that these recombination lines are optically thin. From profile fittings, we determine the averaged line widths () for H, H and He lines to be km s-1, km s-1, and km s-1, respectively. No systematic difference is found for the widths of hydrogen lines and the helium lines. The H lines detected here are a factor of about 1.6 narrower than the low frequency H110 line detected by Chaisson & Malkan (1976), which is expected to be optical thick. The observed widths of hydrogen radio recombination lines can be interpreted by the model of Ershov & Berulis (1989) (cf. their Fig.2c).
The relative intensities of observed H lines as a function of their quantum numbers are plotted in Fig. 8. In this plot, we have corrected for the effect of beam dilution and translated the intensity unit into Jy. The low frequency lines H76 and H110 reported by Chaisson & Malkan (1976) are also plotted in this figure. We have normalized the intensities of the H76 and H110 lines to by assuming that they have the same beam-filling factor, which may introduce an error less than a factor of 5. For comparison, we plot the theoretical predictions of Storey & Hummer (1995) under the assumption of Case B with several combinations of electron temperatures and densities. Note that Storey & Hummer (1995) only gives the line emissivities for and the predictions for in Fig. 8 are linear extrapolations of their results. If a correction for continuum free-free opacity is applied, the predicted lines would have a larger slope than those shown in Fig. 8. An inspection of Fig. 8 shows that the intensities of the high-frequency H lines ( GHz) are consistent with the theory of recombination and are not affected by free-free opacity. The fact that the high frequency H lines are weaker than the theoretical predictions may suggest that they are optically thick.
H and H radio recombination lines were also detected in molecular clouds (e.g. Turner, 1991; Nummelin et al., 2000), allowing us to make a comparison study. The averaged main-beam temperatures for H lines and H lines determined from our observations are K and K, respectively. The corresponding ratio in NGC 7027 (catalog ) is 3.3, which is in good agreement with that found in two molecular clouds OMC-1 (catalog ) and Sgr B2 (catalog ) (Turner, 1991). According to Turner (1991), stimulated emission must be significant in order to explain such a ratio. The observed value in NGC 7027 (catalog ) is lower than that in OMC-1 (catalog ) by a factor of ten, which can be attributed to the smaller size ( pc) of this PN. Following the calculations of Turner (1991), NGC 7027 (catalog ) has an emission measure cm-6 pc.
Thum et al. (1998) studied the radio recombination lines of hydrogen in the emission-line star MWC 349 (catalog ) and found that the amplification factor of the recombination line maser has a peak value near . Fig. 8 compares hydrogen recombination lines in MWC 349 (catalog ) and those in NGC 7027 (catalog ). We can clearly see that for MWC 349 (catalog ), the intensities of the H lines near are consistently higher than the theoretical predictions, which has been attributed to the broadband maser phenomenon (Thum et al., 1998). The trend is not found in NGC 7027 (catalog ). From the ratio, we find stimulated emission to be significant for the hydrogen radio recombination in NGC 7027 (catalog ) and infer that all the H lines observed in the present work have a similar amplification factor. NGC 7027 (catalog ) has a density of cm-3, about a factor of lower than that of MWC 349 (catalog ). Consequently, according to the model of Thum et al. (1998), the quantum number of the peak amplification () in NGC 7027 (catalog ) is larger than that in MWC 349 (catalog ). Since in MWC 349 (catalog ), a similar amplification factor for the H would imply that is in the range between 34–45 in NGC 7027 (catalog ).
The hydrogen and helium radio recombination lines can also be used to calculate the He+/H+ abundance ratio. Palmer et al. (1969) deduced the He/H abundance ratio from radio recombination for a sample of H II regions and found that the results are in good agreement with those derived from optical data. Following Palmer et al. (1969) and assuming that the ratio of the integrated intensity of the He line to that of the H represents the He+/H+ abundance ratio, we obtain (He+)/(H+). An additional error is given by uncertainties in the measurements. The derived He+/H+ abundance ratio is about a factor of two higher than that determined from the optical spectra (Zhang et al., 2005). A possible explanation is that the He+ zone is more extended than the H+ zone so that the effect of beam dilution is more severe for the H I radio recombination lines. To account for the discrepancy between the abundance derived from the radio data and that from the optical data, the size of the He+ zone may be larger than the H+ zone by a factor of about 1.3. This is possible if the ionization spectrum is hard enough and more UV photons have an energy close to the ionization potential of helium. In that case, the He2+ zone is expected to be large in the high excitation PNs. However, the He II radio recombination lines are below our detection limit, and thus we have not attempted to calculate the elemental abundance ratio of helium to hydrogen.
5.4 Line profiles
Fig. 5 and Fig. 6 present the line profiles detected with the ARO 12m telescope and the SMT 10m telescope, respectively. The HCO+ line exhibits a self-absorption feature at km/s, in accord with the observations of HCO+ line by Deguchi et al. (1990). We also find a weak absorption for the HCN lines at km/s.
Table. 1 gives the of detected molecular lines. The emission lines from CO and its isotopomers have a width between 23–30 km/s. Hasegawa & Kwok (2001) found that the HCN, CN, and C2H have larger line widths than that of the CO emission, even after taking into account the effects of hyperfine components. Their findings are confirmed by our observations. One possible explanation for the larger linewidths is that these molecular lines contain components arising from fast-moving clumps within the neutral envelope of NGC 7027 (catalog ) (Redman et al., 2003; Huggins & Mauron, 2002). The CO emission originates in a much more extended region compared to other molecular species, and thus is less affected by the contribution from the fast components. The present observations show that the lines from HCO+ and N2H+ are consistently narrower than that from CO. We therefore infer that the fast clumps might be neutral and have no contribution to the emission from the molecular ions. The molecular ions mostly originate from the PDR, which has a lower expansion velocity. Further observations of lines from molecular ions are required to verify this point. Fig. 5 and Fig. 6 show that the recombination lines are generally broadener than CO lines, suggesting that the acceleration by the UV radiation field is significant in the ionized regions of NGC 7027 (catalog ).
5.5 Comparison with the spectra of IRC+10216 and CRL 618
Comparison with the spectra of AGB stars, PPNs, and PNs can provide essential information of chemical evolution in late-type stars. Recent molecular line surveys of IRC+10216 (catalog ) and CRL 618 (catalog ) were presented by Cernicharo et al. (2000) and Pardo et al. (2007), respectively. The frequency ranges are 129–172.5 GHz for IRC+10216 (catalog ), and 80.25–115.75 GHz, 131.25–179.25 GHz, and 204.25–275.25 GHz for CRL 618 (catalog ). Since these spectra were obtained using different instruments, it is hard to make a quantitative comparison with our observation of NGC 7027 (catalog ). Through a qualitative comparison, we summarize the main differences between the spectra of the three objects as follows:
-
1.
The molecular lines detected in NGC 7027 (catalog ) are much fewer and generally fainter than those in IRC+10216 (catalog ) and CRL 618 (catalog ), even after the correction of the relative distances of the three objects. This can be attributed to a) the low density in the neutral envelope of NGC 7027 (catalog ), which makes it harder to collisionally excite the higher rotational levels of most molecules (Thronson & Bally, 1986), and b) destruction of molecules caused by the strong UV radiation and shock waves in NGC 7027 (catalog ).
-
2.
Refractory Metal-bearing and silicon-bearing species which are plentifully present in IRC+10216 (catalog ) have only week emission in CRL 618 (catalog ) and are not detected in NGC 7027 (catalog ). These molecules may be depleted onto dust grains with stellar evolution.
-
3.
The CS emission is strong in IRC+10216 (catalog ), medium in CRL 618 (catalog ), and not seen in NGC 7027 (catalog ). This might suggest that shock waves play an important role in the chemistry of NGC 7027 (catalog ).
-
4.
Ionized species (HCO+, HCS+, and N2H+) and recombination lines detected in CRL 618 (catalog ) and NGC 7027 (catalog ) are not seen in the spectra of IRC+10216 (catalog ). This is due to photoionization by the hotter central stars of CRL 618 (catalog ) and NGC 7027 (catalog ).
-
5.
The N2H+/HCO+ abundance ratio in NGC 7027 (catalog ) is about a factor of 30 higher than that in CRL 618 (catalog ), supporting the hypothesis that H is dominantly produced by soft X-ray from the central star.
The comparison between the spectra of CRL 618 (catalog ) and NGC 7027 (catalog ) is particularly meaningful because the former is a much evolved PPN and will evolve to become a young PN like NGC 7027 (catalog ) after only a few hundred years. From the above comparison, we can conclude that the chemical compositions can dramatically change after the PPN stage.
6 Summary
In this spectral-line survey of the PN NGC 7027 (catalog ), we have detected a total of 67 spectral lines consisting of 21 molecular lines, 32 hydrogen and helium recombination lines, and 14 unidentified line. The line intensities were used to calculate excitation temperatures, column densities, and fractional abundances of the observed molecular species. The main findings are summarized as follows:
-
1.
The low CN/HCN ratio seems to go against the theoretical expected photodissociation of HCN into CN in a strong UV environment. This could imply that the photodissociation process might be compensated by the unexpectedly efficient reaction between CN and H2. Alternatively, a large amount of HNC may have been transferred into HCN in the hot envelope of NGC 7027 (catalog ).
-
2.
From the HCO+/N2H+ abundance ratio, we suggest that the reaction of CO+ and H2 may be important for the production of HCO+. The soft X-ray emission from the central star play to important role for the production of N2H+ in NGC 7027 (catalog ).
-
3.
We find evidence for underabundance of CS, suggesting that the species may have been destroyed by shocks in the young PN.
-
4.
Although the estimated CO/13CO, HCN/H13CN, and HCO+/13CO+ ratios are different, the resulting low 12C/13C ratio supports the presence of extra mixing process in AGB stage. The oxygen isotopomer ratios is consistent with the predictions of stellar models.
-
5.
The intensities of hydrogen recombination lines suggest that stimulated excitation may be significant. Our estimates of He+/H+ abundance ratio from the ratio recombination lines is higher than that from the optical lines. The discrepancy can be explained if the He+ zone is more extended that the H+ zone in the young PN.
-
6.
The different widths of lines from CO, other neutral molecules, molecular ions, and hydrogen and helium can be used as dynamical probes of the circumstellar envelope of NGC 7027 (catalog ). Our results suggest the presence of fast neutral clumps within the molecular envelope of NGC 7027 (catalog ).
These observations show that the circumstellar envelope of NGC 7027 (catalog ) can serve as a very useful chemical laboratory. Comparison with existing theoretical chemical models suggests that a more comprehensive model is required to explain the observed molecular abundances, in particular for the production of N2H+, the destruction of CS, and the survival of HC3N and C3H2 in the PN. A more comprehensive model will need to include effects of soft X-ray emission from the central star, shocks, and dense clumps.
Changing physical conditions are the main factor for the different molecular abundances in the circumstellar envelopes of stars at different evolutionary stages. The observational results reported in the present paper provide a foundation for further studies of circumstellar chemistry. In this spectral survey program, we also obtained radio spectra of two AGB stars, IRC+10216 (catalog ) and CIT 6 (catalog ), and one proto-PN, CRL 2688 (catalog ), in addition to the PN NGC 7027 (catalog ). A systematic comparison of the chemical compositions in different evolutionary stages will be presented in a forthcoming paper.
References
- Ali et al. (2001) Ali, A., Shalabiea, O. M., El-Nawawy, M. S., & Millar, T. J. 2001, MNRAS, 325, 881
- Bachiller et al. (1997) Bachiller, R., Forveille, T., Huggins, P. J., , & Cox, P. 1997, A&A, 324, 1123
- Balser et al. (2002) Balser, D. S., McMullin, J. P., & Wilson, T. L. 2002, ApJ, 572, 326
- Boothroyd & Sackmann (1999) Boothroyd, A. I., & Sackmann, I.-J. 1999, ApJ, 510, 232
- Busso (2006) Busso, M. M. 2006, in IAU Symp. 234 Planetary Nebulae, eds. M. J. Barlow, & R. H. Méndez (Cambridge: Cambridge University Press), P.91
- Cernicharo et al. (2000) Cernicharo, J., Guélin, M., & Kahane, C. 2000, A&AS, 142, 181
- Cernicharo et al. (2001a) Cernicharo, J., Heras, A. M., Pardo, J. R., Tielens, A. G. G. M., Guélin, M., Dartois, E., Neri, R., Waters, L. B. F. M. 2001a, ApJ, 546, L127
- Cernicharo et al. (2001b) Cernicharo, J., Heras, A. M., Tielens, A. G. G. M., Pardo, J. R., Herpin, F.; Guélin, M., Waters, L. B. F. M. 2001b, ApJ, 546, L123
- Chaisson & Malkan (1976) Chaisson, E. J., & Malkan, A. M. 1976, ApJ, 210, 108
- Charbonnel & do Nascimento (1998) Charbonnel, C., & do Nascimento, J. D. 1998, A&A, 336, 915
- Cox et al. (1987) Cox, P., Gusten, R., & Henkel, C. 1987, A&A, 181, L19
- Cox et al. (1993) Cox, P., Bachiller, R., Huggins, P. J., Omont, A., & Guilloteau, S. 1993, in IAU Symp. 155, Planetary Nebulae, ed. R. Weinberger & A. Acker (Dordrecht: Kluwer), p.227
- Daniel et al. (2007) Daniel, F., Cernicharo, J., Roueff, E., Gerin, M., & Dubernet, M. L. 2007, ApJ, 667, 980
- Deguchi et al. (1986) Deguchi, S., Claussen, M. J., & Goldsmith, P. F. 1986, ApJ, 303, 810
- Deguchi et al. (1990) Deguchi, S., Izumiura, H., Kaifu, N., Mao, X., Nguyen-Q-Rieu, & Ukita, N. 1990, ApJ, 351, 522
- Ershov & Berulis (1989) Ershov, A. A., & Berulis, I. I. 1989, PAZh, 15, 413
- Frost et al. (1998) Frost, C. A., Cannon, R. C., Lattanzio, J. C., Wood, P. R., & Forestini, M. 1998, A&A, 332, L17
- Hasegawa et al. (2000) Hasegawa, T. I., Volk, K., & Kwok, S. 2000, ApJ, 532, 994
- Hasegawa & Kwok (2001) Hasegawa, T. I., & Kwok, S. 2001, ApJ, 562, 824
- Herpin et al. (2002) Herpin, F., Goicoechea, J. R., & Cernicharo, J. 2002, ApJ, 577, 961
- Huggins & Mauron (2002) Huggins, P. J., & Mauron, N. 2002, A&A, 393, 273
- Josselin & Bachiller (2003) Josselin, E., & Bachiller, R. 2003, A&A, 397, 659
- Kahane et al. (1992) Kahane, C., Cernicharo, J., Gómez-González, J., & Guélin, M. 1992, A&A, 256, 235
- Kastner et al. (2001) Kastner, J. H., Vrtilek, S. D., & Soker, N. 2001, ApJ, 550,189
- Knapp & Chang (1985) Knapp, G. R., & Chang, K. M. 1985, ApJ, 293, 281
- Kwok (2004) Kwok, S. 2004, Nature, 430, 985
- Lilley & Palmer (1968) Lilley, A, E., & Palmer, P. 1968, ApJS, 16, 143
- Liu et al. (1996) Liu, X.-W., Barlow, M. J., Nguyen-Q-Rieu, et al. 1996, A&A, 315, L257
- Lodders (2003) Lodders, K. 2003, ApJ, 591, 1220
- Masson (1989) Masson, C. R. 1989, ApJ, 336, 294
- Masson et al. (1985) Masson, C. R., Cheung, K. W., Berge, G. L. et al. 1985, ApJ, 292, 464
- Müller et al. (2001) Müller, H. S. P., Thorwirth, S., Roth, D. A., & Winnewisser, G., 2001, A&A, 370, L49
- Müller et al. (2005) Müller, H. S. P., Schlöder, F., Stutzki, J., & Winnewisser, G., 2005, J. Mol. Struct. 742, 215
- Nummelin et al. (1998) Nummelin, A., Bergman, P., Hjalmarson, Å et al. 1998, ApJS, 117, 427
- Nummelin et al. (2000) Nummelin, A., Bergman, P., Hjalmarson, Å et al. 2000, ApJS, 128, 213
- Olofsson (1996) Olofsson, H. 1996, in IAU Symp. 178, Molecules in Astrophysics: Probes & Processes, ed. E. van Dishoeck (Dordrecht: Kluwer), 457
- Olofsson (1997) Oloffson, H. 1997, Astrophys. Sp. Sci., 251, 31
- Palla et al. (2000) Palla, F., Bachiller, R., Stanghellini, L., Tosi, M., & Galli, D. 2000, A&A, 355, 69
- Palmer et al. (1969) Palmer, P., Zuckerman, B., Penfield, H. & Lilley, A. E. 1969, ApJ, 156, 887
- Pardo et al. (2004) Pardo, J. R., Cernicharo, J., Goicoechea, J. R., & Phillips, T. G. 2004, ApJ, 615, 495
- Pardo et al. (2005) Pardo, J. R., Cernicharo, J., & Goicoechea, J. R. 2005, ApJ, 628, 275
- Pardo & Cernicharo (2007) Pardo, J. R., & Cernicharo, J. 2007, ApJ, 654, 978
- Pardo et al. (2007) Pardo, J. R., Cernicharo, J., Goicoechea, J. R., Gu’elin, M., & Ramos, A. A. 2007, ApJ, 661, 250
- Pickett et al. (1998) Pickett, H. M., Poynter, R. L., Cohen, E. A., Delitsky, M. L., Pearson, J. C., & Muller, H. S. P., 1998, J. Quant. Spectrosc. & Rad. Transfer, 60, 883
- Redman et al. (2003) Redman, M. P., Viti, S., Cau, P., & Williams, D. A. 2003, MNRAS, 345, 1291
- Roelfsema et al. (1991) Roelfsema, P. R., Goss, W. M., Zijlstra, A., & Pottasch, S. R. 1991, A&A, 251, 611
- Sackmann & Boothroyd (1999) Sackmann, I.-J., & Boothroyd, A. I. 1999, ApJ, 510, 217
- Sopka et al. (1989) Sopka, R. J., Olofsson, H., Johansson, L. E. B., Nguyen-Q-Rieu, Zuckerman, B. 1989, A&A, 210, 78
- Storey & Hummer (1995) Storey, P. J., & Hummer, D. 1995, MNRAS, 272, 41
- Thronson & Bally (1986) Thronson, H. A., & Bally, J. 1986, ApJ, 300, 749
- Towle et al. (1996) Towle, J. P., Feldman, P. A., & Watson, J. K. G. 1996, ApJS, 107, 747
- Thum et al. (1998) Thum, C., Marín-Pintado, J. Quirrenbach, A., & Matthews, H. E. 1998, A&A, 333, L63
- Turner (1989) Turner, B. E. 1989, ApJS, 70, 539
- Turner (1991) Turner, B. E. 1991, ApJS, 76, 617
- Willacy & Cherchneff (1998) Willacy, K., & Cherchneff, I. 1998, A&A, 330, 676
- Winters et al. (2002) Winters, J. M., Le Bertre, T., Nyman, L.-Å, Omont, A., & Jeong, K. S. 2002, A&A388, 609
- Woods et al. (2003) Woods, P. M., Schöier, F. L., Nyman, L.-Å, & Olofsson, H. 2003, A&A, 402, 617
- Yan et al. (1999) Yan, M., Federman, S. R., Dalgarno, A., & Bjorkman, J. E. 1999, ApJ, 515, 640
- Zhang et al. (2005) Zhang, Y., Liu, X.-W., Luo, S.-G., Péquignot, D., & Barlow, M. J. 2005, A&A, 442, 249
- Ziurys et al. (2007) Ziurys, L. M., Milam, S. N., Apponi, A. J., Woolf, N. J. 2007, Nature, 447, 1094
| Species | Transition | Frequency | d | Remarksb | |||
|---|---|---|---|---|---|---|---|
| (upper–lower) | (GHz) | (mK) | (K) | (K km/s) | (km/s) | ||
| CO | 2–1 | 230.538 | 3.0 | 5.824 | 141.97 | 24.2 | H01,T86,B97 |
| 13CO | 1–0 | 110.201 | 3.3 | 0.069 | 1.95 | 27.5 | S89,B97 |
| 2–1 | 220.398 | 3.7 | 0.204 | 5.72 | 29.1 | H01,J03,B97 | |
| C18O | 2–1 | 219.560 | 3.6 | 0.020 | 0.41 | 23.3 | |
| C17O | 2–1 | 224.714 | 4.3 | 0.032 | 0.86 | 25.4 | |
| CN | 2–1,3/2–3/2 | 226.314 | 3.9 | 0.028 | 1.79 | *,C93,J03,B97 | |
| 2–1,3/2–1/2 | 226.659 | 3.9 | 0.091 | 4.95 | 44.5 | *,C93,J03,B97 | |
| 2–1,5/2–3/2 | 226.874 | 3.9 | 0.197 | 7.76 | 36.5 | *,C93,J03,B97 | |
| 2–1,5/2–1/2 | 227.192 | 3.3 | 0.008: | 0.26:c | |||
| C2H | 3–2,7/2–5/2 | 262.004 | 5.5 | 0.041 | 2.01 | 94.1 | *,H01 |
| 3–2,5/2–3/2 | 262.067 | 5.5 | 0.033 | 1.74 | 96.7 | *,H01 | |
| C3H2 | 432–321 | 227.169 | 3.3 | 0.008: | 0.26:c | ||
| 625–514 | 251.527 | 4.0 | 0.010: | 0.19: | |||
| 533–422 | 254.988 | 4.1 | 0.012: | 0.20: | |||
| HCN | 1–0 | 88.632 | 3.8 | 0.059 | 1.94 | 36.6 | D86,D90,S89,C93,J03,B97 |
| 3–2 | 265.886 | 5.5 | 0.207 | 8.22 | 56.6 | H01,C93 | |
| H13CN | 1–0 | 86.339 | 3.5 | 0.009: | 0.28: | ||
| 3–2 | 259.012 | 4.3 | 0.013 | 0.56 | 64.9: | ||
| HCO+ | 1–0 | 89.188 | 3.7 | 0.247 | 5.39 | 19.2 | S89,D90,C93,J03,B97 |
| H13CO+ | 3–2 | 260.255 | 4.1 | 0.017 | 0.27 | 16.1 | H01 |
| HC17O+ | 1–0 | 87.057 | 3.4 | 0.008: | 0.21: | ||
| HC18O+ | 1–0 | 85.162 | 7.4 | 0.015: | 0.30: | ||
| HCS+ | 6–5 | 256.028 | 4.0 | 0.014 | 0.25 | 17.0: | H01 |
| HC3N | 8–7 | 72.783 | 3.6 | 0.014 | 0.34 | ||
| 9–8 | 81.881 | 3.6 | 0.015 | 0.31 | |||
| 10–9 | 90.979 | 3.1 | 0.008: | 0.16: | |||
| 11–10 | 100.076 | 2.9 | 0.011 | 0.22 | |||
| 12–11 | 109.174 | 2.8 | 0.004: | 0.12: | |||
| 26–25 | 236.513 | 3.4 | 0.004: | 0.11: | |||
| 27–26 | 245.606 | 2.7 | 0.014 | 0.23 | |||
| 28–27 | 254.700 | 4.1 | 0.011: | 0.13: | |||
| N2H+ | 1–0 | 93.173 | 2.6 | 0.017 | 0.35 | 19.7 | C93,J03 |
| Frequency | d | ||
|---|---|---|---|
| (GHz) | (mK) | (K) | (K km/s) |
| 74.739 | 3.8 | 0.012 | 0.63 |
| 89.656a | 3.6 | 0.012 | 0.26 |
| 90.739a | 3.1 | 0.013 | 0.23 |
| 95.246 | 3.2 | 0.011 | 0.47 |
| 96.236a | 5.3 | 0.019 | 0.35 |
| 98.079 | 2.9 | 0.010 | 0.20 |
| 102.789 | 3.3 | 0.013 | 0.29 |
| 107.802 | 2.8 | 0.012 | 0.37 |
| 229.256b | 3.7 | 0.015 | 0.22 |
| 257.637b | 4.8 | 0.015 | 0.25 |
| 261.569b | 5.5 | 0.020 | 0.28 |
| 261.820 | 5.5 | 0.019 | 0.36 |
| 263.369b | 5.0 | 0.017 | 0.26 |
| 264.744 | 5.2 | 0.019 | 0.36 |
| Species | Transition | Frequency | (cm-2) | (obs.)/ | ||
|---|---|---|---|---|---|---|
| (upper–lower) | (GHz) | (mK) | obs.a | modelb | (model)a | |
| CS | =0 J=5–4 | 244.936 | 2.7 | 1.9e12 | 2.5e13 | 0.08 |
| C3H | J=23/2–21/2 b | 263.332 | 4.9 | 1.1e13 | … | … |
| C4H | N=24–23 a | 228.349 | 2.9 | 1.7e13 | 1.4e11 | 121 |
| SiC | J=6–5 | 236.288 | 3.5 | 7.5e12 | 2.6e12 | 2.9 |
| SiO | =0 J=6–5 | 260.518 | 5.2 | 1.0e13 | 1.5e13 | 0.7 |
| SiS | =0 J=14–13 | 254.103 | 3.7 | 8.9e13 | … | … |
| HNC | J=1–0 | 90.664 | 3.4 | 1.4e12 | … | … |
| HC5N | J=27–26 | 71.890 | 3.6 | 1.5e12 | … | … |
| CH3CN | JK=5(1)–4(1),5(0)–4(0) | 91.986 | 2.4 | 2.3e13 | … | … |
| H2CO | 3(1,2)-2(1,1) | 225.678 | 3.9 | 4.5e12 | 9.2e9 | 489 |
| N2D+ | J=1–0 | 77.109 | 4.1 | 2.8e12 | … | … |
| Line | Frequency | d | ||
|---|---|---|---|---|
| (GHz) | (K) | (K km/s) | (km/s) | |
| H44 | 74.645 | 0.045 | 2.01 | 46.6 |
| H43 | 79.913 | 0.037 | 1.77 | 52.5 |
| H42 | 85.688 | 0.037 | 1.68 | 35.3 |
| H41 | 92.034 | 0.054 | 2.39 | 41.2 |
| H40 | 99.022 | 0.051 | 2.19 | 43.5 |
| H39 | 106.737 | 0.049 | 2.47 | 49.4 |
| H34 | 160.212 | 0.048 | 2.77 | 40.6 |
| H30 | 231.901 | 0.037 | 1.88 | 46.2 |
| H29 | 256.302 | 0.053 | 2.46 | 44.3 |
| H55 | 74.940 | 0.013 | 0.46 | 52.9 |
| H54 | 79.104 | 0.025 | 0.68 | 35.7 |
| H53 | 83.582 | 0.011 | 0.41 | 48.5 |
| H52 | 88.406 | 0.016 | 0.60 | 60.1 |
| H51 | 93.607 | 0.010 | 0.40 | 64.5 |
| H50 | 99.225 | 0.013 | 0.53 | 49.8 |
| H49 | 105.302 | 0.012 | 0.57 | 65.5 |
| H37 | 240.021 | 0.013 | 0.54 | 57.5 |
| H36 | 260.033 | 0.011 | 0.42 | 92.1: |
| H61 | 80.900 | 0.012 | 0.48 | 50.6 |
| H60 | 84.914 | 0.024 | 0.29: | 17.8: |
| H58 | 93.776 | 0.009 | 0.28 | 64.1 |
| H57 | 98.671 | 0.006 | 0.16: | 31.0: |
| H56 | 103.915 | 0.009 | 0.22: | 35.5: |
| H55 | 109.536 | 0.008 | 0.25 | 35.1 |
| He44 | 74.674 | 0.009 | 0.21 | 40.2 |
| He43 | 79.945 | 0.012 | 0.17: | 33.3: |
| He42 | 85.723 | 0.023 | 0.37: | 36.3: |
| He41 | 92.072 | 0.012 | 0.28 | 27.0 |
| He40 | 99.063 | 0.008 | 0.22 | 55.5: |
| He39 | 106.781 | 0.005 | 0.18: | 31.6: |
| He30 | 231.995 | 0.009 | 0.23 | 42.0 |
| He29 | 256.406 | 0.014 | 0.35 | 35.2 |
| Species | (K) | (cm-2) | (obs.)/ | N/(cm-2) | ||
|---|---|---|---|---|---|---|
| obs. | modela | (model) | ||||
| HC3N | 34.6 | 4.39e13 | … | … | 8.5e-9 | 5.2e21 |
| CN | 1.02e14 | 2.4e14 | 0.43 | 7.0e-8 | 1.5e21 | |
| C2H | 3.49e14 | 1.5e14 | 2.33 | 5.4e-8 | 6.5e21 | |
| C3H2 | 1.11e14: | … | … | 8.3e-9: | 1.3e22: | |
| HCS+ | 4.96e12 | 9.0e11 | 5.51 | 1.0e-9 | 5.0e21 | |
| N2H+ | 2.43e13 | 3.2e5 | 7.59e7 | 3.8e-9 | 6.4e21 | |
| HCO+ | 3.38e14 | 4.6e13 | 7.35 | 4.8e-8 | 7.0e21 | |
| H13CO+ | 7.23e11 | … | … | 4.1e-10 | 1.8e22 | |
| HC17O+ | 2.85e13: | … | … | 2.3e-9: | 1.2e22: | |
| HC18O+ | 3.89e13: | … | … | 3.2e-9: | 1.2e22: | |
| HCN | 5.4 | 7.05e14 | 1.8e14 | 3.92 | 4.5e-8 | 1.6e22 |
| H13CN | 3.65e13 | … | … | 3.9e-9 | 9.4e21 | |
| CO | 40.1 | 3.79e18 | 3.2e20 | 0.01 | 1.1e-4 | 3.4e22 |
| 13CO | 5.19e16 | … | … | 7.4e-6 | 7.0e21 | |
| C18O | 2.15e15 | … | … | 3.8e-7 | 5.7e21 | |
| C17O | 5.43e15 | … | … | 7.4e-7 | 7.3e21 | |
![[Uncaptioned image]](/html/0803.1624/assets/x4.png)
Fig. 3. — Continued.
![[Uncaptioned image]](/html/0803.1624/assets/x5.png)
Fig. 3. — Continued.
![[Uncaptioned image]](/html/0803.1624/assets/x6.png)
Fig. 3. — Continued.
![[Uncaptioned image]](/html/0803.1624/assets/x7.png)
Fig. 3. — Continued.
![[Uncaptioned image]](/html/0803.1624/assets/x8.png)
Fig. 3. — Continued.
![[Uncaptioned image]](/html/0803.1624/assets/x9.png)
Fig. 3. — Continued.
![[Uncaptioned image]](/html/0803.1624/assets/x10.png)
Fig. 3. — Continued.
![[Uncaptioned image]](/html/0803.1624/assets/x11.png)
Fig. 3. — Continued.
![[Uncaptioned image]](/html/0803.1624/assets/x12.png)
Fig. 3. — Continued.
![[Uncaptioned image]](/html/0803.1624/assets/x14.png)
Fig. 4. — Continued.
![[Uncaptioned image]](/html/0803.1624/assets/x15.png)
Fig. 4. — Continued.
![[Uncaptioned image]](/html/0803.1624/assets/x16.png)
Fig. 4. — Continued.
![[Uncaptioned image]](/html/0803.1624/assets/x17.png)
Fig. 4. — Continued.
![[Uncaptioned image]](/html/0803.1624/assets/x18.png)
Fig. 4. — Continued.
![[Uncaptioned image]](/html/0803.1624/assets/x19.png)
Fig. 4. — Continued.
![[Uncaptioned image]](/html/0803.1624/assets/x20.png)
Fig. 4. — Continued.
![[Uncaptioned image]](/html/0803.1624/assets/x21.png)
Fig. 4. — Continued.
![[Uncaptioned image]](/html/0803.1624/assets/x22.png)
Fig. 4. — Continued.
![[Uncaptioned image]](/html/0803.1624/assets/x23.png)
Fig. 4. — Continued.
![[Uncaptioned image]](/html/0803.1624/assets/x24.png)
Fig. 4. — Continued.

![[Uncaptioned image]](/html/0803.1624/assets/x26.png)
Fig. 5. — Continued.
![[Uncaptioned image]](/html/0803.1624/assets/x28.png)
Fig. 6. — Continued.
![[Uncaptioned image]](/html/0803.1624/assets/x29.png)
Fig. 6. — Continued.