The origin of the infrared emission in radio galaxies I:
new mid- to far-infrared and radio observations of the 2Jy sample
Abstract
As part of a large study to investigate the nature of the longer wavelength continuum emission of radio-loud AGN, we present new mid to far-infrared (MFIR) and high frequency radio observations for a complete sample of 2Jy powerful, southern radio galaxies at intermediate redshifts (). Utilizing the sensitivity of the Spitzer Space Telescope, we have made deep MIPS observations at the wavelengths of 24, 70 and 160m, detecting 100% of our sample at 24m and 90% at 70m. This high detection rate at MFIR wavelengths is unparallelled in samples of intermediate redshift radio galaxies. Complementing these results, we also present new high frequency observations (15 to 24Ghz) from the Australia Telescope Compact Array (ATCA) and the Very Large Array (VLA), which are used to investigate the potential contamination of the MFIR continuum by non-thermal synchrotron emission. With the latter observations we detect the compact cores in 59% of our complete sample, and deduce that non-thermal contamination of the MFIR continuum is significant in a maximum of 30% of our total sample. MFIR fluxes, radio fluxes and spectral energy distributions for the complete sample are presented here, while in a second paper we will analyse these data and discuss the implications for our understanding of the heating mechanism for the warm/cool dust, star formation in the host galaxies, and the unified schemes for powerful radio sources.
1 Introduction
The mid to far-infrared (MFIR) is one of the most profitable wavelength ranges for investigating AGN and associated phenomena. This is primarily because AGN emission suffers less from effects of obscuration at these wavelengths. Moreover, the thermal infrared samples the emission that is absorbed and then re-radiated by dust, indirectly sampling the radiative power of the active core and any starburst component that may be present. Therefore this wavelength range is crucial both for testing the unified schemes for AGN (e.g. Barthel, 1989), and investigating the link between AGN and starburst activity as part of the evolution of the host galaxies (Rowan-Robinson, 1995, Haas et al., 1998, Archibald et al., 2001).
In terms of testing unified schemes, radio-loud samples of AGN have the advantage that their extended radio emission is isotropic, allowing samples to be selected free from the orientation bias that affects samples selected at X-ray, optical and near-IR wavelengths. However, in order to fully realize the potential of MFIR observations for studies of radio galaxies it is important to obtain observations of carefully selected samples that attain a high level of completeness in terms of detections. Unfortunately, observing in the MFIR is technically more challenging than at near-infrared wavelengths. Therefore, although the IRAS observatory made many significant contributions to our understanding of the MFIR infrared properties of radio-loud AGN (Neugebauer et al., 1986, Golombek et al., 1988, Knapp et al., 1990, Impey & Gregorini, 1993, Heckman et al., 1992, 1994 Hes et al., 1995), it had a relatively low sensitivity, resulting in a typical MFIR detection rate of less than 30%, even for radio galaxies in the local universe ().
Subsequent attempts were made to observe samples of radio galaxies with the ISO observatory (Haas et al., 1998, 2004, Polletta et al., 2000, van Bemmel et al., 2000, Meisenheimer et al., 2001). However, meager, sometimes heterogeneous samples, and the modest sensitivity of the observatory, only allowed for a small improvement on the achievements of IRAS. Studies of samples of radio-loud AGN with ISO have typical detection rates of no more than 50% in the far-IR, impeding attempts to understand the MFIR emission.
The launch of Spitzer in 2003, brought an opportunity to make observations with orders of magnitude improved sensitivity at MFIR wavelengths. However, published Spitzer studies of radio loud AGN are either based on heterogeneous samples (e.g. Shi et al., 2005), or on samples that are relatively faint and distant, resulting in a low detections rates at 70m (e.g. Cleary et al., 2007, Seymour et al., 2007).
A further problem is that many previous MFIR studies of radio-loud AGN samples are selected from the 3C radio catalogue, which are hampered by the lack of published high quality optical spectroscopic observations for many of the objects. In contrast, the southern 2Jy sample (Tadhunter et al., 1993) is unique in the sense that deep spectra have been published for the whole sample (Tadhunter et al., 1993, 1998, 2002; Wills et al., 2002, Holt et al., 2007). Measured emission line luminosities for this sample provide information about the intrinsic power of the AGN (Tadhunter et al., 1998). Moreover, careful modelling of the continuum spectra provides key information about the stellar populations in the host galaxies and, in particular, in the presence of young stellar populations (Tadhunter et al. 2002; Wills et al. 2004). The 2Jy sample has also been extensively observed at radio wavelengths (Morganti et al., 1993, 1997, 1999), allowing links to be made between radio and optical properties and independent estimates of the orientation of the sources to the line of sight. In view of its completeness and the availability of deep spectroscopic and radio data, which makes it well suited to investigating the nature of the MFIR emission and testing the unified schemes, we have undertaken a program of deep imaging with Spitzer/MIPS of the 2Jy sample.
Given that we are interested in the thermal emission and heating mechanism of the warm/cool dust sampled through the MFIR fluxes, possible contamination from non-thermal synchrotron sources could potentially bias our conclusion. Therefore, to complement the MFIR observations, we have also undertaken high frequency observations at radio wavelengths (15 to 22 GHz) using ATCA and the VLA, with the aim of investigating the potential degree of non-thermal contamination.
A preliminary analysis of the results from this program was presented in Tadhunter et al. (2007). Here we present the MFIR and radio core data, and discuss the potential non-thermal contamination of the MFIR continuum. A second paper comprises an in-depth analysis of these data (Dicken et al. 2008, in preparation).
2 Sample selection
The sample for this study comprises a complete sub-sample of all 46 steep-spectrum powerful radio galaxies and quasars with redshifts 0.05 z 0.7, and flux densities 2Jy from the sample of Tadhunter et al. (1993). We define the the steep spectrum selection as (), which excludes 16 objects within the redshift range. We also include PKS034705 (catalog ), which has since proved to fulfil the same selection criteria (di Serego-Alighieri et al., 1994). The lower redshift limit has been set to ensure that these galaxies are genuinely powerful sources, and the steep spectrum selection for the quasars rules out objects dominated by emission from the beamed relativistic jet and core components. Overall, the full sample of 46 objects included a mixture of broad line radio galaxies/radio loud quasars (BLRG/Q: 35%), narrow line radio galaxies (NLRG: 43%) and weak line radio galaxies (WLRG: 22%). In terms of radio morphology classification, our complete sample includes 72% FRII sources, 13% FRI sources and 15% compact steep spectrum/gigahertz peak spectrum objects.
For comparison purposes we also observed or collected data from the Spitzer/IRAS archive, for the flat spectrum, core dominated objects 3C273 (catalog ), PKS052136 (catalog ) and PKS154979 (catalog ). Note that PKS154979 (catalog ) is a particularly interesting source, because it a rare example of a powerful, flat spectrum radio source that is classified as a galaxy at optical wavelengths; the nature of this object is discussed in detail in Holt et al. (2006). However, these objects are not part of what we refer to as our complete sample. Our complete sample of 46 objects comprises the 49 objects with Spitzer or IRAS observations presented below, minus the 3 comparison flat spectrum objects.
3 MFIR observations and reduction
3.1 Observations
We have obtained new observations for 43 objects using the Spitzer Space Telescope and, for 37 of these, we have obtained the very first MFIR detections. In addition, we include results from data obtained for 5 other targets from the Spitzer archive Reserved Observations Catalogue (ROC): PKS0915-11 (catalog ) (3C218), PKS122602 (catalog ) (3C273), PKS155902 (catalog ) (3C327), PKS164805 (catalog ) (3C348) and PKS2221-02 (catalog ) (3C445). The observations were carried out between August 2005 and Jan 2007, and the ROC targets were observed between March and November 2004.
3.2 Reduction
The MIPS instrument on board Spitzer takes short exposure images in a dither pattern. These are then combined to make a final ‘mosaiked’ image. Rather than use the pipeline processed data, we have re-reduced data for all the 48 objects in the sample starting from the Basic Calibrated Data (BCD) files to produce final mosaiked images for analysis. The reduction was carried out at Rochester Institute of Technology and The University of Sheffield using the MOPEX software reduction package (Makovoz et al., 2006) provided by the Spitzer Science Center (SSC). Due to the different nature of the detectors and sensitivities at the 3 wavelengths observed, the reduction method we have selected is different for each. Thus we discuss the 3 bands separately below.
| PKS Name | Other | RA(J2000) | Dec(J2000) | Opt. Class | Rad. Class | z | Obs. Date | 24(s) | 70(s) | 160(s) |
|---|---|---|---|---|---|---|---|---|---|---|
| 002326 | 00 25 49.18 | -26 02 12.8 | NLRG | CSS | 0.322 | Dec-05 | 180.4 | 543.3 | 167.8 | |
| 003401 | 3C015 | 00 37 04.14 | -01 09 08.2 | WLRG | FRII | 0.073 | Jan-06 | 180.4 | 543.3 | 167.8 |
| 003502 | 3C17 | 00 38 20.51 | -02 07 40.1 | BLRG | (FRII) | 0.220 | Jul-06 | 180.4 | 543.3 | 167.8 |
| 003809 | 3C18 | 00 40 50.53 | +10 03 26.8 | BLRG | FRII | 0.188 | Jan-06 | 180.4 | 543.3 | 167.8 |
| 003944 | 00 42 09.03 | -44 14 01.3 | NLRG | FRII | 0.346 | Dec-05 | 180.4 | 543.3 | 167.8 | |
| 004342 | 00 46 17.75 | -42 07 51.4 | WLRG | FRII | 0.116 | Dec-05 | 180.4 | 543.3 | 167.8 | |
| 010516 | 3C32 | 01 08 16.90 | -16 04 20.6 | NLRG | FRII | 0.400 | Jul-06 | 180.4 | 543.3 | 167.8 |
| 011715 | 3C38 | 01 20 27.16 | -15 20 17.8 | NLRG | FRII | 0.565 | Jul-06 | 180.4 | 543.3 | 167.8 |
| 021313 | 3C62 | 02 15 37.50 | -12 59 30.5 | NLRG | FRII | 0.147 | Jan-07 | 180.4 | 545.3 | 167.8 |
| 023519 | OD-159 | 02 37 43.45 | -19 32 33.3 | BLRG | FRII | 0.620 | Feb-06 | 180.4 | 545.3 | 167.8 |
| 025271 | 02 52 46.26 | -71 04 35.9 | NLRG | CSS | 0.566 | Aug-05 | 180.4 | 545.3 | 167.8 | |
| 034705 | 03 49 46.50 | +05 51 42.3 | BLRG | FRII | 0.339 | Feb-06 | 180.4 | 545.3 | 167.8 | |
| 034927 | 03 51 35.81 | -27 44 33.8 | NLRG | FRII | 0.066 | Aug-05 | 180.4 | 545.3 | 167.8 | |
| 040403 | 3C105 | 04 07 16.49 | +03 42 25.8 | NLRG | FRII | 0.089 | Sep-05 | 180.4 | 545.3 | none |
| 040975 | 04 08 48.49 | -75 07 19.3 | NLRG | FRII | 0.693 | Aug-05 | 180.4 | 545.3 | 167.8 | |
| 044228 | 04 44 37.67 | -28 09 54.6 | NLRG | FRII | 0.147 | Feb-06 | 180.4 | 545.3 | 167.8 | |
| 052136 | 05 22 58.94 | -36 27 31.2 | BLRG | C/J | 0.055 | Dec-05 | 92.3 | 230.7 | 167.8 | |
| 062052 | 06 21 43.29 | -52 41 33.3 | WLRG | FRI | 0.051 | Dec-05 | 180.4 | 545.3 | 167.8 | |
| 062535 | OH-342 | 06 27 06.65 | -35 29 16.3 | WLRG | FRI | 0.055 | Dec-05 | 180.4 | 545.3 | 167.8 |
| 062553 | 06 26 20.44 | -53 41 35.2 | WLRG | FRII | 0.054 | Dec-05 | 180.4 | 545.3 | 167.8 | |
| 080610 | 3C195 | 08 08 53.64 | -10 27 40.2 | NLRG | FRII | 0.110 | Dec-05 | 180.4 | 545.3 | 167.8 |
| 085925 | 09 01 47.50 | -25 55 19.0 | NLRG | FRII | 0.305 | Dec-05 | 180.4 | 545.3 | 167.8 | |
| 091511 | Hydra A | 09 18 05.67 | -12 05 44.0 | WLRG | FRI | 0.054 | May-04 | 165.7 | 125.8 | 83.9 |
| 094507 | 3C227 | 09 47 45.15 | +07 25 20.4 | BLRG | FRII | 0.086 | Dec-05 | 180.4 | 545.3 | 167.8 |
| 113613 | 11 39 10.75 | -13 50 43.1 | Q | FRII | 0.554 | Jun-06 | 180.4 | 545.3 | 167.8 | |
| 115134 | 11 54 21.79 | -35 05 29.1 | Q | CSS | 0.258 | Feb-06 | 180.4 | 543.3 | 167.8 | |
| 122602 | 3C273 | 12 29 06.70 | +02 03 08.6 | Q | C/J | 0.158 | Jun-04 | 48.2 | 37.7 | 41.9 |
| 130609 | 13 08 39.17 | -09 50 32.6 | NLRG | CSS | 0.464 | Feb-06 | 180.4 | 545.3 | 167.8 | |
| 135541 | 13 59 00.23 | -41 52 54.1 | Q | FRII | 0.313 | Feb-06 | 180.4 | 545.3 | 167.8 | |
| 154779 | 15 55 21.66 | -79 40 36.3 | BLRG | FRII | 0.483 | Aug-05 | 180.4 | 545.3 | 167.8 | |
| 155902 | 3C327 | 16 02 27.38 | +01 57 55.7 | NLRG | FRII | 0.104 | Mar-04 | 165.7 | 125.8 | 83.9 |
| 160201 | 3C327.1 | 16 04 45.35 | +01 17 50.8 | BLRG | FRII | 0.462 | Aug-05 | 180.4 | 545.3 | 167.8 |
| 164805 | Herc A | 16 51 08.16 | +04 59 33.8 | WLRG | FRI | 0.154 | Mar-04 | 165.7 | 125.8 | 83.9 |
| 173356 | 17 37 35.80 | -56 34 03.4 | BLRG | FRII | 0.098 | Aug-05 | 180.4 | 545.3 | 167.8 | |
| 181463 | 18 19 34.96 | -63 45 48.1 | NLRG | CSS | 0.063 | Aug-05 | 180.4 | 545.3 | 167.8 | |
| 183948 | 18 43 14.64 | -48 36 23.3 | WLRG | FRI | 0.112 | Oct-06 | 180.4 | 545.3 | none | |
| 193246 | 19 35 56.56 | -46 20 40.7 | BLRG | FRII | 0.231 | May-06 | 180.4 | 545.3 | 167.8 | |
| 193463 | 19 39 24.99 | -63 42 45.6 | NLRG | GPS | 0.183 | May-06 | 180.4 | 545.3 | 167.8 | |
| 193815 | 19 41 15.15 | -15 24 30.9 | BLRG | FRII | 0.452 | Nov-06 | 180.4 | 545.3 | none | |
| 194902 | 3C403 | 19 52 15.77 | +02 30 23.1 | NLRG | FRII | 0.059 | Nov-05 | 92.3 | 230.7 | 167.8 |
| 195455 | 19 58 16.06 | -55 09 37.5 | WLRG | FRI | 0.060 | May-06 | 180.4 | 545.3 | 167.8 | |
| 213514 | 21 37 45.18 | -14 32 55.5 | Q | FRII | 0.200 | Nov-05 | 180.4 | 545.3 | 167.8 | |
| 213520 | OX-258 | 21 37 50.00 | -20 42 31.7 | BLRG | CSS | 0.635 | Nov-05 | 180.4 | 545.3 | 167.8 |
| 221117 | 3C444 | 22 14 25.76 | -17 01 36.2 | WLRG | FRII | 0.153 | Dec-06 | 180.4 | 545.3 | none |
| 222102 | 3C445 | 22 23 49.57 | -02 06 12.4 | BLRG | FRII | 0.057 | Nov-04 | 92.3 | 69.2 | none |
| 225041 | 22 53 03.16 | -40 57 46.2 | NLRG | FRII | 0.310 | Nov-05 | 180.4 | 545.3 | 167.8 | |
| 231403 | 3C459 | 23 16 35.21 | +04 05 18.2 | NLRG | FRII | 0.220 | Nov-05 | 92.3 | 230.7 | 167.8 |
| 235661 | 23 59 04.50 | -60 54 59.1 | NLRG | FRII | 0.096 | Dec-05 | 180.4 | 545.3 | 167.8 |
Note. — Table1 Column 5: broad line radio galaxy (BLRG), narrow line radio galaxy (NLRG), quasar (Q), weak line radio galaxy (WLRG, also known as low excitation galaxies). Column 6: Fanaroff-Riley class 1 (FRI), Fanaroff-Riley class 2 (FRII), compact steep spectrum type (CSS), core/jet (C/J), gigahertz peaked spectrum (GPS). Uncertain classification in brackets.
| PKS Name | Other name | z | (mJy) | (mJy) | (mJy) | |||
|---|---|---|---|---|---|---|---|---|
| 002326 | 0.322 | 2.4 | 0.3 | 26.3 | 3.1 | 83.6 | 16.7 | |
| 003401 | 3C015 | 0.073 | 7.5 | 0.2 | 17.9 | 2.1 | 43.1 | 14.4 |
| 003502 | 3C17 | 0.220 | 12.2 | 0.1 | 23.6 | 4.8 | 97.2 | 9.1 |
| 003809 | 3C18 | 0.188 | 25.9 | 0.3 | 32.2 | 4.8 | 37.8 | 12.6 |
| 003944 | 0.346 | 33.0 | 0.4 | 68.7 | 4.6 | 84.6 | 13.5 | |
| 004342 | 0.116 | 11.1 | 0.2 | 9.9 | 3.0 | 24.9 | 8.3 | |
| 010516 | 3C32 | 0.400 | 9.7 | 0.2 | 11.8 | 3.9 | 22.5 | 7.5 |
| 011715 | 3C38 | 0.565 | 6.1 | 0.2 | 20.2 | 1.8 | 46.4 | 15.5 |
| 021313 | 3C62 | 0.147 | 40.2 | 0.1 | 37.1 | 2.9 | 51.1 | 17.0 |
| 023519 | OD-159 | 0.620 | 11.1 | 0.2 | 14.3 | 2.5 | 23.6 | 7.9 |
| 025271 | 0.566 | 2.9 | 0.1 | 9.1 | 3.0 | 37.4 | 12.5 | |
| 034705 | 0.339 | 3.5 | 0.2 | 30.8 | 4.3 | 52.2 | 17.4 | |
| 034927 | 0.066 | 8.8 | 0.3 | 41.9 | 1.3 | 31.3 | 10.4 | |
| 040403 | 3C105 | 0.089 | 30.8 | 0.1 | 70.9 | 2.0 | - | - |
| 040975 | 0.693 | 1.5 | 0.3 | 11.2 | 1.9 | 36.4 | 12.1 | |
| 044228 | 0.147 | 22.0 | 0.3 | 31.0 | 4.5 | 25.9 | 8.6 | |
| 052136 | 0.055 | 204.1 | 0.3 | 526.4 | 6.0 | 950.1 | 13.3 | |
| 062052 | 0.051 | 4.5 | 0.1 | 47.3 | 1.4 | 24.3 | 8.1 | |
| 062535 | OH-342 | 0.055 | 24.7 | 0.3 | 44.8 | 1.3 | 131.0 | 11.2 |
| 062553 | 0.054 | 1.7 | 0.2 | 10.8 | 3.6 | 52.6 | 17.5 | |
| 080610 | 3C195 | 0.110 | 258.3 | 0.4 | 489.7 | 1.3 | 308.7 | 7.1 |
| 085925 | 0.305 | 9.3 | 0.4 | 8.4 | 2.8 | 52.3 | 17.4 | |
| 091511 | Hydra A | 0.054 | 8.9 | 0.2 | 115.3 | 4.8 | 164.4 | 7.3 |
| 094507 | 3C227 | 0.086 | 47.7 | 0.3 | 19.4 | 3.5 | 44.1 | 14.7 |
| 113613 | 0.554 | 13.8 | 0.2 | 23.9 | 2.8 | 23.2 | 7.7 | |
| 115134 | 0.258 | 16.4 | 0.3 | 51.5 | 3.0 | 46.3 | 15.4 | |
| 122602 | 3C273 | 0.158 | 499.1 | 0.8 | 414.9 | 3.9 | 402.1 | 11.9 |
| 130609 | 0.464 | 4.6 | 0.2 | 21.7 | 2.1 | 29.2 | 9.7 | |
| 135541 | 0.313 | 53.1 | 0.3 | 66.3 | 2.0 | 55.9 | 18.6 | |
| 154779 | 0.483 | 7.9 | 0.1 | 19.2 | 1.7 | 50.2 | 16.7 | |
| 155902 | 3C327 | 0.104 | 242.0 | 0.3 | 470.0 | 3.7 | 262.8 | 21.4 |
| 160201 | 3C327.1 | 0.462 | 7.7 | 0.3 | 12.3 | 2.5 | 32.4 | 10.8 |
| 164805 | Herc A | 0.154 | 2.0 | 0.2 | 18.8 | 6.3 | 134.3 | 15.8 |
| 173356 | 0.098 | 29.2 | 0.3 | 151.0 | 3.3 | 318.2 | 10.9 | |
| 181463 | 0.063 | 60.6 | 0.4 | 142.1 | 2.1 | 202.1 | 13.1 | |
| 183948 | 0.112 | 3.1 | 0.3 | 10.9 | 2.5 | - | - | |
| 193246 | 0.231 | 2.5 | 0.1 | 17.6 | 1.6 | 36.5 | 12.2 | |
| 193463 | 0.183 | 17.4 | 0.1 | 19.9 | 2.2 | 33.2 | 11.1 | |
| 193815 | 0.452 | 6.8 | 0.3 | 19.7 | 4.2 | - | - | |
| 194902 | 3C403 | 0.059 | 193.0 | 0.2 | 348.4 | 3.7 | 251.3 | 7.1 |
| 195455 | 0.060 | 2.7 | 0.2 | 8.8 | 2.9 | 34.1 | 11.4 | |
| 213514 | 0.200 | 104.9 | 0.2 | 113.7 | 4.8 | 118.6 | 20.5 | |
| 213520 | OX-258 | 0.635 | 4.3 | 0.3 | 37.0 | 4.4 | 127.1 | 10.3 |
| 221117 | 3C444 | 0.153 | 0.5 | 0.1 | 9.4 | 3.1 | - | - |
| 222102 | 3C445 | 0.057 | 232.1 | 0.3 | 186.4 | 5.2 | - | - |
| 225041 | 0.310 | 11.6 | 0.1 | 22.0 | 2.5 | 27.6 | 9.2 | |
| 231403 | 3C459 | 0.220 | 49.9 | 0.3 | 511.5 | 3.9 | 490.4 | 19.1 |
| 235661 | 0.096 | 41.0 | 0.2 | 74.7 | 2.2 | 35.4 | 11.8 |
3.3 24m Reduction
As the shortest wavelength band, the 24m channel of MIPS is also the most sensitive, and has the highest spatial resolution (6′′ FWHM). Integration times for our targets were in the range 48.2 to 180.4 seconds, where over 80% have the longer exposure time (see Table 1).
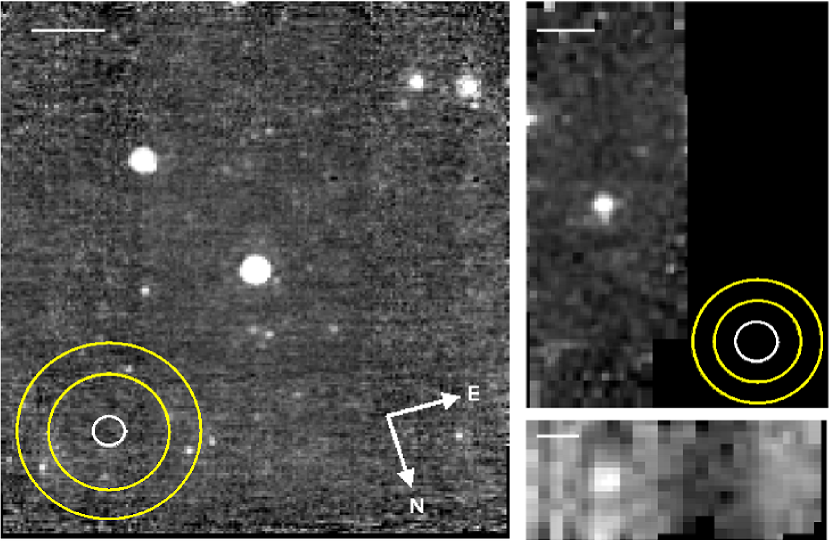
Minimal processing to the 24m SSC pipeline product is required for most general science objectives. However, we re-processed the data by mosaiking the BCD files using the MOPEX software and adding an additional flatfield and overlap correction. The flatfield script is part of the MOPEX software package. It computes a flat field from the median of all the dithered frames, normalizes this to an average of 1 and divides into all the input BCD files. In contrast, the overlap correction interpolates the input images onto a common grid and then the cumulative pixel-by-pixel difference between the overlapping areas is minimized. The final mosaic pixel size was set to 2.45 arsecs. This was deliberately chosen to match the pipeline post-BCD products for purposes of comparison. Examples of the images can be seen in Figure 1.
The 24m fluxes were extracted using aperture photometry in the GAIA package. Aperture corrections were derived from an empirically determined average curve of growth of flux vs. aperture diameter derived from observations of bright sources in our sample with mJy (PKS0521-36 (catalog ), PKS122602 (catalog ), PKS194902 (catalog ), PKS2221-02 (catalog ), PKS231403 (catalog )). These aperture corrections are broadly consistent with those published by the SSC. For most objects the aperture was set to a standard radius of 15′′ corresponding to an aperture correction of 1.08. However, for a few objects an aperture of half this size (7.5′′) was used to avoid contamination from the flux of objects close to the source. In the latter cases the applied aperture correction was 1.52.
The standard deviation of 6 aperture flux measurements of background sky patches, obtained using an identical aperture to the object flux measurements, was used to derive the 1 uncertainties presented in Table 2. These 1 values represent the fluctuations in the sky background due to photon counting noise, as well as mosaiking and flat fielding artifacts. Given that most of the sources are faint relative to the background, these 1 measurements give a realistic estimate of the 1 uncertainties in the flux measurement for the fainter sources in the sample. In addition there is an estimated 4% flux calibration uncertainty (Engelbracht et al., 2007), which is likely to dominate for the brightest sources in the sample. Overall, at 24m we detect 100% of our sample at the level.
3.4 70m Reduction
The 70m waveband is less sensitive than the 24m band and uses an entirely different Ge:Ga detector technology, which is not as stable as the Si:As detectors used at 24m. The spatial resolution of Spitzer/MIPS at 70m is 18′′(FWHM). Integration times for our targets were in the range 37.7 to 545.3 seconds, where over 80% have the longer exposure time (see Table 1). The 70m data were also reduced with the MOPEX package. In addition to the basic mosaiking process we used a column filtering process from the SSC contributed software pages (IDL program BCD column filter.pro), which calculates the median value for each column and subtracts that from each column for each BCD. This process significantly improves artifacts in the images with minimal loss of flux from the source. The final mosaic pixel size is 3.9′′, again chosen to match that of the pipeline mosaic products.
The fluxes at 70m were also measured using aperture photometry, with an aperture radius of 24′′ for the majority of sources. Aperture corrections and 1 uncertainties were derived in the same manner as for the 24m images111N.B. In the case of 70m and 160m, in addition to the photon counting and instrumental induced fluctuations, there will be an additional contribution to the fluctuations in the background from sources close to the detection limit. This will be reflected in the 1 estimates tabulated in Table 2.. Again these aperture corrections are broadly consistent with those published by the SSC. In this case the aperture correction factor is 1.33. A smaller aperture of half the size (22′′) was used for fainter sources to obtain better S/N for detections, with a correction factor of 2.04. There is also an additional 10 % calibration error at 70m (Gordon et al., 2007). For undetected sources upper limits were derived using the standard deviation of background measurements to obtain . For these sources the values presented in Table 2 are the 3 upper limits, of which there are 5.
Overall, we detect 90% of our sample at 70m at the level.
3.5 160m Reduction
The longest wavelength MIPS band (160m) has the lowest effective sensitivity and utilizes the same detector technology as 70m. The spatial resolution of Spitzer/MIPS at 160m is 40′′(FWHM). Integration times for our targets at 160m were in the range 41.9 to 167.8 seconds, where over 90% have the longer exposure time (see Table 1).
In this case we mosaiked the images with the MOPEX software (final image pixel size 7.9′′) with no additional processing, as none of the available tools appeared to provide any significant improvement to the images.
Aperture photometry proved impossible to use for extracting the 160m flux, due to the difficulty in estimating the background accurately. This is because the PSF at 160m is on the scale of the image, and there is also the strong possibility of contamination by other sources in the field. Therefore, we used the APEX program in the MOPEX GUI software to extract the fluxes of detected sources using PSF fitting. The standard PSF available with the software was used for this task. Overall we detect 33% of our sample at 160m at the level.
The 1 errors were derived in an identical way to the other 2 wavebands, and the upper limits were derived in an identical way to 70m . There is also an additional 20% flux calibration uncertainty as stated in the MIPS data handbook (available from the SSC website). Upper limits were derived using the standard deviation of background measurements to obtain The values presented in Table 2 are the 3 upper limits, of which there are 27. Note that a few objects undetected by the APEX software appear to be detected in a visual inspection of the image. Also, overlapping PSF from nearby objects has prevented the APEX detection of a point source in at least one image. Therefore, we believe that the APEX software underestimates the true detection rate of sources in our sample; in this sense the detection rate is conservative. This conclusion is consistent with the fact that the typical 3 detection limit for the 160m data is 55mJy, which is somewhat lower than the lowest measured flux of 84.6mJy.
3.6 Notes on the MFIR observations
Due to an error in the acquisition file for the data, PKS2135-20 was observed twice. This gave us an opportunity to investigate the uncertainty derived from two identical observations of the same source. We found that the fluxes measured for this source in the two data sets were consistent within 10% in all MIPS bands. Fluxes presented in Table 2 are the mean fluxes of the two observations.
It has also been possible to compare some of our flux values obtained using Spitzer with those based on IRAS observations. Taking into account BLRG/quasar objects that are potentially variable, we directly compared the IRAS 25m and Spitzer 24m flux measurement. However in order to make the comparison for the FIR fluxes it was necessary to extrapolate the IRAS 60m fluxes to the Spitzer 70m band using the IRAS 25 to 60m spectral index. We find that the Spitzer and IRAS fluxes agree to within better than 20% at 24m and within better than 30% at 70m. It is also worth noting that our Spitzer measured flux values for sources in common agree with published Spitzer fluxes in Shi et al. (2005) to within a few percent.
4 Radio Observations and Reduction
| PKS Name | Radio Class | z | (mJy) | Beam(′′) | (mJy) | Beam(′′) | Combined | R | ||
|---|---|---|---|---|---|---|---|---|---|---|
| 003944 | FRII | 0.346 | 0.4 | 0.5x0.3(-2.7) | 0.3 | 0.4x0.2(-2.8) | - | 0.0059 | ||
| 004342 | FRII | 0.116 | - | 0.3 | 0.6x0.3(26.4) | - | 0.3 | 0.5x0.2(31.5) | 1.4 | 0.0005 |
| 025271 | CSS | 0.566 | 278.1* | 1.0 | 0.4x0.3(18.2) | 187.7* | 1.0 | 0.3x0.2(-20.8) | - | 0.0260 |
| 034927 | FRII | 0.066 | 20.0 | 0.1 | 0.7x0.3(3.8) | 21.7 | 0.3 | 0.6x0.2(4.7) | - | 0.0095 |
| 040975 | FRII | 0.693 | 3.3 | 0.4x0.3(24.8) | 3.0 | 0.3x0.2(21.6) | - | 0.0023 | ||
| 044228 | FRII | 0.147 | 19.1 | 0.4 | 0.9x0.3(19.2) | 20.4 | 0.4 | 0.6x0.2(17.4) | - | 0.0090 |
| 052136 | C/J | 0.055 | 2798* | 24.4 | 0.6x0.4(11.5) | 2654* | 14.8 | 0.4x0.3(14.5) | - | 0.4115 |
| 062052 | FRI | 0.051 | 118.6 | 0.6 | 0.5x0.3(26.3) | 101.2 | 0.7 | 0.4x0.2(28.6) | - | 0.0964 |
| 062535 | FRI | 0.055 | 571.6 | 3.4 | 0.7x0.3(6.2) | 478.8 | 3.0 | 0.5x0.2(7.5) | - | 0.3293 |
| 062553 | FRII | 0.054 | 20.4 | 0.2 | 0.5x0.2(7.0) | 19.3 | 0.2 | 0.3x0.2(8.6) | - | 0.0130 |
| 085925 | FRII | 0.305 | - | 0.5 | 1.5x0.3(2.2) | - | 0.5 | 1.1x0.2(3.6) | 2.5 | 0.0013 |
| 115134 | CSS | 0.258 | 759.9* | 6.5 | 1.0x0.3(-23.4) | 598.2* | 6.3 | 0.7x0.2(-22.0) | - | 0.0072 |
| 135541 | FRII | 0.313 | 102.7 | 0.8 | 0.5x0.3(0.2) | 89.6 | 1.0 | 0.4x0.3(-0.8) | - | 0.0715 |
| 154779 | FRII | 0.483 | - | 0.2 | 0.6x0.3(-18.4) | - | 0.2 | 0.5x0.2(-14.8) | 1.4 | 0.0010 |
| 173356 | FRII | 0.098 | 293.6 | 0.9 | 0.4x0.3(-34.1) | 269.4 | 1.9 | 0.3x0.2(-32.5) | - | 0.0911 |
| 181463 | CSS | 0.063 | 1909* | 6.5 | 0.4x0.3(-5.3) | 1626* | 7.3 | 0.3x0.2(-5.0) | - | 0.0265 |
| 183948 | FRI | 0.112 | 108.2 | 0.5 | 0.5x0.3(-3.3) | 100.9 | 0.6 | 0.4x0.2(-3.3) | - | 0.0889 |
| 193246 | FRII | 0.231 | 16.4 | 0.7 | 0.5x0.4(-67.4) | 21.5 | 0.5 | 0.4x0.3(-65) | - | 0.0050 |
| 193463 | GPS | 0.183 | 1045* | 2.0 | 0.6x0.3(68.9) | 755.1* | 1.1 | 0.6x0.2(66.3) | - | - |
| 195455 | FRI | 0.060 | 61.7 | 0.2 | 0.4x0.3(56.6) | 61.6 | 0.3 | 0.3x0.3(63.8) | - | 0.0393 |
| 225041 | FRII | 0.310 | 0.4 | 0.7x0.3(-20.2) | 0.4 | 0.5x0.3(-19.2) | - | 0.0012 | ||
| 235661 | FRII | 0.096 | 59.7 | 0.3 | 0.4x0.3(76.6) | 63.8 | 0.4 | 0.3x0.2(89.4) | - | 0.0137 |
Note. — Table3: Flux density results from the ATCA observations. Definitions for column 2 see Table1. (*) denotes a total flux measurement as the resolution of the observations is not high enough to resolve the core in these compact objects. Column 11 gives the R parameter defined as where the total flux is taken at 5GHz assuming a flat spectrum.
| PKS Name | Other Name | Radio Class | z | (mJy) | Beam(′′) | (mJy) | Beam(′′) | R | ||
|---|---|---|---|---|---|---|---|---|---|---|
| 002326 | CSS | 0.322 | 995.8* | 7.0 | 0.7x0.3(-7.1) | 820* | 9.0 | 0.5x0.2(-10.2) | 0.0059 | |
| 003401 | 3C015 | FRII | 0.073 | 31.5 | 0.5 | 0.4x0.3(51.4) | 36.9 | 0.9 | 0.3x0.2(53.7) | 0.0218 |
| 003502 | 3C17 | (FRII) | 0.220 | 320.6 | 1.9 | 0.4x0.4(45.7) | 249.8 | 4.2 | 0.2x0.2(-79.2) | 0.2870 |
| 003809 | 3C18 | FRII | 0.188 | 55.6 | 0.5 | 0.3x0.3(-51.1) | 68.2 | 0.9 | 0.2x0.2(51.4) | 0.0387 |
| 010516 | 3C32 | FRII | 0.400 | 0.4 | 0.5x0.3(4.8) | 0.8 | 0.3x0.2(5.9) | 0.0015 | ||
| 011715 | 3C38 | FRII | 0.565 | 0.8 | 0.5x0.3(6.6) | 0.9 | 0.3x0.2(10.3) | 0.0019 | ||
| 023519 | OD-159 | FRII | 0.620 | 0.6 | 0.6x0.3(8.9) | 0.9 | 0.4x0.1(11.1) | 0.0016 | ||
| 034705 | FRII | 0.339 | 0.7 | 0.4x0.3(-55.9) | 0.8 | 0.2x0.2(-62) | 0.0019 | |||
| 034927 | FRII | 0.066 | 17.5 | 0.4 | 0.8x0.3(15.4) | 17.4 | 1.1 | 0.6x0.2(15.7) | 0.0095 | |
| 040403 | 3C105 | FRII | 0.089 | 19.8 | 0.5 | 0.4x0.3(-25.5) | ? | - | 0.3x0.2(63.9) | 0.0083 |
| 080610 | 3C195 | FRII | 0.110 | 32.7 | 0.4 | 0.4x0.3(-1.6) | 20.7 | 0.4 | 0.3x0.2(-4.0) | 0.0166 |
| 085925 | FRII | 0.305 | 0.6 | 0.7x0.3(0.6) | 0.8 | 0.5x0.2(2.3) | 0.0013 | |||
| 091511 | Hydra A | FRI | 0.054 | 211.3 | 2.5 | 0.5x0.3(-1.8) | 184.5 | 1.7 | 0.3x0.2(-2.0) | 0.0146 |
| 094507 | 3C227 | FRII | 0.086 | 13.9 | 0.3 | 0.4x0.3(-32.2) | 11.7 | 0.3 | 0.3x0.1(-23.3) | 0.0049 |
| 113613 | FRII | 0.554 | 234.7 | 1.4 | 0.5x0.3(-0.5) | 230.4 | 1.6 | 0.3x0.2(-1.8) | 0.1395 | |
| 122602 | 3C273 | C/J | 0.158 | 24060.0 | 102.0 | 0.4x0.3(-46.7) | 19460 | 185 | 0.2x0.2(-59.1) | 1.1884 |
| 130609 | CSS | 0.464 | 505.4* | 4.7 | 0.4x0.3(-2.5) | 397.9* | 3.8 | 0.3x0.2(2.8) | 0.0152 | |
| 155902 | 3C327 | FRII | 0.104 | 15.2 | 0.3 | 0.4x0.3(44.3) | 11.2 | 0.3 | 0.3x0.2(53.8) | 0.0046 |
| 160201 | 3C327.1 | FRII | 0.462 | 63.7 | 0.6 | 0.4x0.3(50.9) | 65.5 | 0.7 | 0.3x0.2(58.3) | 0.0734 |
| 164805 | Herc A | FRI | 0.154 | - | - | - | - | - | 0.0004 | |
| 194902 | 3C403 | FRII | 0.059 | 20.0 | 0.6 | 0.4x0.4(53.6) | 8.5 | 0.4 | 0.3x0.2(53.6) | 0.0060 |
| 213514 | FRII | 0.200 | 106.3 | 1.1 | 0.5x0.3(-7.7) | 44.3 | 1.1 | 0.3x0.2(-14.1) | 0.0577 | |
| 213520 | OX-258 | CSS | 0.635 | 416* | 3.8 | 0.6x0.3(-3.1) | 199.8* | 3.3 | 0.4x0.2(-7.1) | 0.0076 |
| 221117 | 3C444 | FRII | 0.153 | 0.4 | 0.5x0.3(1.1) | 0.6 | 0.5x0.29(-7.6) | 0.0007 | ||
| 222102 | 3C445 | FRII | 0.057 | 27.3 | 0.4 | 0.4x0.3(46.6) | 16.1 | 0.5 | 0.3x0.2(14.5) | 0.0096 |
| 231403 | 3C459 | FRII | 0.220 | 1.0 | 0.4x0.3(49.9) | 0.9 | 0.3x0.2(58.5) | 0.1060 | ||
| VLBI core upper limits of compact objects in the sample from Tzioumis et al. (2002) | ||||||||||
| 002326 | CSS | at 2.3GHz | ||||||||
| 025271 | CSS | at 2.3GHz | ||||||||
| 115134 | CSS | at 8.3GHz | ||||||||
| 130609 | CSS | at 2.3GHz | ||||||||
| 181463 | CSS | at 2.3GHz | ||||||||
| 213520 | CSS | at 5GHz | ||||||||
Note. — Table4: Flux density results from VLA observations. (*) total flux measurement as the resolution of the observations is not high enough to resolve the core in these compact objects.
4.1 Sample
The radio sample is identical to that discussed in section 2. The objects were divided between the ATCA and the VLA observatories according to the declination of the source (cutoff ). Four objects – PKS0023-26 (catalog ), PKS0349-27 (catalog ), PKS0442-28 (catalog ), PKS0859-25 (catalog )– were observed with both ATCA and the VLA.
4.2 ATCA Observations
We observed 23 objects (with ) from our sample with ATCA. For one object (PKS002326 (catalog )) the quality of the ATCA data turned out to be quite low, we have therefore excluded it from our ATCA list and we will use only the VLA data.
The sources were observed using the 6-km configuration – the longest available for this radio telescope. These observations were carried out between the 19th and 23rd of July 2006 in perfect weather conditions. The total run comprised of a continuous 100h of observations.
Data were taken simultaneously at 17.9 GHz and 24.1 GHz. These high frequencies allow us to achieve a relatively high resolution. Each source was observed for a period ranging from 30 to 60 min (depending on scheduling constraints) in scans of 10 min spread over a period of 12h in order to obtain a good enough uv-coverage. In each scan we swapped between the two frequencies. Furthermore, for each frequency, we actually took data simultaneously at 17.47 and 18.50 GHz in the first observation and at 23.62 and 24.64 GHz in the second, with a bandwidth of 128 MHz for each of these frequencies. These separate frequencies allowed us to improve (radially) the coverage. The flux calibrator – PKS1934-64 flux level at 12mm = 1.03Jy – was observed few times during the whole run. In addition, a nearby phase calibrator was observed for 5 min before every scan on a source. A reference pointing observation was also carried out before every source.
The ATCA data were calibrated using the MIRIAD software package (Sault et al., 1995). The final images were obtained using multi-frequency synthesis option and adding together the two nearby frequencies (17.47 and 18.50 GHz; 23.62 and 24.64 GHz) to increase the sensitivity and improve the uv-coverage. Typically two cycles of self-calibration were needed to obtain the final images. In these images, we have used uniform weighting to achieve the highest possible resolution.
Table 3 summarises the results of the ATCA observations, including beam size and noise for each object and each frequency. We have detected radio cores in 14 of the 22 sources (63%; PKS 0023-26 is excluded from the ATCA list as discussed above). In a few cases, in particular those for which the core was not detected, we have combined both frequencies (17 and 24 GHz) in order to improve the sensitivity (PKS0043-42 (catalog ), PKS0859-25 (catalog ), PKS1547-79 (catalog )). Upper limits to the flux and power of the undetected cores, were estimated using of the noise level. A few objects are known to be compact steep spectrum (PKS0252-71 (catalog ), PKS1151-34 (catalog ), PKS1814-63 (catalog ), PKS1934-63 (catalog )). These sources are already part of the list of ATCA calibrators and indeed the resolution of our observation is not good enough to pinpoint a possible core. We have used these objects as a check of on our measured flux level (they agree very well with the data from the calibration archive and they show no indication of variability). For these sources, core fluxes or upper limit have been measured from VLBI maps in Tzioumis et al. (2002) (listed at the end of Table 4).
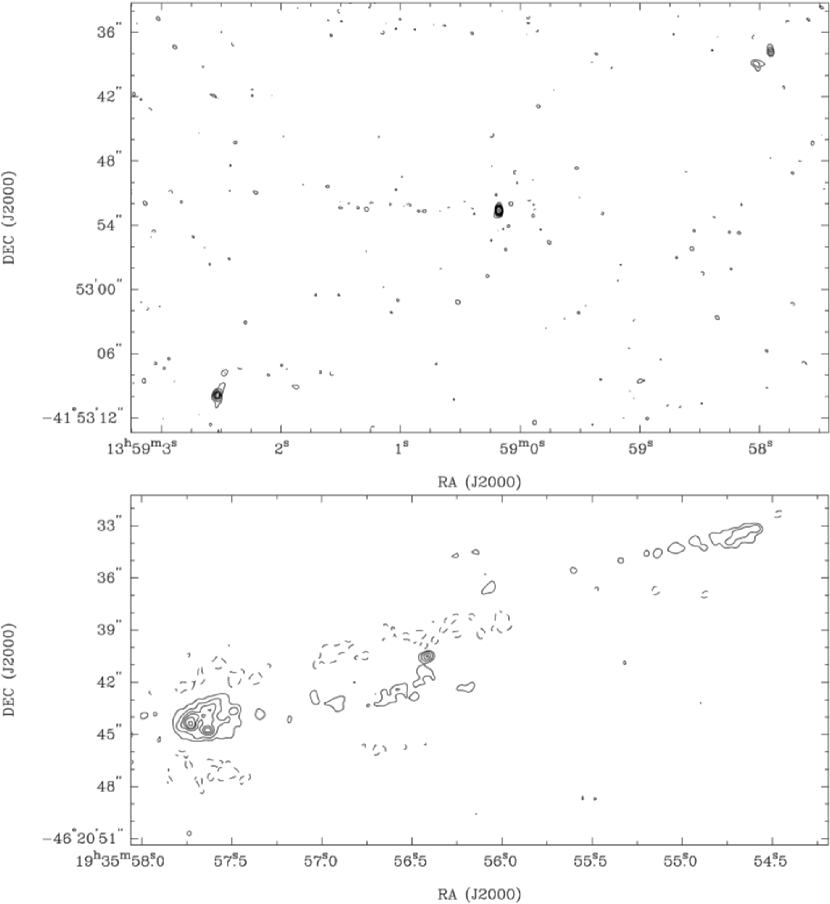
Finally, in a number of objects (PKS0039-44, PKS0043-42, PKS0409-75, PKS0442-28, PKS0859-25, PKS1355-41, PKS1547-79, PKS1932-46, PKS 2250-41) we also detected radio emission from other regions of the radio galaxy and, in particular, from the hot spots. Two examples of this are shown in Fig. 2. These maps illustrate the fact that at the high radio frequency and resolution of the observations, the maps are dominated by the compact cores, hotspots and knot features along the jets, and the diffuse lobe emission is resolved out.
4.3 VLA Observations
We observed 27 objects with the VLA at frequencies of 14.9 and 22.4 GHz. The observations were carried out between 4 Aug, 2-3 Sep 2006 in B-array configuration. Due to servicing, 10 out of 27 dishes were not operating during the observation period. For one object (PKS044228 (catalog )) the quality of the VLA data turned out to be quite low due to the declination of the source, we therefore have excluded it from our VLA list and we will use only the ATCA data.
Each source was observed for about 15 min per frequency, separated in three scans of 5 min each. In addition, a reference pointing observation was carried out before every source. The observations at the two frequencies were interleaved, to provide a better uv-coverage. As flux calibrators we used PKS0713438 for the U-band (14.4-14.9GHz), and PKS1331305 (3C286) for the K-band (22.1-26.0GHz). These calibrators were observed a few times during the run. Data splitting and opacity corrections were done inside AIPS, while the rest of the data reduction was done using the MIRIAD software package. Images of the separate frequencies were obtained for each source and combined images were also made in order to attempt to detect those objects with faint cores, to no avail. Table 4 summarises the results of the VLA observations.
Overall, from the VLA observations, we detected cores in 58% of the sources (15 cores detected in the 26 successfully observed).
Again, in 7 of the VLA objects (PKS0117-15, PKS0347-05, PKS0859-25, PKS0915-11, PKS 113607, PKS1602-01, PKS2314-03) we also detected radio emission from extended regions of the radio galaxy and, in particular, from the hot spots.
4.4 Notes on the radio observations
We chose a high resolution array configuration in order to try and detect the high frequency radio cores. Due to this the resolution of the images resolves out the extended structure of the sources. Therefore it would be impossible to provide accurate measurements for the total emission from our sources with these observations at 15 to 22 GHz.
Also, in the final column of the ATCA and VLA data tables we present estimates of the orientation sensitive R parameter defined as . In order to determine this we have used estimates of the total radio flux measured at 5GHz taken from Morganti et al. (1993), and the core measurement is taken from the lower of the two observed frequency core detections of either the ATCA (18 GHz) or VLA (15 GHz) observations. Here we assume that the flat spectrum core flux remained constant between 5 GHz and the higher frequencies. The analysis of these data will be addressed in the detailed discussion paper to follow.
| Name | Other | Opt.Class | Rad.Class | Total | Core | Name | Other | Opt.Class | Rad.Class | Total | Core |
|---|---|---|---|---|---|---|---|---|---|---|---|
| 002326 | NLRG | CSS | 115134 | Q | CSS | ||||||
| 003401 | 3C015 | WLRG | FRII | ✓ | 122602 | 3C273 | Q | C/J | - | - | |
| 003502 | 3C17 | BLRG | (FRII) | ✓ | ✓ | 130609 | NLRG | CSS | ✓ | ||
| 003809 | 3C18 | BLRG | FRII | ✓ | 135541 | Q | FRII | ||||
| 003944 | NLRG | FRII | 154779 | BLRG | FRII | ||||||
| 004342 | WLRG | FRII | 154979 | NLRG | CFS | - | - | ||||
| 010516 | 3C32 | NLRG | FRII | 155902 | 3C327 | NLRG | FRII | ||||
| 011715 | 3C38 | NLRG | FRII | 160201 | 3C327.1 | BLRG | FRII | ✓ | |||
| 021313 | 3C62 | NLRG | FRII | 164805 | Herc A | WLRG | FRI | ||||
| 023519 | OD-159 | BLRG | FRII | 173356 | BLRG | FRII | |||||
| 025271 | NLRG | CSS | 181463 | NLRG | CSS | ||||||
| 034705 | BLRG | FRII | 183948 | WLRG | FRI | ✓ | ✓ | ||||
| 034927 | NLRG | FRII | 193246 | BLRG | FRII | ✓ | |||||
| 040403 | 3C105 | NLRG | FRII | 193463 | NLRG | GPS | |||||
| 040975 | NLRG | FRII | ✓ | 193815 | BLRG | FRII | - | ||||
| 044228 | NLRG | FRII | 194902 | 3C403 | NLRG | FRII | |||||
| 052136 | BLRG | C/J | - | - | 195455 | WLRG | FRI | ✓ | ✓ | ||
| 062052 | WLRG | FRI | ✓ | 213514 | Q | FRII | |||||
| 062535 | OH-342 | WLRG | FRI | ✓ | 213520 | O-258 | BLRG | CSS | |||
| 062553 | WLRG | FRII | ✓ | 221117 | 3C444 | WLRG | FRII | ||||
| 080610 | 3C195 | NLRG | FRII | 222102 | 3C445 | BLRG | FRII | ||||
| 085925 | NLRG | FRII | 225041 | NLRG | FRII | ||||||
| 091511 | Hydra A | WLRG | FRI | 231403 | 3C459 | NLRG | FRII | ||||
| 094507 | 3C227 | BLRG | FRII | 235661 | NLRG | FRII | |||||
| 113613 | Q | FRII | ✓ | ✓ |
5 Non-thermal Contamination
MFIR emission can potentially have a thermal and/or non-thermal origin in radio loud AGN: thermal emission from re-radiation of AGN light by dust, and non-thermal synchrotron radiation. Therefore, in order to investigate the MFIR dust emission we need to be aware of the potential contamination by non-thermal sources. There are two important components to consider when investigating the non-thermal contamination in a sample of steep-spectrum radio-loud AGN.
-
•
Total steep spectrum emission: Steep spectrum components such as lobes and hotspots could be potential non-thermal contaminants of the MFIR emission. Despite the fact that these components fall in flux towards higher frequencies, they could still potentially dominate the flux of an object at MFIR wavelengths. However, the proportion of this non-thermal contamination also depends on how much of the steep spectrum emission regions lies within the MFIR instrument beam (in this case the Spitzer beam). Thus, the degree of contamination by steep spectrum components for most of the nearby extended sources in our sample will be insignificant because they have a high proportion of their synchrotron emitting lobes/hotspots far outside the beam. The contamination is likely to be most important for compact objects such as CSS/GPS, and for extended FRII sources at high redshift that appear small because of their large distances. At the average redshift (z = 0.244) of our complete sample, objects with diameter kpc would fit entirely within the 18′′ Spitzer beam at 70m.
-
•
Flat spectrum core/jet components: Flat spectrum core/jet component can also be a potential non-thermal contaminant of the MFIR emission. We can detect strong non-thermal jet emission at optical wavelengths in some objects (e.g. 3C273 (catalog )), so it is reasonable to assume that this emission may contribute to the observed flux at MFIR wavelengths. Quasars and BLRG are known to have strong non-thermal beamed core components (Morganti et al., 1997), with the strength of this contamination is dependent on the orientation of the object to the line of sight.
Identifying the non-thermal contribution to the MFIR is not a trivial task, because the spectral shape of radio-loud AGN is often poorly sampled in key areas such as the sub-mm and far-infrared. Although some flat spectrum quasars and BL Lac/Blazar objects are clearly dominated by their non-thermal component at sub-mm and infrared wavelength, our steep spectrum selected sample has been chosen to avoid such objects, in order to investigate the thermal emission from dust. Despite this, the contribution from non-thermal emission from objects with relatively strong radio cores and from steep spectrum lobe/hotspot components in the Spitzer beam, remains a possibility, and should be carefully investigated.
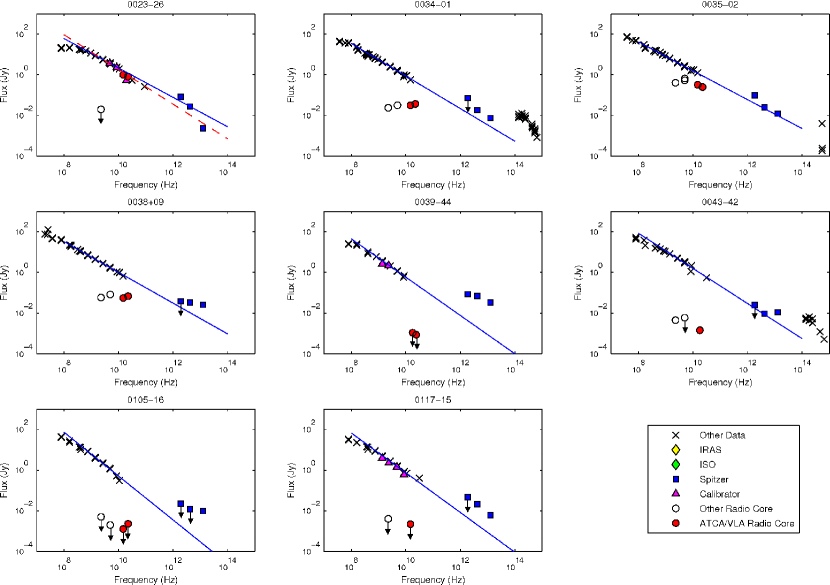
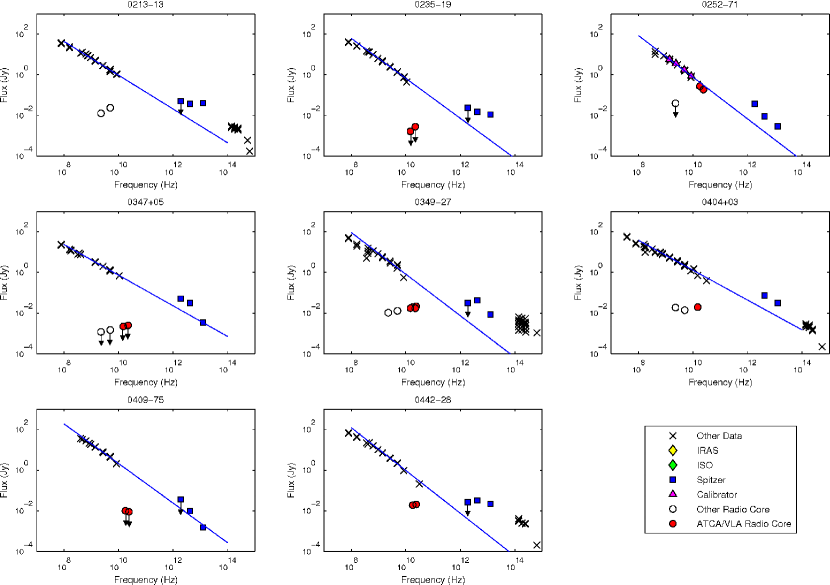
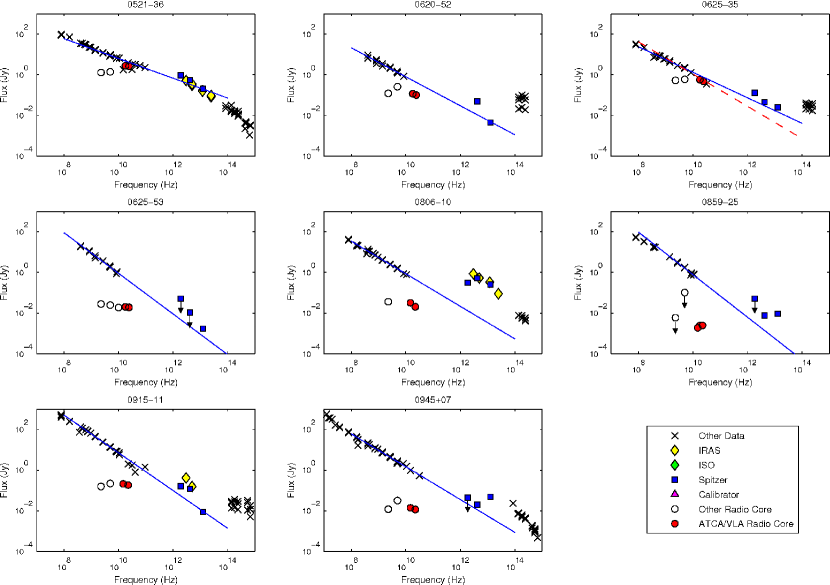
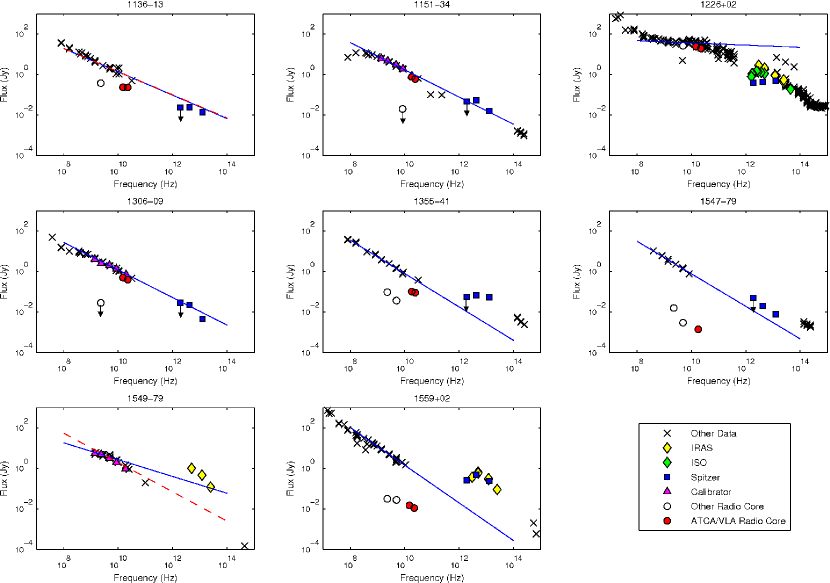
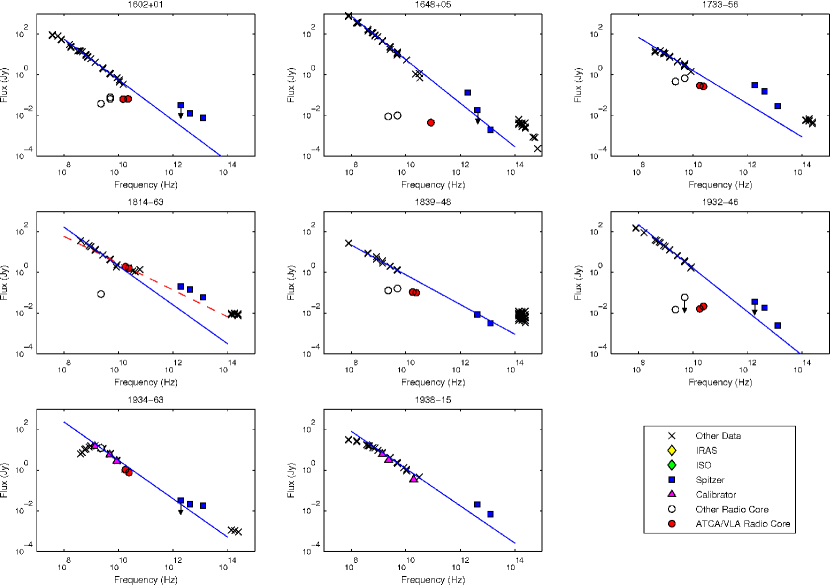
5.1 Spectral Energy Distributions
In Figures 3 to 8 we present spectral energy distributions for the entire sample described in section 2. The data plotted includes the results of the Spitzer, ATCA and VLA observations presented in this paper, along with IRAS and ISO photometry total flux measurements and other total flux data taken from NASA/IPAC Extragalactic Database (NED). Additional core radio data is taken from Morganti et al. (1993, 1997, 1999).
Total flux observations from ATCA of a large proportion of the sample have been made at 18.5 and 22 Ghz (Ricci et al., 2006), which would complement our core measurements well. Unfortunately the atmospheric phase stability during the latter observations was poor, which may have contributed to the fact that, when plotted in the SEDs, many of the values seemed unphysical compared to the other data sets. Thus these results are not included in our SED plots.
The solid line in each plot represents a single power-law fit to the total radio flux data of the objects between to Hz. A few objects have an additional dashed line fitted to the data between and Hz, when good data above Hz is available. Unfortunately this is a relatively under-sampled region in our data set, and we can fit this extra line to only 6 of the objects in our sample. In the following analysis this second fitted line, which takes better account of any high frequency steepening/flattening of the SED, is used in preference to the first solid line fit, where applicable.

5.2 Lobe/hotspot synchrotron contamination
By using the fitted power laws to extrapolate the total synchrotron radio emission through to the MFIR, it is possible to gain an indication of whether a contribution to the MFIR flux is possible from the non-beamed synchrotron emitting lobes and hotspots. However, Spitzer’s beam size of 6, 18 and 40′′ at 24, 70 and 160m respectively, means that for many targets in our sample most of the extended steep spectrum emission lies well outside the beam. In Table 5 we address this issue, presenting a truth table from a visual analysis of the SEDs, where we have used the 70m flux as a reference point for the analysis.
For an object to be considered as a candidate for possible steep spectrum synchrotron contamination, a source was required to fulfil two criteria. Firstly, the power law extrapolation of the total (steep spectrum dominated) radio lobe/hot-spot flux was required to fall close to or above the 70m flux. Secondly, a substantial fraction of the total radio emission at 5 GHz (%, as determined from visual inspection of radio maps) was required to fall within the Spitzer beam at 70m. A tick in columns 5 and 11 in Table 5 indicates that an object fulfils both of these criteria. We find that only 7 out of our complete sample of 46 fulfil both these criteria, therefore indicating that these objects have the potential for contamination by their extended synchrotron components that fall within the Spitzer beam. We emphasise that this is a conservative estimate, given that the steep spectrum synchrotron component is likely to fall quicker than the fitted power-law at higher frequencies due to spectral aging of the electron population. Evidence for such spectral steepening can be seen in the SEDs of PKS010516 (catalog ), PKS062535 (catalog ) and 154979 (catalog ) (See Figures 5 and 6). Indeed, other authors (e.g. Shi et al. 2005, Cleary et al. 2007) fit a parabola to the steep spectrum components in order to take this high frequency steepening into consideration. Therefore, our power-law extrapolation is likely to provide an over-estimate of the rate of steep spectrum contamination at MFIR wavelengths in our sample. We believe that more detailed parabolic or multiple power-law fits to the total radio flux spectra are unwarranted given the lack of sub-mm data for most of the objects.
5.3 Core/jet synchrotron contamination
The thermal dust contribution to the MFIR observed flux can be identified by extrapolating the slope of the total radio flux data to higher frequencies and interpreting everything above that slope as the thermal bump (e.g. Hughes et al., 1997; see previous section 5.2). However, this does not take into account any contribution one might have from a flatter spectrum core/jet component.
Using our high frequency radio core observations, and additional data from the literature, we have plotted the radio core fluxes and upper limits on the SEDs of most objects, in order to investigate their possible contribution to the MFIR flux. Again, using the 70m flux point as a reference and assuming the core spectral shape to be flat, we then deem non-thermal contamination to be possible for those objects whose high frequency radio core/jet fluxes lie level with or above the 70m flux.
Note again that this criterion is conservative in the sense that the SEDs of flat spectrum radio core components may not remain flat up to MFIR wavelengths as we have assumed. Indeed, the 3 flat spectrum, core dominated objects in our sample (3C273 (catalog ), PKS052136 (catalog ) and PKS154979 (catalog )) all show significant declines between the radio and the sub-mm/MFIR. In the case of 3C273 (catalog ) this decline is 2 orders of magnitude between the radio and MFIR.
We have also investigated the alternative of fitting a power-law to the core radio data and extrapolating this through to infrared frequencies. Unfortunately, due to the small number of core data points and relatively narrow wavelength range, there is relatively large uncertainty in the extrapolations of the core data to the MFIR. Future observations in the sub-mm region for the complete sample will allow us to constrain the possible contribution of the flat spectrum core-jet components to the MFIR more accurately.
In columns 6 and 12 of Table 5 we present the results, finding that 11 out of 46 objects in our complete sample have a possibility of contamination of their MFIR emission from flat spectrum core/jet components.
5.4 Level of potential non-thermal contamination
Overall, we have found that 15% of our complete sample have potential contamination from the steep spectrum components (lobes/hotspots), and 24% have potential contamination from a core/jet component. Out of the 46 objects in our full complete sample, a maximum of 30% have the possibility of significant non-thermal contamination of their thermal MFIR emission from either steep spectrum components and/or a core/jet component. However, as discussed above (§5.2 & §5.3) these are likely to be conservative estimates, because the strength of both the flat core and steep spectrum components conceivably declines towards MFIR wavelengths faster than our simple analysis assumes.
We stress to the reader that we have deliberately chosen a conservative approach to estimating the non-thermal contamination in this study. The results we present here are therefore likely to represent an upper limit to the true degree of non-thermal contamination in our sample.
5.5 Variability
The two core-dominated objects 3C273 (catalog ) and PKS052136 (catalog ), observed by Spitzer, were included in our observations and this study for comparative purposes, because of the large amount of previous data available. It is possible to identify their non-thermal core/jet component contribution at MFIR wavelengths if a relatively short timescale flux variation is observed, since the synchrotron beamed component is thought to originate from a very compact region.
The MFIR emission from 3C273 has been noted to be variable, decreasing between IRAS (1983) and ISO (1995-98) observations in a way that is consistent with monitoring at other wavelengths (Meisenheimer et al., 2001). We can report that 3C273 has declined further still in MFIR emission since these previous observations, by a similar factor 2 between the IRAS and ISO data (see Figure 6). Because of the time scale of this variation, it is most likely due to a change in core synchrotron emission, since the cool extended dust is unlikely to vary on the current observing timescales of decades. This implies that, claimed ISO detections of thermal emission from dust underlying the powerful non-thermal emission in 3C273, are unlikely to have been correct. The far-infrared emission now lies well below that of the supposed thermal bump. Our data provide no evidence for the detection of the thermal component in the MFIR SED of 3C273.
The MFIR emission of the BL Lac object PKS0521-36 (catalog ) is also known to be dominated by its non-thermal component, however we do not see such strong evidence for variability.
5.6 Comparison with previous studies
Previous MFIR investigations have considered the relative contributions of thermal and non-thermal emission in radio galaxies and quasars (Hes et al., 1995, van Bemmel et al., 1998, Polletta et al., 2000 Cleary et al., 2007, Shi et al., 2005). Studies such as those by Polletta et al. (2000), Cleary et al. (2007) and Shi et al. (2005) fit radio to MFIR SEDs using various synchrotron and thermal infrared emission components. Our findings agree with the main conclusions from these studies that the proportion of objects with non-thermal contamination of the MFIR by synchrotron emitting components is small for an unbiased sample of radio-loud AGN.
In the context of unified schemes, we can also investigate the optical classifications of those objects we believe have a possibility for core non-thermal contamination of the MFIR thermal emission. Out of the 11 objects with possible non-thermal contamination from the cores, 6 are classified as WLRG and 5 as BLRG/Quasars. A large proportion of BLRG/Quasars with non-thermal contamination is what we might expect if these objects have a beamed component orientated close to the line of sight. Overall our results our consistent with unified schemes that require a beamed component for the BLRG/Quasar objects (e.g. Barthel, 1989).
For the WLRG – some of which are FRI galaxies – significant non-thermal contamination is consistent with the relatively stronger cores detected in FRI sources in general, as well as the detection of non-thermal cores in such sources at optical/IR wavelengths (Capetti et al., 2007, Chiaberge et al., 1999).
6 Summary
We have presented new MFIR and high frequency radio core data for a complete sample of powerful southern radio galaxies. We detect objects down to 0.5mJy at 24m, 8.4mJy at 70m and 83.6mJy at 160m, obtaining a uniquely high detection rate at 24 and 70m.
In addition, we have presented new high frequency radio core flux measurements, detecting radio cores for 59% of our complete sample. With these data we have made a conservative estimate of the non-thermal contribution to the MFIR continuum. Careful analysis of the SEDs for our entire sample reveals that non-thermal contamination of the MFIR is possible for a maximum of 30% of the sources in our sample.
An in-depth analysis of these data will be presented in a second paper (Dicken et al. 2008, in preparation).
References
- Archibald et al. (2001) Archibald, E. N., Dunlop, J. S., Hughes, D. H., Rawlings, S., Eales, S. A., & Ivison, R. J. 2001, MNRAS, 323, 417
- Barthel (1989) Barthel, P. D. 1989, ApJ, 336, 606
- Capetti et al. (2007) Capetti, A., Axon, D. J., Chiaberge, M., Sparks, W. B., Duccio Macchetto, F., Cracraft, M., & Celotti, A. 2007, A&A, 471, 137
- Chiaberge et al. (1999) Chiaberge, M., Capetti, A., & Celotti, A. 1999, A&A, 349, 77
- Cleary et al. (2007) Cleary, K., Lawrence, C. R., Marshall, J. A., Hao, L., & Meier, D. 2007, ApJ, 660, 117
- di Serego-Alighieri et al. (1994) di Serego-Alighieri, S., Danziger, I. J., Morganti, R., & Tadhunter, C. N. 1994, MNRAS, 269, 998
- Engelbracht et al. (2007) Engelbracht, C. W., Blaylock, M., Su, K. Y. L., Rho, J., Rieke, G. H., Muzerolle, J., & Padgett, D. L. 2007, ArXiv e-prints, 704
- Gizani & Leahy (2003) Gizani, N. A. B., & Leahy, J. P. 2003, MNRAS, 342, 399
- Golombek et al. (1988) Golombek, D., Miley, G. K., & Neugebauer, G. 1988, AJ, 95, 26
- Gordon et al. (2007) Gordon, K. D., Engelbracht, C. W., Fadda, D., Stansberry, J., Wachter, S., Frayer, D. T., & Rieke. 2007, ArXiv e-prints, 704
- Haas et al. (1998) Haas, M., Chini, R., Meisenheimer, K., Stickel, M., Lemke, D., Klaas, U., & Kreysa, E. 1998, ApJ, 503, L109+
- Haas et al. (2004) Haas, M., Müller, S. A. H., Bertoldi, F., Chini, R., Egner, S., Freudling, W., Klaas, U., Krause, O., Lemke, D., Meisenheimer, K., Siebenmorgen, R., & van Bemmel, I. 2004, A&A, 424, 531
- Heckman et al. (1992) Heckman, T. M., Chambers, K. C., & Postman, M. 1992, ApJ, 391, 39
- Heckman et al. (1994) Heckman, T. M., O’Dea, C. P., Baum, S. A., & Laurikainen, E. 1994, ApJ, 428, 65
- Hes et al. (1995) Hes, R., Barthel, P. D., & Hoekstra, H. 1995, A&A, 303, 8
- Holt et al. (2006) Holt, J., Tadhunter, C., Morganti, R., Bellamy, M., González Delgado, R. M., Tzioumis, A., & Inskip, K. J. 2006, MNRAS, 370, 1633
- Holt et al. (2007) Holt, J., Tadhunter, C. N., Gonzalez Delgado, R. M., Inskip, K. J., Rodriguez, J., Emonts, B. H. C., Morganti, R., & Wills, K. A. 2007, ArXiv e-prints, 708
- Hughes et al. (1997) Hughes, D. H., Dunlop, J. S., & Rawlings, S. 1997, MNRAS, 289, 766
- Impey & Gregorini (1993) Impey, C., & Gregorini, L. 1993, AJ, 105, 853
- Knapp et al. (1990) Knapp, G. R., Bies, W. E., & van Gorkom, J. H. 1990, AJ, 99, 476
- Makovoz et al. (2006) Makovoz, D., Roby, T., Khan, I., & Booth, H. 2006, in Presented at the Society of Photo-Optical Instrumentation Engineers (SPIE) Conference, Vol. 6274, Advanced Software and Control for Astronomy. Edited by Lewis, Hilton; Bridger, Alan. Proceedings of the SPIE, Volume 6274, pp. 62740C (2006).
- Meisenheimer et al. (2001) Meisenheimer, K., Haas, M., Müller, S. A. H., Chini, R., Klaas, U., & Lemke, D. 2001, A&A, 372, 719
- Morganti et al. (1993) Morganti, R., Killeen, N. E. B., & Tadhunter, C. N. 1993, MNRAS, 263, 1023
- Morganti et al. (1999) Morganti, R., Oosterloo, T., Tadhunter, C. N., Aiudi, R., Jones, P., & Villar-Martin, M. 1999, A&AS, 140, 355
- Morganti et al. (1997) Morganti, R., Oosterloo, T. A., Reynolds, J. E., Tadhunter, C. N., & Migenes, V. 1997, MNRAS, 284, 541
- Neugebauer et al. (1986) Neugebauer, G., Miley, G. K., Soifer, B. T., & Clegg, P. E. 1986, ApJ, 308, 815
- Polletta et al. (2000) Polletta, M., Courvoisier, T. J.-L., Hooper, E. J., & Wilkes, B. J. 2000, A&A, 362, 75
- Ricci et al. (2006) Ricci, R., Prandoni, I., Gruppioni, C., Sault, R. J., & de Zotti, G. 2006, A&A, 445, 465
- Rieke et al. (2004) Rieke, G. H., Young, E. T., Engelbracht, C. W., Kelly, D. M., Low, F. J., Haller, E. E., & Beeman, J. W. 2004, ApJS, 154, 25
- Rowan-Robinson (1995) Rowan-Robinson, M. 1995, MNRAS, 272, 737
- Sault et al. (1995) Sault, R. J., Teuben, P. J., & Wright, M. C. H. 1995, in Astronomical Society of the Pacific Conference Series, Vol. 77, Astronomical Data Analysis Software and Systems IV, ed. R. A. Shaw, H. E. Payne, & J. J. E. Hayes, 433–+
- Seymour et al. (2007) Seymour, N., Stern, D., De Breuck, C., Vernet, J., Rettura, A., Dickinson, M., Dey, A., Eisenhardt, P., Fosbury, R., Lacy, M., McCarthy, P., Miley, G., Rocca-Volmerange, B., Röttgering, H., Stanford, S. A., Teplitz, H., van Breugel, W., & Zirm, A. 2007, ApJS, 171, 353
- Shi et al. (2005) Shi, Y., Rieke, G. H., Hines, D. C., Neugebauer, G., Blaylock, M., Rigby, J., Egami, E., Gordon, K. D., & Alonso-Herrero, A. 2005, ApJ, 629, 88
- Tadhunter et al. (2007) Tadhunter, C., Dicken, D., Holt, J., Inskip, K., Morganti, R., Axon, D., Buchanan, C., González Delgado, R., Barthel, P., & van Bemmel, I. 2007, ApJ, 661, L13
- Tadhunter et al. (2002) Tadhunter, C., Dickson, R., Morganti, R., Robinson, T. G., Wills, K., Villar-Martin, M., & Hughes, M. 2002, MNRAS, 330, 977
- Tadhunter et al. (1993) Tadhunter, C. N., Morganti, R., di Serego-Alighieri, S., Fosbury, R. A. E., & Danziger, I. J. 1993, MNRAS, 263, 999
- Tadhunter et al. (1998) Tadhunter, C. N., Morganti, R., Robinson, A., Dickson, R., Villar-Martin, M., & Fosbury, R. A. E. 1998, MNRAS, 298, 1035
- Thomasson et al. (2003) Thomasson, P., Saikia, D. J., & Muxlow, T. W. B. 2003, MNRAS, 341, 91
- Tzioumis et al. (2002) Tzioumis, A., King, E., Morganti, R., Dallacasa, D., Tadhunter, C., Fanti, C., Reynolds, J., Jauncey, D., Preston, R., McCulloch, P., Tingay, S., Edwards, P., Costa, M., Jones, D., Lovell, J., Clay, R., Meier, D., Murphy, D., Gough, R., Ferris, R., White, G., & Jones, P. 2002, A&A, 392, 841
- van Bemmel et al. (2000) van Bemmel, I. M., Barthel, P. D., & de Graauw, T. 2000, A&A, 359, 523
- van Bemmel et al. (1998) van Bemmel, I. M., Barthel, P. D., & Yun, M. S. 1998, A&A, 334, 799
- Wills et al. (2004) Wills, K. A., Morganti, R., Tadhunter, C. N., Robinson, T. G., & Villar-Martin, M. 2004, MNRAS, 347, 771
- Wills et al. (2002) Wills, K. A., Tadhunter, C. N., Robinson, T. G., & Morganti, R. 2002, MNRAS, 333, 211