Formation of dispersive hybrid bands at an organic-metal interface
Abstract
An electronic band with quasi-one dimensional dispersion is found at the interface between a monolayer of a charge-transfer complex (TTF-TCNQ) and a Au(111) surface. Combined local spectroscopy and numerical calculations show that the band results from a complex mixing of metal and molecular states. The molecular layer folds the underlying metal states and mixes with them selectively, through the TTF component, giving rise to anisotropic hybrid bands. Our results suggest that, by tuning the components of such molecular layers, the dimensionality and dispersion of organic-metal interface states can be engineered.
The use of organic thin films in electronic devices requires the existence of electronic bands with high conduction properties. However, due to their weak intermolecular interactions, organic materials inherently have narrow bands and low electron mobility DimiAdvM02 . This is in contrast to inorganic crystals, in which strong metallic or covalent bonds between atoms cause charge carriers to be delocalized and to move in wide bands with high mobility. Organic-inorganic hybrid materials have been proposed as the ideal framework to merge the high carrier mobility of the latter with the advantageous properties of organic materials, i.e. their ease of processing and growth, low-cost, and tunability of electronic structure by organic synthesis DimiSci99 . In spite of being a promising avenue of research, this approach remains sustained on empirical bases. A conceptual picture at the molecular scale describing the cross talk between organic and metallic states and the formation of organic-metal (OM) hybrid bands is still missing. This can be provided by a detailed look into the properties of OM interfaces.
The electronic structure of the OM interface is determined by the interaction between molecular and metal states. This interaction causes re-alignment, splitting, and broadening of molecular states as a response to charge transfer, structural distortions, and hybridization with metal states Kahn . These processes usually mask the molecular thin film properties and the interface band structure is dominated by the highly dispersive metal states TautzNat06 . On the other hand, molecules at the OM interface can scatter WollPRL02 and confine Pennec metal surface states, mix with them Ferreri , or even change their dynamics ZhuJPCB05 ; KanazawaJACS07 . Hence, only through a detailed understanding of the basic principles behind these interactions one can envisage designing and tuning the properties and, therefore, the functionality of an OM interface.
In this Letter, we show that an OM hybrid band is formed at the interface between the donor-acceptor complex TTF-TCNQ (tetrathiafulvalene-tetracyanoquinodimethane) and a Au(111) substrate. The band is characterized by both a reduced dimensionality imprinted by the overlayer structure and a large dispersion reminiscent of its metallic character. By means of a combined scanning tunneling spectroscopy (STS) and density functional theory (DFT) study we find that the band originates from the selective chemisorption of one of the molecular components (TTF) on the Au(111) surface. Band structure calculations unravel the complex mixing of metal and molecular states. Our results allow us to obtain a conceptual understanding about the formation of OM hybrid bands.
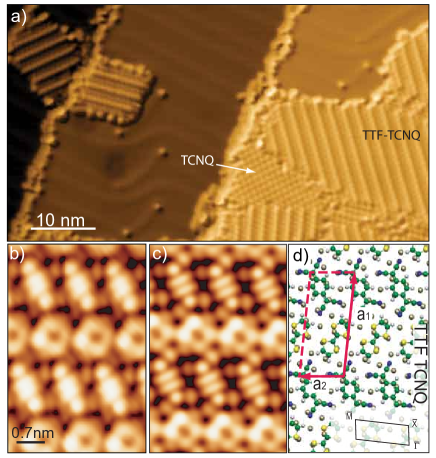
The experiments were carried out in a custom-built scanning tunneling microscope (STM), in ultra-high vacuum (UHV) and at a temperature of 5 K. Both TTF and TCNQ molecules were deposited by UHV sublimation (crucible temperature 80∘C) from the solid compound (Aldrich) onto an atomically clean Au(111) surface held at room temperature. Under these conditions, TTF and TCNQ self-assemble into mixed domains of alternating rows of donor and acceptor species with a 1:1 stoichiometry [Fig. 1(a)]. The TTF-TCNQ molecular solid bulk phase is an organic metal with a one-dimensional-like band structure due to the -stacking of each component and to the transfer of 0.6 electrons from the donor -stacks (TTF) to the acceptor ones (TCNQ) TTFTCNQreview . However, on the Au(111) surface the TTF-TCNQ layer has different properties because both TTF and TCNQ lie parallel to the surface, as we can determine from their intramolecular structure [Fig. 1(b)]. Such adsorption structure is confirmed by first principles calculations using density functional theory within the generalized gradient approximation VASP . The relaxed structure of a commensurate TTF-TCNQ layer on a Au(111) surface [Fig. 1(c,d)] was calculated following the experimental unit cell footnote_ss . We find that the molecular layer is bonded to the gold surface through TTF via two S-Au bonds per molecule, as in Ref. TorrentePRL07 . On the contrary, TCNQ molecules interact weakly with the metal surface.
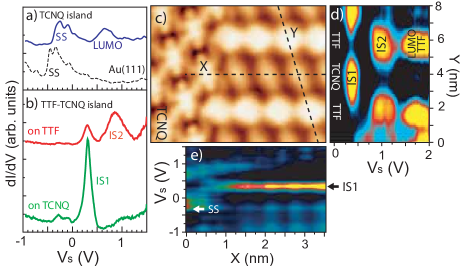
Scanning tunneling spectroscopy (STS) measurements reveal that the electronic structure of the TTF-TCNQ/Au(111) interface cannot be simply understood within a conventional picture of molecular level alignment. In Fig. 2 we compare the differential conductance (dI/dV) spectrum of a pure TCNQ island with that of the mixed phase. The broad LUMO resonance at 0.7 V on pure TCNQ islands [Fig. 2(a)] contrasts with a sharp peak observed at 0.3 V on TCNQ rows in the mixed domains [IS1 in Fig. 2(b)]. In addition, the distinctive onset of the Au(111) surface state (SS) is not observed in the TTF-TCNQ layer, while another feature (IS2) at 0.8 V appears on the TTF rows. A more complete picture of the local density of states (LDOS) of the mixed phase is provided by mapping dI/dV spectra along the main directions of the layer [Figs. 2(d,e)]. There, features IS1 and IS2 appear spatially separated and localized along the TCNQ and TTF rows, respectively. However, the origin of these peaks cannot be directly assigned to resonant tunneling through molecular states, as TTF shows its LUMO resonance at 1.7 V, in agreement with ref. TorrentePRL07 . Furthermore, the LUMO peak in the pure TCNQ island vanishes as we enter in the mixed domain [Fig. 2(e)]. Therefore, these results suggest that the chemisorption of the TTF-TCNQ layer distorts the electronic structure of the Au(111) surface, causing additional features to appear in the unoccupied LDOS.
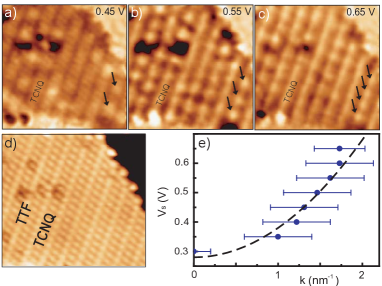
A hint about the origin of peaks IS1 and IS2 in the spectra is the dispersive behavior of the former. dI/dV maps taken at sample bias V above the IS1 peak exhibit oscillatory patterns centered at the TCNQ rows [Fig. 3] with a periodicity larger than the intermolecular distance and changing with V. This is a distinctive fingerprint of (in-plane) quantum interference of electron states with energy eV Avouris93 . Furthermore, these oscillations are characteristic of a quasi-one dimensional electron band, since they are only observed dispersing along the TCNQ rows. The change in wavelength with V follows a parabolic dispersion relation with effective mass )me at 0.28 eV above the Fermi energy E [Fig. 3(d)]. Electronic bands of molecular solids exhibit effective masses larger than me LowDimMetBook ; KochPRL06 ; KollerSci07 . In contrast, the effective mass found here is characteristic of metal states, indicating that the IS1 feature is related to the underlying metal states TautzNat06 ; ZhuJPCB05 .
To unravel the molecular and metal character of the features IS1 and IS2 we have calculated the density of states (DOS) of the TTF-TCNQ layer on Au(111) in the relaxed structure shown in Fig. 1(d). The role of molecular states is extracted by projecting the DOS (PDOS) on TTF and TCNQ molecular orbitals [Fig. 4(a)]. We find that each molecular component maintains its donor/acceptor character on the metal surface. The TCNQ interaction with the surface is weak, the PDOS peaks keep their molecular character upon adsorption. Its LUMO aligns with E, close to the TTF HOMO, becoming singly occupied. The TTF HOMO suffers a notorious broadening as a consequence of its mixing with gold states, and becomes partially unoccupied too. Hence, the interaction of the TTF-TCNQ layer on Au(111) is essentially conducted by the TTF molecule.
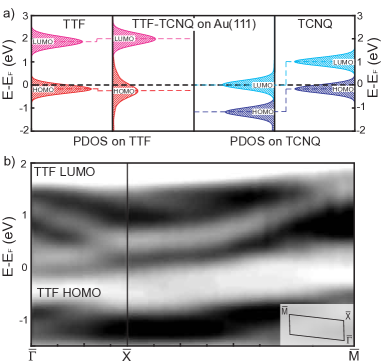
The PDOS diagrams of Fig. 4(a) also show that the first unoccupied molecular state of the TTF-TCNQ film lies at 2.0 eV (TTF LUMO). The DFT results thus confirm that the origin of the features IS1 and IS2 in the experimental data cannot be simply ascribed to the specific molecular orbitals. The PDOS above E is rather dominated by the tail of the TTF HOMO broadened as a consequence of its hybridization with metal states. The nature of this mixing can be partially explored by resolving the PDOS vs. electron momentum along the main directions of the molecular surface Brillouin zone (SBZ, cf. note1 ). Fig. 4(b) reveals the existence of two features in the energy region between the TTF HOMO and LUMO resonances. These features are an evidence of a more complex substructure hidden behind the broad TTF HOMO resonance.
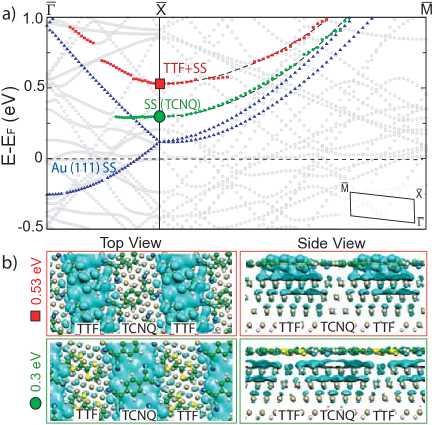
To decipher the role of the metal surface, next we analyze the calculated band structure along the and directions note1 . Two interface bands dispersing away from the point [color points in Fig. 5(a)] are found. The lower (green) band shows dispersion only along the molecular rows, while the higher (red) band shows two dimensional anisotropic dispersion in both directions. The formation of these two interface bands can be well understood with the help of a simple model Kittel of quasi-free electrons in a weak periodic potential along one surface direction: (i) the charge re-distribution induced by the organic layer modulates the potential of the Au(111) surface along the direction with a new periodicity that folds the surface and bulk bands of the metal, (ii) the coupling with the overlayer opens gaps at the SBZ boundary ( point) giving rise to the upper (even) and lower (odd) split hybrid bands (with respect to the TTF rows).
The hybrid character of these bands originates from a mixture of folded bulk and surface metal states with TTF states, whose strong influence has already been extracted in Fig. 4(b). The most interesting evidence of selective mixing of molecular states with the Au(111) SS is found in partial charge density plots at . The lower state (at 0.3 eV) has no molecular character and is located underneath the TCNQ rows (Fig. 5(b) lower panel). This is in accord with TCNQ states not contributing to the hybrid band. Furthermore, its symmetry prevents the lower SS branch from mixing with the TTF HOMO and thus leaves it essentially as the SS modulated by the new periodicity imposed by the overlayer. The higher state (at 0.53 eV) appears centered at the TTF rows and has considerable weight on TTF (Fig. 5(b) upper panel). As they disperse away from E both bands lose molecular weight and essentially recover the character of the corresponding SS branches. For the lower band, coupling with the TTF HOMO and folded bulk metal states introduces broadening away from the point and closer to the point thus becoming a surface resonance.
Based on these theoretical results we can now associate the two observed peaks in the dI/dV spectra with the two calculated interface OM hybrid bands: IS1 with the lower (green) one and IS2 with the higher (red) one. The calculated partial charge density maps at [Fig. 5(b)] are in good agreement with the spatial location of IS1 and IS2 found in the experimental dI/dV profiles [IS1 on TCNQ rows and IS2 on TTF rows in Fig. 2(d)]. Hence, the peak structure in the STS spectra is mostly originated from band states lying close to the point, because only at this region of the SBZ they are purely localized at the interface. There, the lower band is fairly flat across the rows and disperses parallel to the TCNQ rows in agreement with the one-dimensional dispersion and sharp line shape of the peak IS1. IS2 appears as a broader peak in the experimental dI/dV spectra in consistency with the two-dimensional anisotropic dispersion of the higher band.
In summary, we have shown that the co-adsorption of TTF and TCNQ, an electron donor and acceptor, on Au(111) gives rise to a mixed phase with a characteristic interface band structure. While the TCNQ is essentially unperturbed by the underlying surface, the TTF is hybridized with the Au(111) surface. The result is the formation of two interface bands with both molecular and metal character. They exhibit a free-electron metal-like dispersion and the anisotropic structure of the molecular layer. Our results suggest that tuning the strength of donor-metal interaction or spacing between the TTF rows may allow to engineer the organic-inorganic interface band structure and, hence, the functionality of the molecular thin film.
We thank J. Fraxedas and M. Persson for fruitful discussions and the DFG for support though Sfb 658. N.G-L. and A.A. thank the Basque Department of Industry (ETORTEK programme), UPV/EHU, DIPC, and MEC for financial support. I.F.-T. thanks the Generalitat de Catalunya for her research grant. N.L. thanks MEC (No. FIS2006-12117-C04-01).
References
- (1) C.D. Dimitrakopoulos and P.R.L. Malenfant, Adv. Mat. 14, 99 (2002).
- (2) C.R. Kagan, D.B. Mitzi, and C.D. Dimitrakopoulos, Science 286, 945 (1999).
- (3) A. Kahn, N. Koch, and W. Y. Gao, J. Pol. Sci. B - Pol. Phys. 41, 2529 (2003).
- (4) R. Temirov, S. Soubatch, A. Luican, and F. S. Tautz, Nature 444, 350 (2006).
- (5) S. Lukas, G. Witte, and Ch. Wöll, Phys. Rev. Lett. 88, 028301, (2001).
- (6) Y. Pennec et al., Nature Nanotechnology 2, 99 (2007).
- (7) A. Ferretti et al., Phys. Rev. Lett. 99, 046802 (2007).
- (8) C. D. Lindstrom, M. Muntwiler, and X. Y. Zhu, J. of Phys. Chem. B 109, 21492 (2005).
- (9) K. Kanazawa et al., J. Amer. Chem. Soc. 129, 740 (2007).
- (10) J. Fraxedas, in Molecular Organic Materials: from Molecules to Crystalline Solids (Cambridge University Press, Cambridge, 2006).
- (11) G. Kresse, J. Fürthmuller, Comput. Mater. Sci. 6, 15 (1996)
- (12) The Au(111) surface is described using a periodic supercell with a four layers Au slab passivated with H atoms ArnauPRL05 at the vacuum metal interface opposite to where the adsorbed molecular overlayer sits. As shown in Fig. 5 (blue band), in the absence of molecular overlayer the energy position of the surface state at the point is -0.3 eV and the effective mass is m∗=0.29me, both in good agreement with experimental values ReinertPRB01 .
- (13) C. Corriol et al., Phys. Rev. Lett. 95, 176802 (2005).
- (14) F. Reinert et al., Phys. Rev. B 63, 115415, (2001).
- (15) I. Fernandez-Torrente et al., Phys. Rev. Lett. 99, 176103 (2007).
- (16) Y. Hasegawa and Ph. Avouris, Phys. Rev. Lett. 71, 1071 (1993).
- (17) N. Toyota, M. Lang, and J. Müller, ”Low-dimensional Molecular Metals”, (Springer, 2007).
- (18) N. Koch et al., Phys. Rev. Lett. 96, 156803 (2006).
- (19) G. Koller et al., Science 317, 351 (2007).
- (20) The surface Brillouin zone is defined by the points =(0,0), =(1/2,0) and =(1/2,1/2) in units of the reciprocal unit cell vectors b1 and b2. and correspond to the directions across and along the molecular rows, respectively.
- (21) Ch. Kittel, ”Introduction to Solid State Physics”, (Wiley, New York. Ed. 5, 1976)
- (22) I. Horcas et al., Rev. Sci. Instrum. 78 , 013705 (2007).
- (23) J. Tersoff and D. R. Hamann, Phys. Rev. Lett. 50, 1998 (1983).