Current log-periodic view on future world market development
Abstract
Applicability of the concept of financial log-periodicity is discussed and encouragingly verified for various phases of the world stock markets development in the period 2000-2010. In particular, a speculative forecasting scenario designed in the end of 2004, that properly predicted the world stock market increases in 2007, is updated by setting some more precise constraints on the time of duration of the present long-term equity market bullish phase. A termination of this phase is evaluated to occur in around November 2009. In particular, on the way towards this dead-line, a Spring-Summer 2008 increase is expected. On the precious metals market a forthcoming critical time signal is detected at the turn of March/April 2008 which marks a tendency for at least a serious correction to begin.
In the present extended version some predictions for the future oil price are incorporated. In particular a serious correction on this market is expected in the coming days.
05.45.Pq, 52.35.Mw, 47.20.Ky
Keywords: Complex systems, Financial markets, Fundamental laws of nature
E-mail address: Stanislaw.Drozdz@ifj.edu.pl
1 Introduction
The financial dynamics is a multiscale phenomenon and therefore the question which of its properties are scale invariant and which are scale characteristic refers to the essence of this phenomenon. There exists strong related evidence that at least a large portion of the financial dynamics is governed by phenomena analogous to criticality in the statistical physics sense [1]. In its conventional form criticality implies a scale invariance [2] of a properly defined function characterizing the system:
| (1) |
A constant then describes how the properties of the system change under rescaling by the factor . The general solution to this equation reads [3]:
| (2) |
where the first term represents a standard power-law that is characteristic of continuous scale-invariance with the critical exponent and denotes a periodic function of period one. This general solution can be interpreted in terms of discrete scale invariance. Due to the second term the conventional dominating scaling acquires a correction that is periodic in . Imprints of such oscillations can often be identified in the financial dynamics [4, 5, 6, 7]. To make a proper mapping one defines , where denotes the clock time labelling the original price time series and represents a distance to the critical point . The emerging sequence of spacings between the corresponding consecutive repeatable structures at - as seen in the linear scale - forms a geometric progression according to the relation . The time points thus correspond to the accumulation of such oscillations and, in the context of the financial dynamics such points mark a reversal of the trend. An important related element, for a proper interpretation and handling of the financial patterns as well as for consistency of the theory, is that such log-periodic oscillations manifest their action self-similarly through various time scales [7]. This applies both to the log-periodically accelerating bubble market phase as well as to the log-periodically decelerating anti-bubble phase.
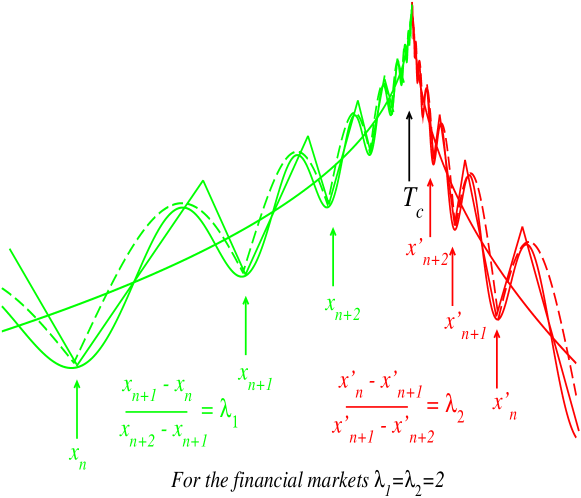
Fig. 1 schematically illustrates the relevant structures on one particular time scale. The thick solid line corresponds to the first term in Eq. 2 and it represents the global market trends on both sides of , increasing and decreasing respectively. On both these sides the log-periodic oscillations are superimposed, accelerating and decelerating correspondingly. These oscillations are generated by the second term in Eq. 2. A specific form of the periodic function in this Equation is as yet not provided by any first principles. Since in the corresponding methodology the oscillation structure carries the most relevant information about the market dynamics, for transparency one uses the simplest representations for such a function. One reasonable possibility is the first term of its Fourier expansion,
| (3) |
This implies that . Already such a simple parametrization allows to properly reflect the contraction of oscillations, especially on the larger time scales. On the smaller time scales just replacing the cosine by its modulus equally well describes oscillations and in addition it often even better follows departures of the market amplitude from its average trend. Another simple - from the market perspective an even more realistic - representation of is to use an asymmetric saw-like function. Such three possibilities are indicated in Fig. 1. What they all have however to obey is the same contraction ratio (preferred scaling factor) expressed by and . For the real markets more and more evidence is collected that the preferred scaling factor and is common to all the scales and markets [8] both, in the log-periodically accelerating bubble as well as in the log-periodically decelerating anti-bubble phases [9]. We thus set . Universality of the , establishes very valuable and in fact crucial constraint on possible forms of the analytic representations of the market trends and of the oscillation patterns, including the future ones. This greatly amplifies a predictive power of the corresponding methodology. Also very helpful in this respect is the requirement of self-similarity which helps to clarify the significance of a given pattern and allows to determine on what time scale it operates. The present contribution provides further arguments in this favour.
2 World stock market since 2003
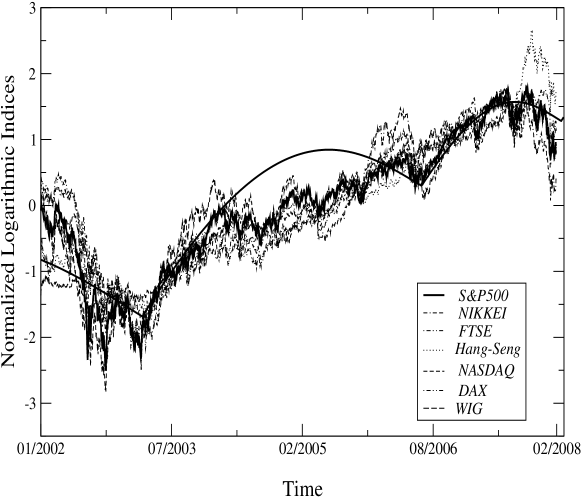
As far as the trends are concerned the contemporary stock market indices world-wide are remarkably synchronized. This is one of the characteristics reflecting the world globalization [10]. For the recession period since 2000 this effect is illustrated in ref. [9]. This period ends approximately in the first months of 2003 and the stock markets synchronously enter the bullish period. As is shown in Fig. 2 all the indices assume the up trend. There of course are some differences in the magnitude of oscillation amplitudes but the common similarity of this oscillation pattern is clearly visible. Due to this similarity in the following we shall concentrate mostly on the American SP500 index because it represents the world largest market and is thus expected to provide the most reliable indicator of the global world market trends.
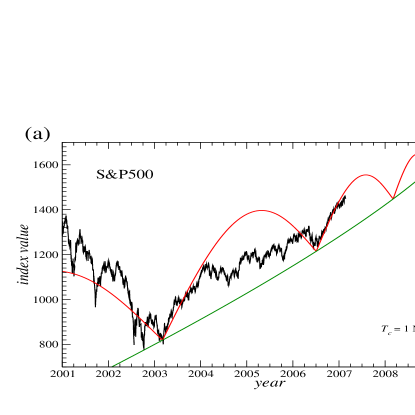
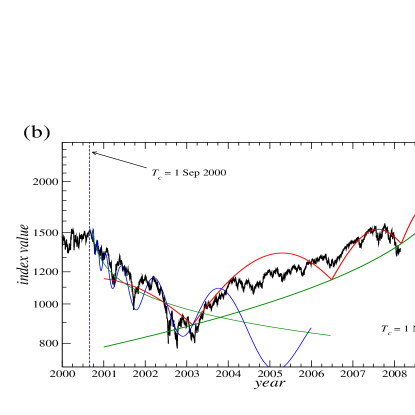
An early (made in February 2007, shown also at the time of FENS07 Conference) attempt to log-periodically grasp the large scale SP500 patterns and to provisionally estimate duration of its present increasing phase, before it enters recession of comparable magnitude as the one between mid 2000 and early 2003,is shown in Fig. 3. The corresponding critical time points to the turn of October/November 2009. This scenario thus indicates that until this time the market, on average, should preserve its up trend. An extra argument in favour of this scenario is that it was predicting an intermediate sizeable correction in around the period November 2007- February 2008 and it took place indeed. It however also demands that in around the end of February 2008 (time of writing this contribution) this correction terminates and the index starts rising till at least late Summer before it starts correcting again. The reason for ignoring in this scenario the mid 2004 correction seen in the SP500 and comparable in magnitude to the one (relevant) in May-June 2006 is that this former correction is to be interpreted a remnant of the bear, since September 2000 log-periodically decelerating market component. The related part of this component is also drawn in the panel (b) of Fig. 3. This panel includes the SP500 data up to present and, accordingly, the global trend is updated, but the log-periodic structure remains unchanged.
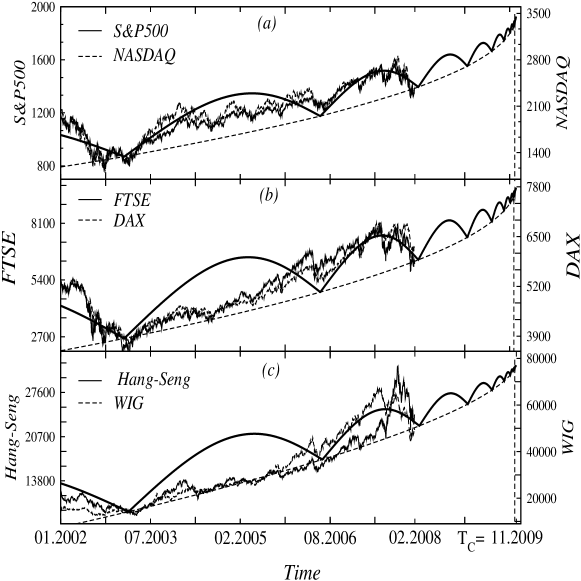
The above updated scenario, including the real data up to present, for the three pairs of indices, SP500 and Nasdaq, DAX and FTSE, HangSeng and WIG (Poland), is shown in the three panels of Fig. 4. The log-periodic component remains here the same as the one in Fig. 3. The main reason for such a selection of indices presented in Fig. 4 is to show some from among the world most important ones whose oscillation patterns remain in a satisfactory agreement with the same common scenario, as well as those (HangSeng and WIG) whose blind relating to such a scenario may seem pointless. Let us recall here however a phenomenon of the ”super-bubble” [8]. This is an effect that from time to time takes place in the financial dynamics and whose identification appears relevant for a proper interpretation of the financial patterns with the same universal value of the preferred scaling factor . This phenomenon of a ”super-bubble” is a local boost, itself evolving log-periodically, superimposed on top of a long-term bubble and seen as an extra acceleration of the price increase. Such a ”super-bubble” then crashes and the system returns to a normal bubble state that eventually crashes at the time determined by the long-term patterns. Two spectacular examples of such a phenomenon are provided by the Nasdaq in the first quarter of 2000 and by the gold price in the beginning of 1981 [8]. It seems very likely to us that the fast increases and then even faster decreases that we see in the last two indices of Fig. 4 during the period June 2006 - February 2008 constitute further examples of the ”super-bubbles” and the corresponding markets have just returned to their normal long-term (since March 2003) up trend and an ultimate critical time may very well coincide with the same common scenario.
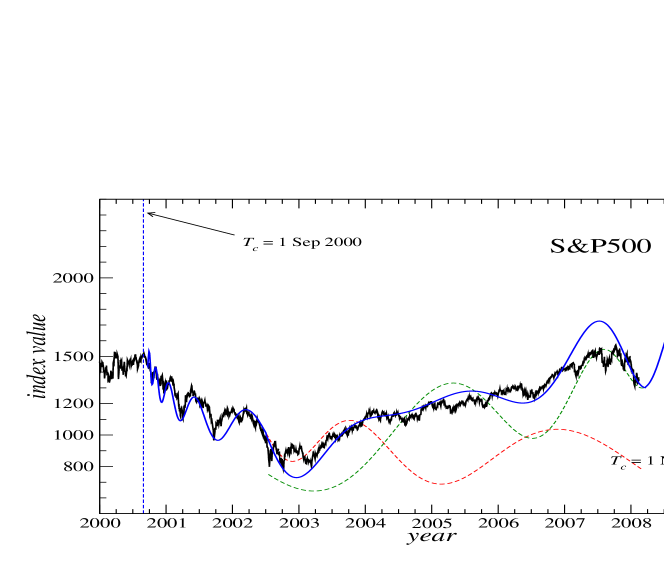
In ref. [11] a speculative scenario for the stock market (SP500) development in the time period 2000 - 2010 was invented by representing the market index as a superposition of the two components: one declining and log-periodically decelerating since September 2000 and the second one rising and thus log-periodically accelerating. Based on the longest possible time scale (since 1800) log-periodic representation [8] for this index, the critical time for this second component was provisionally estimated in around September 2010. Time verified that so far this scenario makes a lot of sense. In particular, a spectacular increase in 2007 as well as the reverse of the increasing trend by the end of the year was predicted. Recall that this scenario was presented in November 2004. These facts encourage further its elaboration. Since, as discussed above, we now have a more precise estimate for the end of the present long-term bull market phase the scenario under consideration can be improved. An accordingly updated variant of this scenario is shown in Fig. 5. Interestingly, during the year 2007 this theoretical market representation opened room for an even stronger increase than what the SP500 has performed. Some other markets, like the ones shown in the panel (c) of Fig. 4, made however use of this freedom and executed a more proportional detour.
3 Precious metals market
Some preliminary evidence already exists that the log-periodic oscillations may also accompany the commodities market dynamics during some more speculative periods. Such patterns have been identified on the gold market [8] during the time period 1978-1982, in this case including a very spectacular ”super-bubble” before the ultimate reverse of the long-term trend, and on the oil futures market in the years 1998-2004 [11]. In this connection it needs to be also emphasized that the same preferred scaling factor as for the stock market turns out here appropriate.
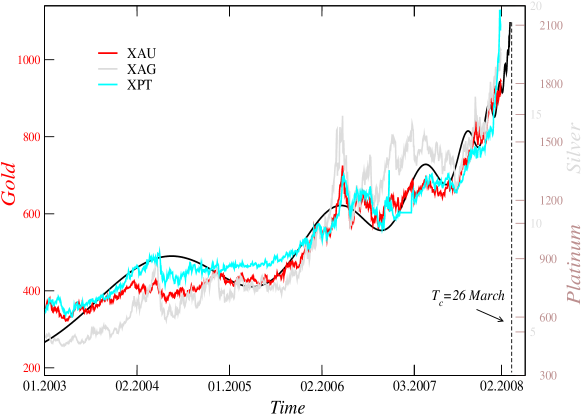
After many years of stagnation the precious metals market revitalized starting approximately in the second half of the 2000-2003 stock market recession period. The following development, at least partly driven by speculative activity, elevated the precious metals prices in a relatively short period of time to the level a factor of 3 to 4 higher. This is illustrated in Fig. 6 which shows the gold, the silver and the platinum price changes during the period January 2003 - February 2008. The oscillation patterns of all these prices resemble each other and, in addition, they quite convincingly coincide with the log-periodic structure which points to the turn of March/April 2008 as the critical time . Whether this indicates an ultimate reversal of the precious metals present price trends in around this time or only a sizeable (20-30) correction cannot be settled at this stage of the development. If the later possibility is to occur, i.e., after such a correction the market starts returning to the previous highs, then - in the spirit of self-similar log-periodicity [7] - it is expected to assume increase towards significantly higher levels and this market phase should last for another 3-4 years in order to complete the full log-periodic cycle on the appropriately longer time horizon, such that the whole log-periodic structure seen in Fig. 6 constitutes its self-similarly nested substructure. It seems also likely that the last few months accelerated increases, especially on the platinum market, can be interpreted in terms of a ”super-bubble”. In any case however at the indicated above one may expect the beginning of a significant correction on the precious metals market.
4 Oil market
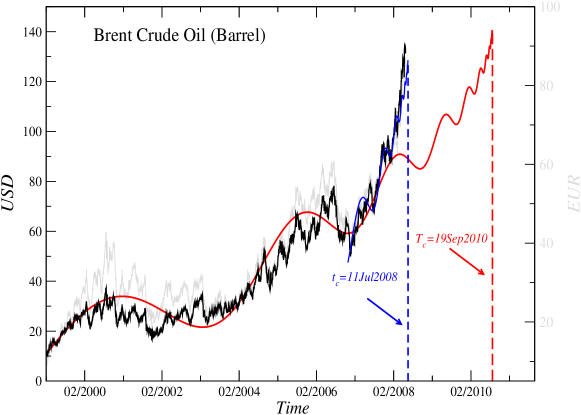
(Note added on June 23, 2008) Time satisfactorily verified the above prediction for the precious metals market. This encourages applying the same methodology to another commodity market - the oil market - where the prices expressed in terms of the USD went up almost a factor of three over the past one year. Our log-periodic interpretation of the underlying price dynamics over the time period 2000-2010 is illustrated in Fig. 7. The past year sharp increase turns out to be transparently log-periodic with and the related critical time corresponds to the first decade of July 2008. Consequently, during the Summer that follows the oil prices are likely to drop down even below 100 USD. From the longer time perspective, since about 2000, this ”super-bubble” decay is however going not to constitute an ultimate reverse of the oil up trend. On this longer time scale the same universal preferred scaling factor opens room for the continuation of increases to similar or even somewhat higher levels and the estimated critical time setting the dead-line for this long term increase corresponds to the late Summer in 2010, thus several months after the stock market enters a serious recession.
JS thanks the Foundation for Polish Science for financial support through the Alexander von Humboldt Honorary Research Fellowship.
References
- [1] D. Sornette, Why Stock Markets Crash: Critical Events in Complex Financial Systems, (Princeton University Press, Princeton, 2003).
- [2] H.E. Stanley, Introduction to Phase Transitions and Critical Phenomena, (Oxford University Press, New York, 1971).
-
[3]
J. Nauenberg, J. Phys. A 8, 925 (1975);
G. Jona-Lasinio, Nuovo Cimento 26B, 99 (1975) - [4] D. Sornette, A. Johansen, J.-P. Bouchaud, J. Phys. I France 6, 167 (1996)
- [5] J.A. Feigenbaum, P.G.O. Freund, Int. J. Mod. Phys. B 10, 3737 (1996)
- [6] N. Vandevalle, M. Ausloos, Ph. Boveroux, A. Minguet, Eur. Phys. J. B 4, 139 (1998)
- [7] S. Drożdż, F. Ruf, J. Speth, M. Wójcik, Eur. Phys. J. B 10, 589 (1999)
- [8] S. Drożdż, F. Grümmer, F. Ruf, J. Speth Physica A 324, 174 (2003).
- [9] M. Bartolozzi, S. Drożdż, D. B. Leinweber, J. Speth, A. W. Thomas, Int. J. Mod. Phys. C 16, 1347 (2005)
- [10] S. Drożdż, F. Grümmer, F. Ruf, J. Speth, Physica A 294, 226(2001).
- [11] S. Drożdż, F. Grümmer, F. Ruf, J. Speth, in Practical Fruits of Econophysics: Proceedings of the Third (2004) Nikkei Econophysics Symposium, ed. H. Takayasu, Springer, 2006, p. 93; available also as arXiv:physics/0503006