Simulating the ISM in Global Models of Disk Galaxies
Abstract
Until recently, simulations that modeled entire galaxies were restricted to an isothermal or fixed 2- or 3-phase interstellar medium (ISM). This obscured the full role of the ISM in shaping the observed galactic-scale star formation relations. In particular the Kennicutt relation suggests that star formation rates depend in a simple way on global galactic quantities, such as mean gas mass surface density and dynamical time. Contrary to this, observations of nearby star-forming regions, including images from the Spitzer telescope, show that all the way down to “local-scales” ( parsecs) star formation is a highly clustered process with the gas existing at a wide range of densities and multiple phases, and seemingly decoupled from the larger-scale Galaxy. Many different physical processes appear to be influencing the star formation rate, including heating and cooling of the gas, “turbulent” energy injection from outflows, winds and supernova blastwaves, ionization, and magnetic field support. Here we present results from global simulations of disk galaxy star formation that include a fully multiphase ISM and compare to simpler isothermal models. We also investigate the effect of background heating. We discuss the process of giant molecular cloud formation as one of the possible links between the galactic and local scales of star formation.
1 Introduction
Lack of a detailed understanding of the star formation process is one of the main factors limiting theoretical and numerical models of galaxy formation and evolution. The relatively simple gas dynamics and star formation relations exhibited by galaxies on their global (kpc) scale (e.g. Kennicutt 1998), mask the true complexity that is revealed from close examination of star-forming regions on their “local” scale, parsecs, typically inside giant molecular clouds (GMCs). Here it is suspected that star formation is a result of a complex interplay and competition between, on the one hand, self-gravity and compressional processes such as shocks and, on the other hand, various processes that help support the gas by generating thermal, radiation, magnetic, “turbulent” (i.e. due to nonthermal motions) and cosmic ray pressures. Many of these latter processes are driven by the newly-formed stars, through their protostellar outflows, winds, radiation, and supernovae.
Star formation is a highly clustered process (e.g. Lada & Lada 2003), and the gas that is forming stars at high efficiency, i.e. in star-forming clumps that are the progenitors of star clusters, is typically at a much higher pressure than the ambient galactic scale ISM: it is effectively decoupled. This is also illustrated by the fact that only a small fraction of the total gas mass in the star-forming part of a galaxy is actively forming stars. Thus the observed correlations between total gas mass surface density, , and star formation rate surface density, are somewhat mysterious. Using disk averages, Kennicutt (1998) finds in a sample of normal spiral galaxies and circumnuclear starbursts. An equally good description is , where is the orbital time (at the outer radius of the star-forming disk). More local (kpc scale) regions of galaxies follow similar average relations, but with a wider scatter (e.g. Kennicutt et al. 2007). To understand the connection between global star formation relations and the scale of structures actually involved in star formation, it seems clear that we need to understand the process of dense, cold cloud formation from the diffuse ISM, which requires resolution of the multiphase nature of the gas.
Until recently, simulations have struggled to connect global galactic dynamics with a detailed multiphase treatment of the ISM. The difficulty of resolving parsec-scale physics over tens of kiloparsecs has meant that previous simulations have focused either on a small volume of the galaxy where the ISM can be properly modeled (Slyz et al., 2005), or simulated the whole galaxy at the cost of an isothermal or fixed 2 or 3-phase temperature ISM (Li et al., 2005; Robertson, Yoshida, Springel, & Hernquist, 2004). However, more recent work has begun to bridge this gap and include a self-consistent multiphase ISM in global galaxy models (Tasker & Bryan, 2006, 2008; Wada & Norman, 2007). By leading to a better understanding of the physical processes that control galactic star formation rates, these simulations can also yield insights into the uncertainties involved in using simplified models of the thermodynamics and phase structure of the ISM in larger cosmological simulations.
Here, we present global galaxy disk simulations with different ISM properties and compare their gas structure and star formation rates. We also present preliminary results on dense cloud formation, especially with regards to cloud rotation.
2 Global Galaxy Models
To explore the effects of including a self-consistent multiphase ISM in global galaxy models, we compared three galaxy simulations with different ISM properties (see Tasker & Bryan 2008 for more details). In the first model (ISM #1), the gas was allowed to cool radiatively. In our second model (ISM #2), an additional fixed background heating term was included to represent photoelectric heating. In our final model (ISM #3), the gas temperature was fixed at K. The effects of including feedback from Type II supernovae via thermal energy injection were also explore in models #1 and #2.
The simulations were run using the 3D hydrodynamics code, Enzo, which is an adaptive mesh refinement code well suited to modeling media where a range of temperatures and densities are present.
The initial set-up for each simulation is an isolated, pure gas Milky Way-sized disk, sitting in a static NFW dark matter potential. The density profile matched that of the luminosity of a disk galaxy; exponential in the radial direction and height profile.
The disk initially fragments through gravitational instability and forms stars. The results presented here are taken 377 Myrs after the start of the simulation, when the disk has settled down to an approximately constant star formation rate.
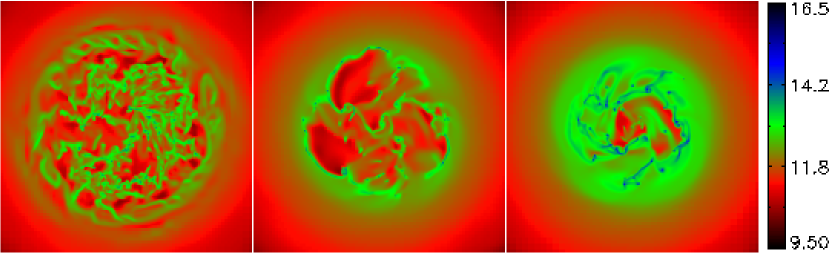
Figure 1 shows the gas mass surface density, , for the three different ISM types. The difference in the gas structure is very noticeable, but all exhibit fragmentation out to a well-defined radius. Beyond this radius, there is still plenty of gas, but it is gravitationally stable and does not form stars. In the case where we include background heating (ISM #2), the disk fragments out to a smaller radius than in ISM #1, because the heating provides an extra pressure against the fragmentation. The structure of the fragmented region also differs significantly, showing large voids of low density, hotter gas. In ISM # 3, where the temperature is fixed, a different structure is seen again. The increased temperature in the disk results in a much higher Jeans length for gravitational collapse, producing larger dense gas clouds than in either of the other two models.

A more quantitative view of the ISM of these galaxies is shown via the probability density functions (PDFs) of gas density (weighted by volume) in Figure 2. The first two ISM models are shown for runs with and without feedback from Type II SNe, which is implemented via localized heating of gas around star cluster particles in the simulation. What is obvious from this figure is that, while the medium and low density gas show significant differences from plot to plot, the high density end takes a far more uniform shape. In the left panel, showing results from ISM #1, the solid line picks out a lognormal profile that is a reasonable fit for the high density end of the distributions. These results show that SN feedback has relatively little impact on the volume fraction of dense gas. This volume fraction is also fairly invariant between the different ISM models considered here. This may help to explain the universality of the Kennicutt relation in different galactic environments, if the star formation rate from dense gas scales as the mass of dense gas divided by the local galactic dynamical time (see Elmegreen (2002) for a further discussion). One possible physical mechanism that can produce such a scaling is the triggering of active star-forming regions by GMC-GMC collisions (Tan, 2000).
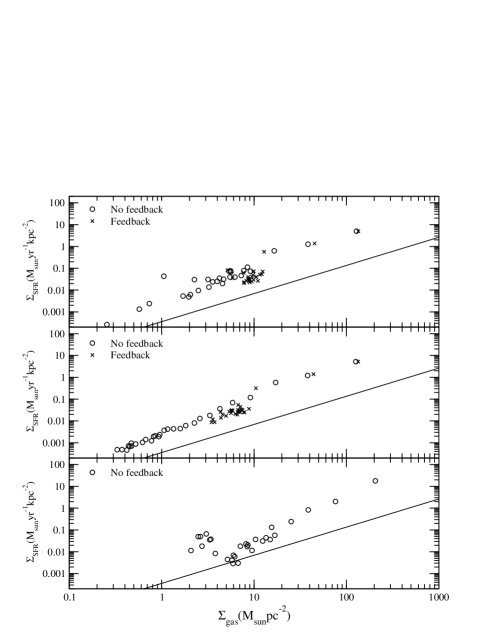
Figure 3 shows the Kennicutt relation of globally-averaged vs. for all galaxy models. The observed gradient is reproduced well in both ISM #1 and ISM #2, but less well in the isothermal case. Despite this success, the star formation rate is over-estimated by every model. The inclusion of feedback does reduce the discrepancy, but only by a small factor. However, because the minimum cell size in these simulations is typically 25-50 pc, there is considerable freedom to choose the normalization of the star formation efficiency in the subgrid model. In the simulations shown here, Tasker & Bryan (2008) adopted a formation efficiency of 5% per dynamical time in cells that met certain criteria, namely a density above a critical density, a gas mass greater than the Jeans mass, convergent gas flow into the cell, and a cooling time less than the dynamical time (for non-isothermal models). The critical density adopted for these simulations was small: , so that a large volume fraction of the gas could be involved in star formation. Improved star formation subgrid models are being developed to more closely match observed star formation efficiencies, and these will likely lead to a lower normalization of the simulated Kennicutt relation.
3 Dense Cloud Formation and Cloud Rotation
The ability to model the structure of the ISM on global scales opens a new door in the study of star formation. Our highest resolution simulations are now at the level of the largest GMCs, in which the majority of the cold, star-forming gas mass is tied up. Following the evolution of these clouds therefore enables us to track the earliest stages of star formation and see how it is affected by global properties such as galactic potential and feedback.
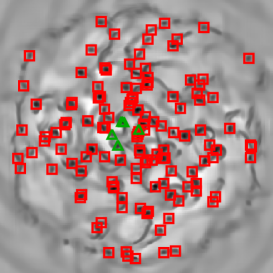
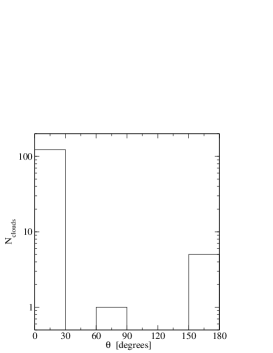
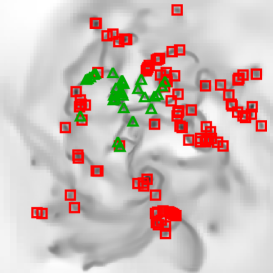
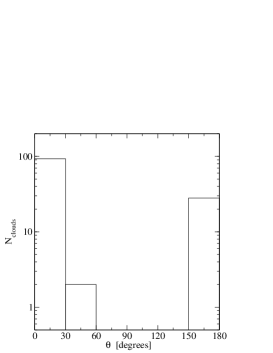
Figure 4 show the results from early, low-resolution simulations, which imply that the GMCs form with a prograde rotation (see also Kim, Ostriker, & Stone, 2003) but then interact and merge to generate a broader distribution of rotation directions, including a substantial fraction of retrograde rotators. Future simulations will quantify this evolution and, from comparison to observed clouds (e.g. Rosolowsky et al., 2003), place constraints on GMC lifetimes.
References
- Elmegreen (2002) Elmegreen, B. G. 2002, ApJ, 577, 20
- Kennicutt (1989) Kennicutt, R. C. 1989, ApJ, 344, 685
- Kennicutt (1998) Kennicutt, R. C. 1998, ApJ, 498, 541
- Kennicutt (2007) Kennicutt, R. C., Calzetti, D., Walter, F. et al. 2007, ApJ, 671, 333
- Kim, Ostriker, & Stone (2003) Kim W.-T., Ostriker E. C., Stone J. M., 2003, ApJ, 599, 1157
- Lada & Lada (2003) Lada, C. J., & Lada, E. A. 2003, ARA&A, 41, 57
- Li et al. (2005) Li, Y., Mac Low, M.-M., & Klessen, R. S. 2005, ApJ, 626, 823
- Robertson, Yoshida, Springel, & Hernquist (2004) Robertson, B., Yoshida, N., Springel, V., & Hernquist, L. 2004, ApJ, 606, 32
- Rosolowsky et al. (2003) Rosolowsky E., Engargiola G., Plambeck R., Blitz L., 2003, ApJ, 599, 258
- Schmidt (1959) Schmidt, M. 1959, ApJ, 129, 243
- Slyz et al. (2005) Slyz, A. D., Devriendt, J. E. G., Bryan, G., & Silk, J. 2005, MNRAS, 356, 737
- Tan (2000) Tan, J. C. 2000, ApJ, 536, 173
- Tasker & Bryan (2006) Tasker, E. J., & Bryan, G. L. 2006, ApJ, 641, 878
- Tasker & Bryan (2008) Tasker, E. J., & Bryan, G. L. 2008, ApJ, 673, 810
- Wada & Norman (2007) Wada, K., & Norman, C. A. 2007, ApJ, 660, 276