No periodicity revealed for an “eclipsing” ultraluminous supersoft X-ray source in M81
Abstract
Luminous supersoft X-ray sources found in the Milky Way and Magellanic Clouds are likely white dwarfs that steadily or cyclically burn accreted matter on their surface, which are promising type Ia supernova progenitors. Observations of distant galaxies with Chandra and XMM-Newton have revealed supersoft sources that are generally hotter and more luminous, including some ultraluminous supersoft sources (ULSs) that are possibly intermediate mass black holes of a few thousand solar masses. In this paper we report our X-ray spectral and timing analysis for M81-ULS1, an ultraluminous supersoft source in the nearby spiral galaxy M81. M81-ULS1 has been persistently supersoft in 17 Chandra ACIS observations spanning six years, and its spectrum can be described by either a eV blackbody for a white dwarf, or a eV multicolor accretion disk for a intermediate mass black hole. In two observations, the light curves exhibited dramatic flux drop/rise on time scales of seconds, reminiscent of eclipse ingress/egress in eclipsing X-ray binaries. However, the exhaustive search for periodicity in the reasonable range of 50 ksec to 50 days failed to reveal an orbital period. The failure to reveal any periodicity is consistent with the long period ( yrs) predicted for this system given the optical identification of the secondary with an asymptotic giant star. Also, the eclipse-like dramatic flux changes in hours are hard to explain under the white dwarf model, but can in principle be explained by disk temperature changes induced by accretion rate variations under the intermediate mass black hole model.
1 INTRODUCTION
Luminous supersoft X-ray sources were discovered with the Einstein Observatory and were established as an important new class of X-ray binaries based on ROSAT observations of 18 sources in the Milky Way and the Magellanic Clouds (Greiner 1996; Kahabka & van den Heuvel 1997 and reference therein). These sources have extremely soft spectra with equivalent blackbody temperatures of 15-80 eV and are highly luminous with bolometric luminosities of erg s-1. They are thought to be white dwarfs that are steadily or cyclically burning hydrogen accreted onto the surface. Remarkably, the accretion rates must be in a narrow range of , and the resultant luminosities are below erg s-1 as observed. White dwarfs with steady nuclear burning are promising Type Ia supernova progenitors because, unlike explosive nova events, they can retain the accreted matter and their mass can increase till it approaches the Chandrasekhar limit.
More and more supersoft sources have been discovered in distant galaxies with the advent of the Chandra and XMM-Newton X-ray observatories. These distant supersoft sources, as compared to the well-studied ones in the Milky Way and Magellanic Clouds, are generally hotter, more luminous and largely associated with spiral arms, suggesting they are young and massive systems (Di Stefano & Kong 2004). Some have bolometric luminosities, as derived from blackbody models, far above the Eddington luminosity ( erg s-1) for white dwarfs, which we call ultraluminous supersoft sources (ULS). One prototype ULS is M101-ULX1, which showed supersoft spectra of eV, 0.3-7 keV luminosities of erg s-1 and bolometric luminosities of erg s-1 during its 2004 outburst (Kong et al. 2004).
While the supersoft spectra of ULSs can be explained by a white dwarf burning accreted materials on its surface, the white dwarf model can not explain the extremely super-Eddington luminosities. On the other hand, an intermediate mass black hole (IMBH) of , as Kong et al. suggested, can naturally explain both the high bolometric luminosities and the supersoft spectrum given the scaling relation between the black hole mass and the accretion disk temperature. In the case of M101-ULX1, The IMBH nature is further evidenced by the observed spectral state transitions, which are reminiscent of the high-soft to low-hard transitions for stellar black hole binaries. Such IMBHs may have played an important role in the hierarchical merging scenario of galaxy formation (Madau & Rees 2001), and are under hot pursuit by workers in the fields of massive star clusters and of ultraluminous X-ray sources (Miller & Colbert 2004).
Swartz et al. (2002) observed the nearby spiral galaxy M81 with Chandra ACIS, and discovered a bright supersoft source in the bulge. Its supersoft spectrum can be fitted by a blackbody model with a temperature of eV and a bolometric luminosity of erg s-1. This source is thus a ULS, which we designate as M81-ULS1 in this paper. Given the high luminosity, Swartz et al. suggested that it could be a white dwarf burning Helium instead of Hydrogen, or an intermediate mass black hole (IMBH) of with as the inclination angle. A sudden flux drop by a factor of , Swartz et al. reported, occurred in less than one hour in the observation ObsID 390. This resembles the ingress of an eclipsing X-ray binary with a short period of several to several tens of hours, comparable to the periods for some canonical supersoft sources (Greiner 1996).
Here we report the follow-up X-ray study of M81-ULS1 with the 17 Chandra ACIS observations accumulated since its discovery. In §2 we describe the reduction of the observations and the spectral and temporal analyses of ULS1. Presented in §3 are the searches for possible periods for ULS1, which fail to obtain any period. The results are summarized and discussed in §4. The distance of M81 is taken to be 3.63 Mpc ( mag; Freedman et al. 1994) in this work.
2 ANALYSIS OF X-RAY DATA
There have been 17 Chandra observations of M81 nuclear region, where ULS1 resides. As listed in Table 1, these include two observations (ObsID 390, 2.4 ksec, 2000-03-21; ObsID 735, 50 ksec, 2002-05-07) analyzed by Swartz et al. (2002), and 15 monitoring observations of 1012 ksec each from 2005-05-26 to 2005-07-06 with an average separation of 3 days (PI: D. Pooley). All these observations were analyzed uniformly with CIAO 3.4. Point sources were detected with WAVDETECT on the individual and combined Chandra images. ULS1, at R.A.=09:55:42.2, Decl.=69:03:36.5, appeared on the S3 chip in all observations, and is about away from the M81 nucleus. Its photon lists for timing and spectral analysis were extracted from the source eclipses enclosing 95% of the total photons as reported by WAVDETECT.
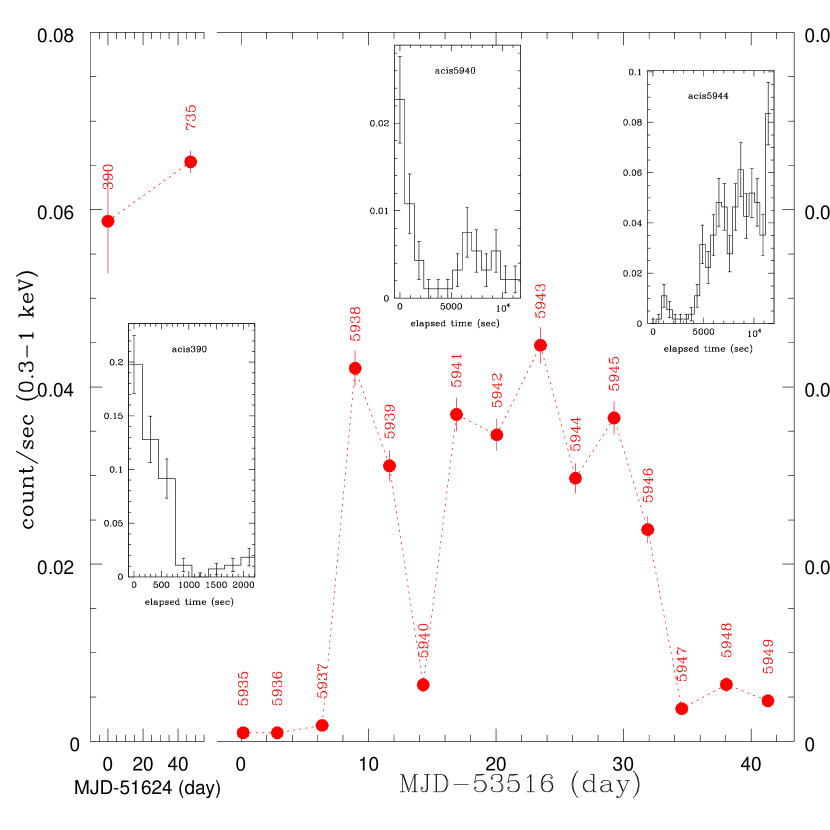
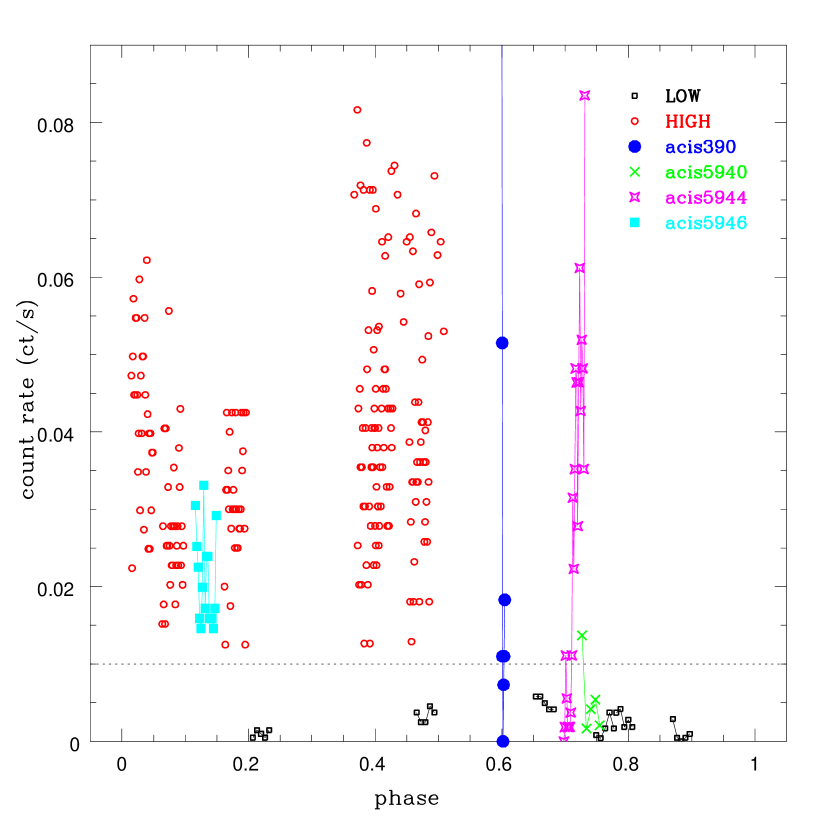
The light curve of ULS1 from the 17 observations over six years is shown in Figure 1. The count rates in these observations were corrected for deadtime and vignetting, which are usually less than 10% as listed in Table 1. The 2005 monitoring observations caught the source in a relatively low intensity state ( 0.01 count/sec) on 7 occasions, a high state ( count/sec) on 7 occasions, and a low to high transition in ObsID 5944. These high states, intermittent with 2 low states, clustered in about a month and appeared as a period of super activity out of low states. It is, however, not clear whether the low states or the high states represent the “normal” condition of the source due to the limited number of observations. Inspection of the individual light curves shows that the flux was quite steady during most observations. However, sudden flux drop and rise on time scales of sec, as shown in the Figure 1 inserts, were present in ObsID 390 and 5944, resembling ingress/egress in eclipsing X-ray binaries. In addition, the light curve in Obs ID 5940 exhibited a few bins above 0.01 ct/sec before its gradual decrease to below 0.01 ct/sec, and could have caught the tail of an ingress. The binary properties will be significantly constrained if an orbital period can be found, and the next section is devoted completely to searches for such a period.
ULS1 has been persistently supersoft in all 17 observations spanning six years. As shown in Table 1, the majority of the photons are in the soft band of 0.3-1.1 keV. For the 14 observations with 30 photons, the numbers of hard photons above 1.1 keV are only 2% of the total photons in 12 observations; the percentages are about 5% and 15% for ObsID 5944 and ObsID 390, which happen to be the two observations that show “eclipses” in their light curves. While photons are expected to harden in the eclipses, 12 out of the 13 photons in the “eclipse” of ObsID 390 (i.e., in the low state) are below 1.1 keV, thus the photon energy distribution is no harder than for photons out of “eclipse” (ie., in the high state). Similarly for ObsID 5944, 14 out of the 15 photons in the “eclipse” are below 1.1 keV. Further comparison between the energy distributions for photons in the low-state observations and for photons in the high-state observations reveals no significant difference. Spectra with 200 photons are fitted to absorbed blackbody models within 0.3-2 keV, and the results are listed in Table 1. The blackbody fits are quite acceptable, with temperatures clustered around 75 eV with a 11 eV standard deviation. The X-ray luminosities in 0.3-2 keV are in the range of 1.8-2.8 erg s-1, and the bolometric luminosities are in the range of 1.9-7.2 erg s-1. The neutral hydrogen column densities appear to cluster around two values, cm-2 and cm-2, but there are no apparent correlations with temperatures or count rates.
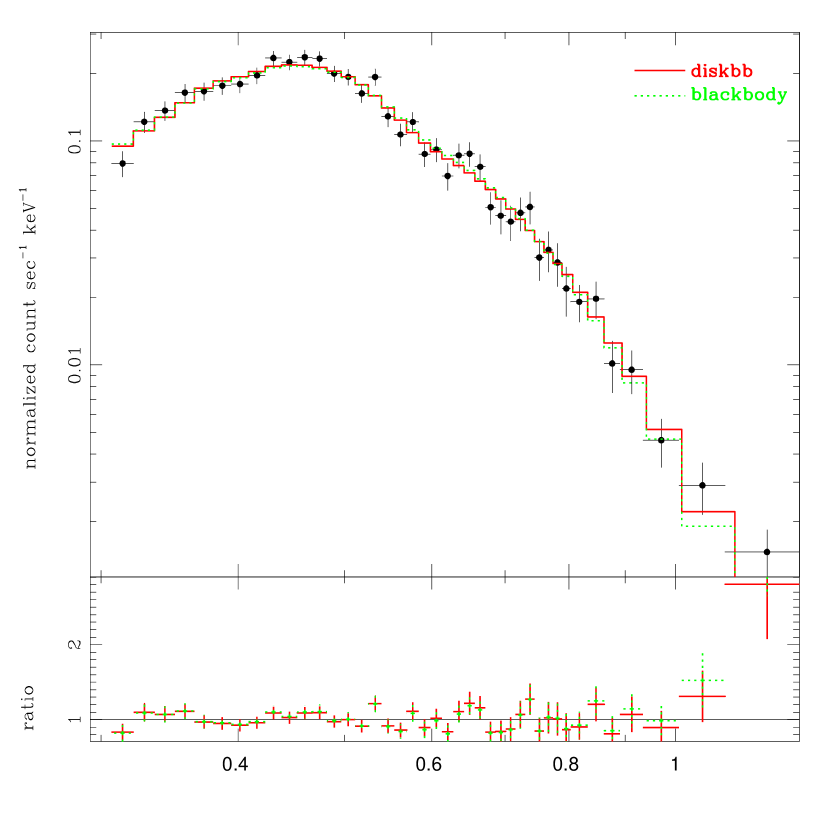
The spectral parameters are best constrained with the longest observation ObsID 735. This spectrum, as plotted in Figure 2, can be well fitted in the band of 0.3-2 keV by an absorbed black body model, with , cm-2, eV, erg s-1, and erg s-1. The spectral fit shows residuals in the two bins above 1 keV, suggesting presence of a hard component barely detected by the ACIS observation. Note that our spectral fits are slightly different from Swartz et al. (2002) because of different choices of energy bands and changes in the calibration files over the years. Like in canonical supersoft sources, the blackbody emission can come from the nuclear burning on the surface of a white dwarf. For such a system, the surface temperature increases monotonically with the white dwarf mass as illustrated in Iben (1982; Figure 2). The best-fit blackbody temperature would imply a white dwarf mass of .
The spectrum can be slightly better fitted by a multicolor disk model, with , cm-2, eV and erg s-1. As shown in Figure 2, the difference between the blackbody and multicolor disk models is hardly discernible below 0.8 keV. Above 0.8 keV, the diskbb model begins to predict slightly larger count rates, by 10% at 1 keV. As in the blackbody fit, an insignificant hard component is revealed only from the fitting residuals in two bins above 1 keV. For a thermal accretion disk, the black hole mass can be expressed as , with as the radiative efficiency, as the hardening factor, and as introduced to normalize the bolometric luminosity (Soria 2007 and references therein). The best fit inner edge temperature and the model luminosity would imply a black hole mass with all factors set to their default values. Alternatively, the model normalization (; is the distance in 10 kpc) gives the inner disk radius km; assuming corresponds to the last stable orbit, this implies an IMBH of , quite consistent with the estimate from the disk temperature.
3 SEARCHES FOR PERIODICITY
The light curves of ULS1 during ObsIDs 390/5944 exhibited “eclipses” suggestive of an eclipsing binary. To search for possible periodicity from the 17 observations, we binned the individual light curves to have an average of counts per bin for low-state ( ct/sec) observations, to have a total of 30 bins for high-state ( ct/sec) observations, and adjusted the bins to exhibit the sudden flux drop/rise in ObsIDs 390/5944. If the variations are mainly caused by the the donor eclipsing the accretor, and the bins in the low states of ObsIDs 390/5944 and in 7 low-state observations are in the eclipse, the low-state bins should cluster together to form only one eclipse when individual light curves are folded with the true period. Were ULS1 an eclipsing binary, the period should be longer than the longest observation ObsID 735 (50 ksec), during which the flux was steadily at a high state of 0.07 ct/sec. Also, the period should be shorter than 50 days given the alternating low/high states during the 2005 monitoring observations.
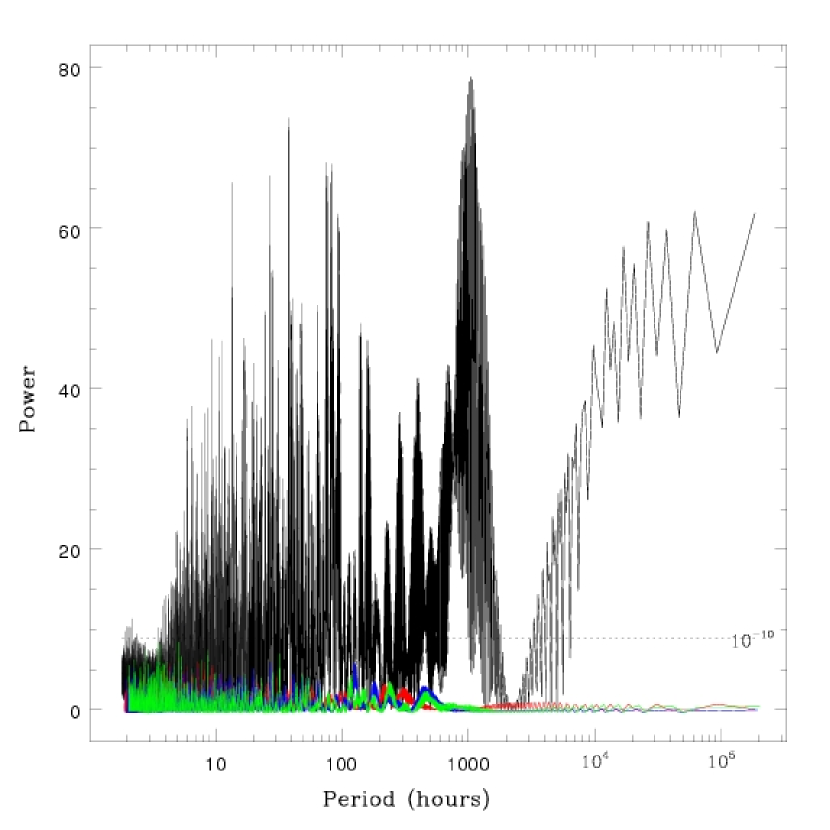
Two techniques were applied on the 17 binned light curves to search for possible periods. The first was the Lomb-Scargle method (Lomb 1976; Scargle 1982), which was devised to work on unevenly spaced data as in this case. This method calculates the Lomb periodogram for a range of trial periods and quantifies the significance as the probability for the periods to originate from a purely random signal. The Lomb periodogram for ULS1 is plotted in Figure 3, which shows a multitude of significant candidate periods with the probability from randomness smaller than . These candidate periods cluster around hours and hours, which is about the length of the 2005 monitoring observations. To check how the time windows of the observations affect the results, we computed the Lomb periodogram for Monte Carlo permutations of the observed light curves (i.e., re-assigned the count rate for one time bin to another bin randomly). As shown in Figure 3, the power for the Monte Carlo permutations is far less than for the observations, indicating that the resulted candidate periods come from the source variability rather than the time windows.
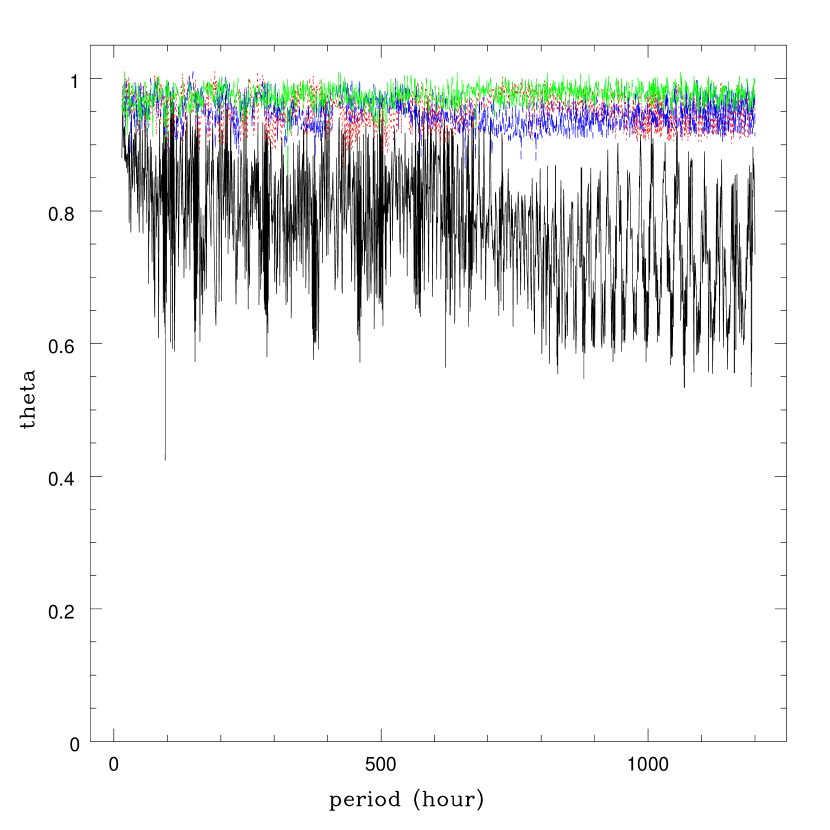
We also applied the phase dispersion minimization method as demonstrated in Stellingwerf (1978). For each trial period, this method folds the light curves and computes the dispersion of observations in phase bins. The phase dispersion was calculated for a period range of 15-1200 hours, and the result is plotted in Figure 4. A multitude of candidate periods are revealed as deep minima of , a measure of the phase dispersion. Given the number of data points in this calculation, corresponds to the probability of for the candidate period and associated phase dispersion to come from random fluctuations. Similar to the experiments for the Lomb-Scargle method, we find that the phase dispersion for the Monte Carlo permutated data is much higher than for the observed data, indicating that the resulted candidate periods come from the source variability rather than the time windows.
The reported significance of the candidate periods, however, is only testing the probability for the power or phase dispersion to come from random fluctuations. The small probability only negates their coming from random fluctuations, but is not always a guarantee that they come from truly periodic variations. To check the authenticity of these candidate periods, we utilize the criterion that, as naturally expected, there should be only one eclipse in the folded light curve. Eclipses are defined as dips of one or more low-state bins enclosed by high-state bins in the folded light curve. Technically, we assign 0/1 to low-state/high-state bins, and count an eclipse when a jump from 0 to 1 is detected in the folded light curve. This eclipse counting method is conceptually similar to the string-length method (Dworetsky 1983), but is computationally more efficient. We have computed the numbers of eclipses for several tens of significant candidate periods and visually checked their folded light curves. Interestingly, none of them could give only one eclipse in their folded light curves. Plotted in Figure 3 as an example is the folded light curve with four “eclipses” for the candidate period of 96.291 hours, the most significant from the phase dispersion minimization method. Apparently, such candidate periods are not qualified as the true orbital period for ULS1.
The failure to qualify these significant candidate periods led to the suspicion
that there was no binary periodicity in these observations at all.
However, a true period might have escaped the detection of the two employed
methods for some reasons, we thus tried to examine a continuous range of
periods from 50 ksec to 50 days with the one-eclipse criterion in search for a
true period.
First, periods should be excluded if they make a high-state light curve and a
low-state light curve overlapping in phase.
Assume a low state curve from to in time trails a high state
curve from to . The shortest period is to avoid overlapping in phase, and the maximum
number of periods between the two curves would be
.
To avoid overlapping after subtracting periods () from
the trailing light curve, periods should not satisfy
,
or ,
or ,
or .
These requirements lead to forbidden periods in ranges
,
and ,
and ,
and ,
which can be reduced to
.
In practice, we exclude periods that satisfy
for , with allowing for slight overlapping of
low/high states.
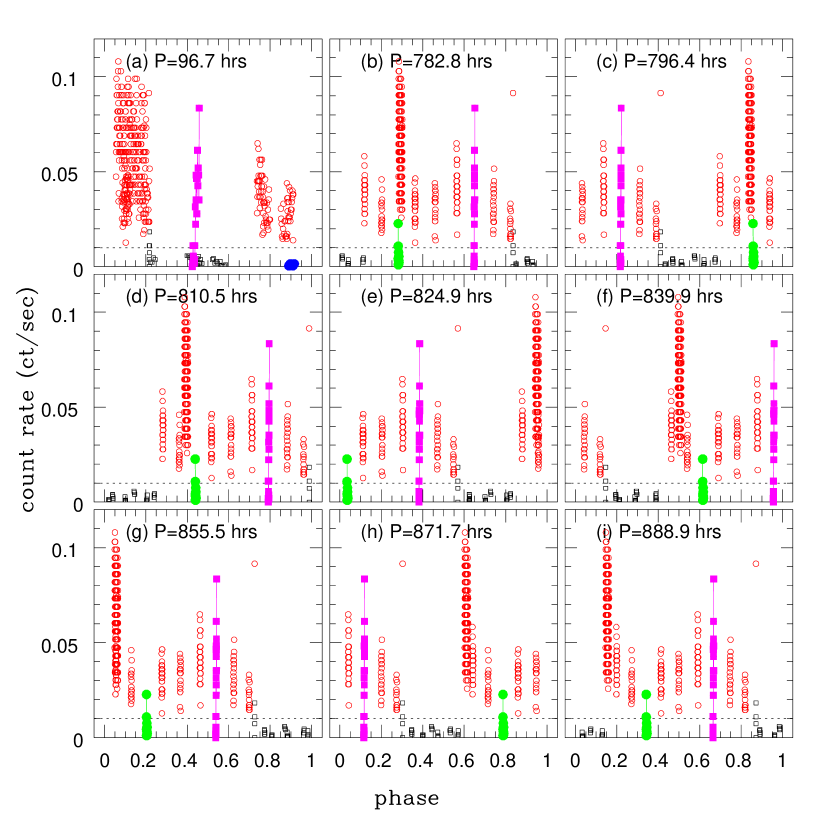
The forbidden period ranges were computed for each combination of a high-state light curve and a low-state light curve. The light curves for ObsIDs 390/5944 were split into two separate light curves, a high-state one and a low-state one. The allowed period ranges was obtained by excluding all the forbidden period ranges from the range of 50 ksec to 50 days. The continuous intervals of allowed periods was discretized with the period resolution set to . Under this period increment, the relative phase changes for the bins spanning (about six years) do not exceed , a tiny amount as compared to the width of possible eclipses. Such discretization makes the search for periodicity exhaustive, and guarantees not to miss the true period if it exists. This exhaustive search, however, failed to find any period that gave only one eclipse in the folded light curve; in fact, all discretized periods gave three or more eclipses as shown in Figure 6.
An assumption for the periodicity search was that all low-state bins were caused by eclipsing. If some low-state bins were caused by reasons other than eclipsing, they might have appeared as separate eclipses in addition to the true eclipse, thus disqualifying some trial periods as the true period. Since all discretized periods gave three or more “eclipses”, at least two out of the nine low-state observations (including ObsID 390/5944) should be considered as out-of-eclipse to possibly obtain a folded light curve with only one “eclipse”. The continuous period range of 50 ksec to 50 days was tested with different combinations of two low-state observations excluded, and two combinations were found to result in viable periods with only one “eclipse” in the folded light curves (Figure 7). The first combination of ObsIDs 5935/5944 led to viable periods around 96.7 hours, but the folded light curves showed an unreasonably wide eclipse (). The second combination of ObsIDs 5940/5944 led to eight intervals of viable periods evenly spaced in the range of 30-35 days, reflective of the duration of the super activities (with the two intervening low-state observations ObsIDs 5940/5944 excluded) in the 2005 monitoring observations.
4 DISCUSSION
Six years of Chandra ACIS observations have revealed the ultraluminous supersoft source M81-ULS1 as persistently supersoft despite the dramatic flux changes. The highest quality spectrum for M81-ULS1 can be well fitted by a multicolor disk around an IMBH of . The spectrum can also be well fitted by a blackbody model as for the nuclear burning on the surface of a white dwarf of , but the bolometric luminosity is 10 times higher than the Eddington luminosity for white dwarfs steadily burning hydrogen on the surface, and 5 times higher than for white dwarfs steadily burning helium (Iben & Tutukov 1989). The super-Eddington problem, however, may be solved by adopting more sophisticated white dwarf atmosphere models, experiments with which showed that they could reduce the bolometric luminosities by a factor of ten (van Teeseling et al. 1996). To summarize, the X-ray spectrum is consistent with M81-ULS1 being either an IMBH of or a massive white dwarf. X-ray observations thus lack the definitive power to distinguish between an IMBH accretor or a white dwarf accretor, and observations in lower energies are needed to understand the nature of the accretor.
The accretion disk should behave quite differently in presence of different accretors for the same observed X-ray luminosities. If the accretor is a white dwarf, the accretion disk, illuminated by the soft X-ray emission from the white dwarf surface, will flare up geometrically, intercept a large fraction of the X-ray emission and re-emit in lower energies (Popham & Di Stefano 1996). The emergent spectrum will take a form of in the optical (FKR 2002). If the accretor is an IMBH and thus the high X-ray luminosity is less than a few percents of the Eddington luminosity, the accretion disc will be a standard geometrically-thin optically-thick one (Shafee et al. 2007). The spectrum of such a thin thermal disk, conventionally described by a multi-color disc model (Mitsuda et al. 1984), is a powerlaw of in the optical. Such a difference may be picked up by optical and infrared observations. Indeed, optical studies of M81-ULS1 have identified M81-ULS1 as a bright point-like object, the spectral energy distribution of which can be decomposed into an AGB star as the companion and a blue component (Liu & Di Stefano 2007). The blue component is consistent with a powerlaw as from the accretion disk expected for an IMBH, but not consistent with a powerlaw expected for a white dwarf. This is strong observational evidence that M81-ULS1 is an IMBH instead of a white dwarf.
The light curves of ULS1 exhibited in two observations sudden flux drop/rise that resembled the eclipse ingress/egress for eclipsing X-ray binaries, suggestive of periodicity due to eclipsing. This tempted us to search for periodicity from the 17 observations for ULS1. The candidate periods obtained with the Lomb-Scargle and phase dispersion minimization methods, however, are all false periods because they do not satisfy the criterion that a true period should have only one “eclipse” in their folded light curves. Further examinations on possible periods in a continuous range of 50 ksec to 45 days, discretized in an exhaustive way, also fail to find any true period. We conclude that no periodicity is revealed over six years’ observations for M81-ULS1 despite the presence of apparent eclipse ingress/egress. Indeed, the optical identification of the secondary with an AGB star implies an orbital period of 30 years or longer if the AGB star overfills/underfills its Roche lobe given its supergiant size (; Liu & Di Stefano 2007). Such a long orbital period is consistent with the absence of periodicity over six years’ observations. On the other hand, it is possible to obtain folded light curves with only one “eclipse” for some periods scattered in the ranges of 30-35 days, if we dismiss the two low-state ObsIDs 5940/5944. However, there are no compelling reasons to dismiss these observations, and the resulted periods are inconsistent with the long orbit period expected given the AGB secondary.
What are the origins for the dramatic flux drop/rise within an hour observed in ObsIDs 390/5944? The failure to detect any periodicity suggests that they are not eclipses from the companion star blocking the primary; indeed, ingress/egress for an orbital period of 30 years or longer is expected to last days (or ), three orders of magnitudes longer than observed in ObsIDs 390/5944. If they originate from eclipsing by an intervening thick cloud of gas, this gas must have a huge size orders of magnitudes larger than the X-ray emitting region ( km), unbounded by the primary, move really fast at km/sec, yet block the primary repetitively, and cause changes in ; we cannot think of a reasonable scenario to produce such a cloud, and no correlated changes in were observed. This variability may be reminiscent of the stochastical oscillation between high state and low state of some stellar mass black hole X-ray binaries (e.g., GRS 1915+105, Cyg X-1), but ULS1 has never shown the accompanied hard/soft spectral state transition as observed for these sources.
Were ULS1 a white dwarf, such dramatic flux changes may be comparable to those observed in other supersoft sources. For example, Nova V382 Vel showed a flux drop by a factor of 2 within 1.5 hours (Orio et al. 2002), Nova Vl494 Aql exhibited a supersoft flare with flux increase by a factor of 6 that lasted about 15 minutes (Drake et al. 2003), and Nova V4743 Sagittarii showed the flux dropped to nearly zero within a few ks (Ness et al. 2003). Like in the case for M81-ULS1, the physical explanations are lacking for the the dramatic variability in these sources. Dramatic changes in the X-ray flux have also been observed, sometimes in anti-correlation with the optical fluxes, for canonical supersoft sources such as RX J0513.9-6951 (Reinsch et al. 1996) and CAL 83 (Greiner & Di Stefano 2002). They are usually understood as shifts of the spectrum peak due to the white dwarf photosphere expansion and contraction as a result of accretion rate changes, accompanied by the induced changes in the irradiation and heating of the accretion disk. The time scales for such changes, however, are a few days or longer rather than hours as observed in M81-ULS1.
The short timescale variability, however, can in principle be explained by the accretion disk changes if the accretor is an intermediate mass black hole. In response to the variations in the accretion rate, the accretion disk structure and temperature can change in as short as seconds even if the response time is as long as the dynamical timescale, which is short ( second) for black hole accretors. Because the accretion disk temperature is rather low ( eV), the X-ray observations are only catching the exponential tail of the emergent spectrum from the accretion disk, and a small change in temperature can lead to dramatic changes in the X-ray flux. We note that this mechanism has been used to explain the dramatic X-ray variability in narrow line Seyfert I nuclei and in some canonical supersoft sources as mentioned above.
References
- (1) Di Stefano, R. and Kong, A., 2004, ApJ, 609, 710
- (2) Drake, J., Wagner, R., Starrfield, S., et al. 2003, ApJ, 584, 448
- (3) Dworetsky, M., 1983, ApJ, 203, 917
- (4) Frank, J., King, A., and Raine, D, 2002, Accretion Power in Astrophysics, §5.10 [FKR 2002]
- (5) Freedman, W.,Hughes, S., et al. 1994, ApJ, 427, 628
- (6) Greiner, J. 1996, p299 in Supersoft X-ray Sources, ed. by Greiner, J.
- (7) Greiner, J. & Di Stefano, R., 2002, A&A, 387, 944
- (8) Iben, I. 1982, ApJ, 259, 244
- (9) Iben, I. and Tutukov, A. 1989, ApJ, 342, 430
- (10) Kahabka, P. and van den Heuvel, E., 1997, ARA&A, 35, 69
- (11) Kong, A., Di Stefano, R. & Yuan, F., 2004, ApJL, 128, 2783
- (12) Liu, J. and Di Stefano, R., 2007, submitted to ApJ Letters
- (13) Liu, J., Di Stefano, R., McClintock, J., et al. 2006, ApJ, 653, 602
- (14) Lomb, N.R., 1976, Astrophysics and Space Sciences, 39, 447
- (15) Madau, P. and Rees, M., 2001, ApJ, 551, 27L
- (16) Miller, M. Coleman, and Colbert, E., 2004, IJMPD, 13, 1
- (17) Mitsuda, K., Inoue, H., Koyama, K., et al. 1984, PASJ, 36, 74
- (18) Ness, J., Starrfield, S., Burwitz, V. et al. 2003, ApJL, 594, L127
- (19) Orio, M, Parmar, A. Greiner, J. et al. 2002, ApJL, 333, L11
- (20) Popham, R. and Di Stefano, R., 1996, p65 in Supersoft X-ray Sources, ed. by Greiner, J.
- (21) Reinsch, K., van Teeseling, A., et al. 1996, A&A, 309, L11
- (22) Scargle, J.D., 1982, ApJ, 263, 835
- (23) Shafee, R., Narayan, R. & McClintock, J. 2007, astroph/0705.2244
- (24) Soria, R. 2007, ApS&S, 311, 213
- (25) Stellingwerf, R., 1978, ApJ, 224, 953
- (26) Swartz, D., Ghosh, K., et al. 2002, ApJ, 574, 382
- (27) van Teeseling, A., Heise, J., & Kahabka, P., 1996, IAUS, 165, 445

| ObsID | Obs-Date | OAA | VigF | ExpT | Net | Soft | CountRate | Flux | dof | ||
|---|---|---|---|---|---|---|---|---|---|---|---|
| () | (ksec) | Counts | Counts | (ct/ksec) | erg/s/cm2 | (eV) | ( cm-2) | ||||
| acis390 | 2000-03-21 | 2.5 | 0.91 | 2.4 | 127 | 107 | 58 5.2 | 5.32e-13 | |||
| acis735 | 2000-05-07 | 3.2 | 0.97 | 49.9 | 3182 | 3155 | 66 1.2 | 5.28e-13 | 73 1.5 | 8.6 0.9 | 1.196/38 |
| acis5935 | 2005-05-26 | 1.0 | 0.92 | 11.0 | 10 | 7 | 1.0 0.3 | 9.23e-15 | |||
| acis5936 | 2005-05-28 | 1.0 | 0.90 | 11.4 | 10 | 9 | 1.0 0.3 | 9.39e-15 | |||
| acis5937 | 2005-06-01 | 0.9 | 0.99 | 12.0 | 20 | 18 | 1.7 0.4 | 1.53e-14 | |||
| acis5938 | 2005-06-03 | 0.9 | 0.99 | 11.8 | 456 | 448 | 39 1.8 | 3.77e-13 | 72 5.8 | 20.6 100 | 1.421/16 |
| acis5939 | 2005-06-06 | 0.8 | 0.99 | 11.8 | 329 | 326 | 28 1.6 | 2.82e-13 | 73 7.4 | 9.5 6.3 | 1.519/14 |
| acis5940 | 2005-06-09 | 0.8 | 0.99 | 12.0 | 65 | 63 | 5.5 0.7 | 5.55e-14 | |||
| acis5941 | 2005-06-11 | 0.8 | 0.99 | 11.8 | 387 | 381 | 33 1.7 | 2.98e-13 | 78 5.9 | 17.6 6.0 | 0.602/15 |
| acis5942 | 2005-06-15 | 0.8 | 0.99 | 12.0 | 371 | 364 | 31 1.6 | 3.19e-13 | 65 4.4 | 17.7 5.8 | 0.575/15 |
| acis5943 | 2005-06-18 | 0.8 | 0.99 | 12.0 | 511 | 498 | 43 1.9 | 3.77e-13 | 87 5.5 | 11.2 4.3 | 1.129/22 |
| acis5944 | 2005-06-21 | 0.8 | 0.99 | 11.8 | 334 | 312 | 29 1.6 | 2.78e-13 | 99 8.9 | 19.3 8.2 | 0.921/15 |
| acis5945 | 2005-06-24 | 0.7 | 0.99 | 11.6 | 380 | 376 | 33 1.7 | 2.90e-13 | 65 4.8 | 17.8 6.3 | 0.810/14 |
| acis5946 | 2005-06-26 | 0.7 | 0.99 | 12.0 | 253 | 252 | 21 1.3 | 2.06e-13 | 68 5.8 | 9.2 3.9 | 0.683/10 |
| acis5947 | 2005-06-29 | 0.6 | 0.99 | 10.7 | 31 | 30 | 2.9 0.5 | 2.50e-14 | |||
| acis5948 | 2005-07-03 | 0.6 | 0.99 | 12.0 | 60 | 59 | 5.1 0.7 | 4.80e-14 | |||
| acis5949 | 2005-07-06 | 0.6 | 0.99 | 12.0 | 41 | 40 | 3.5 0.5 | 2.99e-14 |